Keywords
Obesity; Mental retardation; Children; Khartoum state
Introduction
The importance of overweight and obesity related to people with Intellectual Disabilities (ID) is a particular problem of public health importance. Sudan is considered one of the worldwide nations facing this pressing problem [1].
Mental Retardation (MR) is one of the serious lifelong disabilities that have devastating effects on society and the health system. About 3% of children worldwide manifest some degree of MR [2] but its pathogenesis is poorly understood. Mentally disabled children, who are obese between the ages of seven and fourteen, are vulnerable to remain obese at the age of maturity and they are candidates to suffer from health problems such as diabetes, heart disease and others [3].
The prevalence of obesity among school children in Khartoum state aged from 10 to18 years is 9.0%. The prevalence of mentally retarded children in Khartoum state is 1.7% according to last Khartoum census (2008-2009) [4]. However, no studies were conducted in Khartoum state to show the prevalence of obesity in mentally retarded children [5].
The problem of mental disability has multiple aspects and dimensions. It has medical, social, educational, psychological, rehabilitation, and vocational dimensions. These dimensions overlap with each other which make this problem a unique model in the configuration and required cooperation between the different organizations in these areas to solve the problem [6].
Understanding the prevalence of obesity in populations of children with ID is an important undertaking, as the factors that give rise to obesity may not be the same as for Typically Developing (TD) children. Also prevention and treatment efforts may need to be tailored to meet their special needs [7].
Mental health services in Sudan focus mainly on provision of Generic adult psychiatric services and no special care services for children and adults with Mental Retardation [4]. The aim of this study was to assess the nutritional status of mentally disabled children in Khartoum state; Sudan, on the basis of anthropometric indicators and dietary intake.
Subjects and Methods
Study design and settings
This is a descriptive cross sectional study, that was conducted at all the forty private special education (non-governmental (institutes located in Khartoum state; Sudan, during the period from June 2014-Januraury 2015.
Study sample
All mentally retarded children between 10-18 years old attending all special education institutes in Khartoum state, were included in the study. Their total number was 290 child; 190 males and 100 females. Mentally retarded children younger than 10 or older than 18 years couldn't be included in the study, since there is no national figure reported for the prevalence of obesity among normal subjects for these age groups.
Study tools
An interview questionnaire for personnel working at the institutes including data about different aspects of care provided for the attended children. Data collection questionnaire for the guardians or mothers including demographic data as: age, sex, residence and socioeconomic data as: family size, birth order of the child, educational, working and marital statuses for both parents [8].
Data tools for children's nutritional assessment were in the form of: anthropometric measurements, dietary assessment and a questionnaire to assess mothers' nutritional knowledge. Height, weight and Body Mass Index (BMI) were calculated. Obesity was defined as BMI ≥ 95th percentile for age and sex [9]. BMI was calculated by taking child’s weight in kilograms divided by the square of his/her height in meters (kg/m2). Percentile comparison is based on the sex-specific BMI for age growth charts from the Center for Disease Control and Prevention [10].
The amounts of macro (protein, fat and carbohydrate) and micro (calcium) nutrients received through the diet have been assessed by calculating the data obtained from the twentyfour hour recall food consumption sheet [11] after asking the mother or guardian most knowledgeable about the child’s dietary intake. To assess portion sizes a sample of household measures was used (standard glass, cup, bowl, cooking ladle, serving spoon, tablespoon and teaspoon). Data were analyzed using the Egyptian National Nutrition Institutes (Food Information System) Food Consumption Analysis Program [12], to estimate the mean energy, protein, carbohydrate, fat, calcium, vegetables and fruits intake of subjects. The RDA [13] was used to calculate the percent difference in consumption of the above nutrients. Patient’s dietary intake was classified into five classes using RDA cut-off levels: unsafe (≤ 50%), needs improvement (50%-75%), accepted (75%-100%), normal (100%-120%), unaccepted (≥ 120%).
Assessment of mothers' nutritional knowledge was done using a questionnaire included the following questions: ideal numbers of meals/day, components of the complete meal, importance and sources of macronutrients (carbohydrate, protein and fat) and micronutrients (vitamins and minerals), types of healthy fatty substance, importance of milk and milk products for bone and teeth development and allowance of caned or preserved food for children (11).
All children had an Intelligence Quotient (IQ) test done within the last six months prior to the start of this study. It was conducted using the Stanford – Binet test that was adapted to the Sudanese culture by psychologists [14] For IQ Classification, the International Classification of Diseases-10 (ICD-10) was used [15].
Scoring system
A socioeconomic status scoring system was done using the following cutoff levels (Low level: less than 8, Intermediate 8-18, High: 19-28) [8]. Women's nutritional knowledge was evaluated on a scale of 0 to 13 points in response to the thirteen questions included in the questionnaire, one point was given for the correct answer and zero for the wrong one with a total score of 13 points that was classified into low (0-5) and high (6-13) score respectively.
Data analysis
Data were entered and analyzed using SPSS (Statistical Package for Social Science IBM version 21). For quantitative variables, mean, median and standard deviation were used, while frequencies and percentage were used for categorical variables. Statistical differences were tested using Chi Square test. P value less than 0.05 was considered statistically significant.
Ethical consideration
Permission was attained from Ministry of Health and Population (MOHP) in Khartoum state; Sudan. After explaining the aim of the study, verbal consent was taken from parents before data collection. Confidentiality and privacy were also assured.
Results
Results of the present study revealed that more than half of the studied children were either overweight (26.2%) or obese (28.3%) (Figure 1).
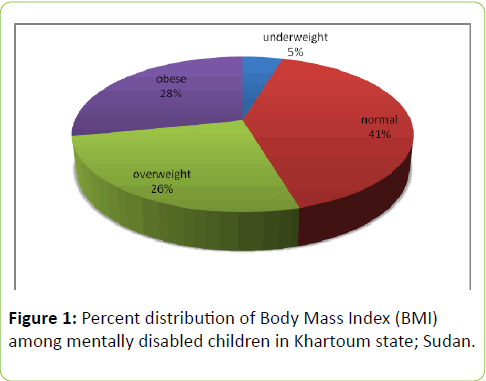
Figure 1: Percent distribution of Body Mass Index (BMI) among mentally disabled children in Khartoum state; Sudan.
Table 1 illustrated socio-demographic characteristics and medical history of the study group. More than half of the sample was males (65.5%). Most of the study group (62.8%) had five or more family members. A small percent (16.9%) of the children had other mentally retarded siblings. Sixty one percent are of the middle socioeconomic status. About one fifth (22.4%) had profound or severe mental retardation, but nearly half (47.3%) had mild or border line mental retardation. Most of the mentally disabled children (83.1%) had no other disability and 90% of them spent less than five years in the studied institutes.
| Variables |
Number=290 |
Percent (%) |
| Age (years) |
| 10 - |
181 |
62.40% |
| 15 - 18 |
109 |
37.60% |
| Sex |
| Male |
190 |
65.50% |
| Female |
100 |
34.50% |
| Family size |
| <5 |
108 |
37.20% |
| ≥5 |
182 |
62.80% |
| Consanguinity |
| Yes |
154 |
53.10% |
| No |
136 |
46.90% |
| Socioeconomic status |
| low |
20 |
6.90% |
| middle |
177 |
61.00% |
| high |
93 |
32.10% |
| IQ |
| <20 (profound) |
16 |
5.50% |
| 20-34 (severe) |
49 |
16.90% |
| 35-49 (moderate) |
88 |
30.30% |
| 50-69 (mild) |
109 |
37.60% |
| 70-84 (border line) |
28 |
9.70% |
| Other disability |
| No |
241 |
83.10% |
| Auditory |
28 |
9.70% |
| Motor |
9 |
3.10% |
| Speech and language |
8 |
2.80% |
| Visual |
4 |
1.40% |
| Timing of disability |
| Since birth |
211 |
72.80% |
| After birth |
79 |
27.20% |
Table 1: Characteristics of the study group.
Almost three quarters of the disabled children (72.8%) acquired their handicapping condition since birth. Nearly one fifth (17.9%) were diagnosed as having cerebral palsy, less than half (44.8%) as Down's syndrome, and very small proportion of them (3.1%) had iodine deficiency (Table 1).
Assessment of the institutes' general condition revealed that less than half (42.5%) were in a good condition. All the institutes offered educational services (100%), while only 7.5% and 2.5% offered sports and medical services respectively. (Un-tabulated data)
As shown in Table 2 the mean caloric, protein, fat and carbohydrate intake of the study group was (1696.9 ± 506.6) Kcal, (61.6 ± 19), (47.1 ± 18.2) and (256.6 ± 80.8) gm respectively. Their mean calcium intake was (524.3 ± 309.5) mg. Vegetables consumption was (104.1 ± 69.7) gm, whereas (129.1 ± 52.2) gm was consumed from fruits as an average mean for the whole sample. Also analysis indicated that out of the 282 children who eat vegetables, 96.6% have 1-3 servings per day while out of the 264 children who eat fruits, 88.9% have 1-3 servings per day.
| Food items |
Mean+SD |
Median |
Minimum |
Maximum |
| Calorie (gm) |
1696.9+506.6 |
1652.4 |
640.4 |
3588.8 |
| Total protein (gm) |
61.6 +19.0 |
58.7 |
15.8 |
128.6 |
| Total fat (gm) |
47.1 +18.2 |
43.6 |
13.5 |
131.9 |
| Total carbohydrate (gm) |
256.7+80.8 |
245.3 |
104.3 |
564.9 |
| Total calcium (mg) |
524.3+ 309.5 |
490.6 |
136.5 |
4689.9 |
| Total vegetable (gm)* |
104.1+ 69.7 |
93.5 |
1 |
406 |
| Total fruit (gm)° |
129.1+ 52.2 |
120 |
2 |
270 |
| *Number=282º Number=86 |
Table 2: Macronutrient and micronutrient caloric intake of the study group.
Dietary assessment was carried out by a 24-hour recall food frequency list and the mean nutrient intake was calculated to find out percent difference from the RDA. Results estimated that most of the energy intake comes from carbohydrate (60.5 ± 6.1) % and (24.9 ± 5.4) % comes from fat (Table 3).
| Number=290 |
Protein |
Carbohydrate |
Fat Energy |
| Energy ratio % |
Energy ratio % |
ratio % |
| Mean +SD |
14.7+1.6 |
60.5+6.1 |
24.9+5.4 |
| Median |
14.5 |
61.1 |
24.5 |
| Minimum |
7.2 |
35 |
12.4 |
| Maximum |
19.9 |
73.5 |
46.8 |
Table 3: Macronutrient consumption as percentage of the total caloric intake of the study group.
Table 4 shows that more than half (54.8%) of the study group had unacceptable high intake of protein (≥ 120% of RDA). As regard their caloric intake, 74.9% of the sample had less than 75% of RDA. Out of which, 82.1% had 55-70% of their caloric intake from carbohydrate and 71.7% of the children had 20-30 % of their caloric intake from fat. Most of them (81.7%) had less than 50% of RDA as regard calcium.
| Variables |
Number=290 |
Percent (%) |
| Protein |
| <50% |
1 |
0.30% |
| 50-<75% |
23 |
7.90% |
| 75-<100% |
45 |
15.50% |
| 100-<120% |
62 |
21.40% |
| ≥120% |
159 |
54.80% |
| Calorie |
| <50% |
82 |
28.30% |
| 50-<75% |
135 |
46.60% |
| 75-<100% |
61 |
21.00% |
| 100-<120% |
10 |
3.40% |
| ≥120% |
2 |
0.70% |
| Calcium |
| <50% |
237 |
81.70% |
| 50-<75% |
43 |
14.80% |
| 75-<100% |
8 |
2.80% |
| 100-<120% |
1 |
0.30% |
| ≥120% |
1 |
0.30% |
| Protein Energy ratio |
| <10 % |
4 |
1.40% |
| 10-<15% |
176 |
60.70% |
| ≥15% |
110 |
37.90% |
| Carbohydrate Energy ratio |
| <55 % |
42 |
14.50% |
| 55-<70 % |
238 |
82.10% |
| ≥ 70% |
10 |
3.40% |
| Fat Energy ratio |
| < 20 % |
43 |
14.80% |
| 20-< 30 % |
208 |
71.70% |
| ≥ 30 % |
39 |
13.40% |
| Vegetables* |
| < 250 g |
273 |
96.80% |
| ≥ 250g |
9 |
3.20% |
| Fruits° |
| < 200g |
73 |
84.90% |
| ≥ 200g |
13 |
15.10% |
| * Number=282° Number=86 |
Table 4: Distribution of the studied group according to their intake of protein, calorie and calcium compared to RDA.
Table 5 illustrated a significant association between nutritional status and family size, a higher percent (67.7%) of the overweight and obese children had family members equal to or more than 5 (P=0.05), also it was detected that mothers of those children had a lower nutritional knowledge score with a significant p value (< 0.01).
| Variables |
Under wt/normal wt |
Over wt/obese |
P value |
| Number |
Percent (%) |
Number |
Percent (%) |
| Sex |
| Male |
86 |
45.30% |
104 |
54.70% |
0.905 |
| female |
46 |
46.00% |
54 |
54.00% |
|
| Family size |
| <5 |
57 |
43.20% |
51 |
32.30% |
0.05 |
| ≥5 |
75 |
56.80% |
107 |
67.70% |
|
| Years in Institution |
| ≤ 5 |
118 |
45.20% |
143 |
54.80% |
0.753 |
| >5 |
14 |
48.30% |
15 |
51.70% |
|
| Socioeconomic status |
| low |
12 |
60% |
8 |
40.00% |
0.397 |
| middle |
78 |
44.10% |
99 |
55.90% |
|
| high |
42 |
45.20% |
51 |
54.80% |
|
| Other Disability |
| Yes |
24 |
49.00% |
25 |
51.00% |
0.593 |
| No |
108 |
44.80% |
133 |
55.20% |
|
| Age (years) |
| 14-Oct |
79 |
43.60% |
102 |
56.40% |
0.41 |
| 15-18 |
53 |
48.60% |
56 |
51.40% |
|
| IQ |
| Sever e |
30 |
46.20% |
35 |
53.80% |
0.84 |
| Moderate |
42 |
47.70% |
46 |
52.30% |
|
| Mild |
60 |
43.80% |
77 |
56.20% |
|
| Mothers' nutritional knowledge score |
| Low 0-5 |
89 |
67.40% |
127 |
80.40% |
0.01 |
| High 6-13 |
43 |
32.60% |
31 |
19.60% |
|
Table 5: Association between BMI and risk factors of obesity among the study group.
Discussion
Although obesity affects individuals of all ages, genders, and racial/ethnic groups, people with disabilities appear to be at the highest end of the risk curve [16].
Obesity has been reported to be more prevalent among individuals with mental retardation compared to normal children [17]. Results of the present study showed that 26.2% and 28.3% of the children were overweight and obese respectively. In their study on nine schools for ambulatory children and adolescent with mild and moderate intellectual disability, Stwart et al., [18] alarmed that the prevalence of obesity was thirty six percent. Similarly, a study of school children with ID in France [19] found that both boys and girls had elevated levels (26%) of overweight and obesity. Also Mikulovic et al., [20] reported that adolescence with ID had higher rates of overweight and obesity than their non-disabled peers.
As people with disabilities are equally [21] or more subject to the global increase in overweight, it is essential to appraise specific developmental conditions to explicate what challenges must be faced.
Children with ID are subject to the same risk factors for obesity as TD youth, but they have additional risk factors. Developmental Disabilities (DD) may be the consequence of an inherited syndrome (e.g. inborn errors of metabolism or chromosomal aberrations) [6], several of these conditions have both ID and elevated weight as diagnostic characteristics [22]. In the present study consanguinity had been reported in 53.1% of the study sample, which is less than the national figure reported in Sudan [23], this is because the study was conducted in Khartoum state, the capital of Sudan and percentage is expected to be higher in peripheral areas of the country. Similarly, a study conducted in Iran reported that 77% of the consanguineous marriage resulting in mentally retarded children [24].
Children with physical disabilities also face weight-related problems. Most conditions that restrict movement make it difficult to expend calories usually result in weight gain. A study by Salaun and Berthouze-Aranda [19] confirmed that adolescents with ID had lower levels of physical fitness when compared with their typical peers and that they also had higher rates of obesity. Children with disabilities can also have limited access to physical activities [25]. Unfortunately, a very small percent of the studied institutes offered sports services and this might oppose nutritional effort delivered by the institutes to handle the problem of obesity among those children.
Psychotropic medications are often used for children with DD. Drugs by themselves don't alter weight. Instead, drugs may alter appetite, change food preferences, deregulate thyroid function, inducing fluid retention, or change hormone metabolism [26]. So, a medication is one of the variables that must be considered when evaluating weight changes among disabled children.
In the present study almost half (54.8%) of the study group had unaccepted high intake of protein (≥ 120% of RDA), whereas 74.9% had unexpected low caloric intake (< 75-100%) of RDA. This might be explained by involvement of other risk factors for the causation of obesity among studied children. Being consistent with results of previous studies [27,28], large scale further studies are recommended that may use more accurate dietary survey method as well as probing other risk factors that may lead to obesity in mentally disabled individuals.
Others considered that increasing energy expenditure may be easier than diet modification and can be accomplished through limiting sedentary behaviors; watching TV and playing computer games that must be replaced by walking or playing in parks to achieve negative energy balance [29].
Results of the present study showed that the children protein intake was high and carbohydrate intake was reasonable, but oily foods, fats, and dairy products had been restricted, which had worsened their calcium intake status. Our results regarding higher protein and lower fat intake in disabled children are in agreement with the study done by Zawila et al. [30]. Previous studies stated that the median intake for most of the micronutrients (e.g. calcium) was lower than the normal lowest value of RDA. Our study's data support this finding as their total calcium was (524.3 ± 309.5SD) mg [31,32].
Increasing fruits and vegetables consumption is one of the most important health behaviors. In this study dietary intake of vegetables and fruits was (104.1 ± 69.7SD) and (129.1 ± 52.2SD) gm respectively. This was consistent with results of a study done in Sultan Oman [33]. Promotion of this behavior may require attention to nutritional education and child feeding strategies of the parents.
Parents strongly influence their children's eating habits, as they not only choose the food, but also utter when it is suitable to consume food [34]. Maternal care varies depending on mother’s knowledge about nutrition and health. Most of the counseling in health care targeted at child nutrition is delivered via parents, but little is known about the effects of such counseling on the nutrition knowledge and dietary habits of the parents [35]. The present study concluded that high prevalence of obesity is significantly associated with poor nutritional knowledge of the mothers.
Parents are often unconscious of the serious health consequences associated with elevated weight or may consider that health concerns related to disability take precedence [36]. Preventing elevated weight status from affecting children with ID should be a high priority for parents. This can be achieved by encouraging families to eat nutritious meals, engaging in family exercise and discouraging sedentary behaviours.
Conclusion and Recommendations
Results of the present study showed that there is 26.2% and 28.3% prevalence of overweight and obesity among the studied children respectively. Combination of exposure to medication, genetic disorders, limited mobility or opportunities for physical activity and distorted eating habits placed DD youth at the risk of being obese. The nutritional status of mentally disabled children should be monitored closely, sufficient nutritional support should be provided and programs must be carefully designed to increase the physical activity patterns of this population, in order to ascertain normal body weight and a higher quality of life. Also large scale studies for effective preventive strategies must be developed to halt the epidemic of obesity at the early beginning.
References
- https://www.who.int/entity/nmh/events/2014/emro-ncd.pdf.
- Zeldin AS, Kao A. (2014) Mental Retardation Clinical Presentation.
- Spear B. (2004) Nutrition in Adolescence : Food, Nutrition and Diet therapy. (11th edn), Mahan K and Escott- Stump S, Krause's, Elsevier, USA.
- https://www.cbs.gov.sd/ar.
- Nagwa MA, Elhussein AM, Azza M, Abdulhadi NH (2011) Alarming high prevalence of overweight/obesity among Sudanese children. Eur J ClinNutr 65:409-411.
- Sebastian CS, Ahmed I (2014) Pediatric Mental Retardation 2007.
- Brownell KD, Stunkard AJ (2003) Behavioral treatment of obesity children in childhood obesity. (2ndedn), P.S.G Publishing Company, Littleton, Massachusetts U.S.A: 260-281.
- Jimmam RM, Macintyre S, Palta M (1998) Socioeconomic differentials in miss classification of height, weight and body massindex based on Questionnaire data. International Journal of Epidemiology 26: 860-866.
- Barlow SE (2007) Expert committee recommendations regarding the prevention, assessment, and treatment of child and adolescent overweight and obesity: summary report. Pediatrics 120: 164–192.
- Centers for Disease Control (2011) BMI for Children and Teens.
- Robert DL, David CN (2003) Nutritional Assessment (3rd edn), McGraw Hill Companies, New York: 163-215.
- Egyptian National Nutrition Institution (2006) Food composition table for Egypt (2nd edn) A.R.C. Cairo, Egypt.
- Department of Health and Human Services (2005) Department of Agriculture. Dietary Guidelines for Americans U.S.
- Fathia HS, Abdullah A, Rahman M, Mohamed Omer El (2011) Psychosocial Impacts of Mentally Retarded Children on Parents in Sudan. Midline 6: 7-16.
- World Health Organization (1992) The ICD-10 classification of mental and behavioral disorders clinical description and diagnostic guidelines.
- Akamatsu R (2007) A Measure of the Motives Underlying Snack Selection among Japanese Junior High School Students: The Snack Choice Questionnaire (SCQ),” Japanese Journal of Public Health 54: 89-97.
- James HR, Kiyoshi Y, Brienne MD, Edward W, Lawrence CV, et al. (2011) Obesity and Overweight Prevalence Among Adolescents With Disabilities. Preventing chronic disease, public health research, practice and policy Volume 8: A 41.
- Stewrt L, Van de Van L, Katsarou V, Rentziou E, Doran M, et al. (2007)High prevalence of obesity in ambulatory children and adolescent with intellectual disability. University of Edinburgh, Department of child life and health, Edinburgh, Scotland, UK. Journal of Intellectual Disability Research 53: 882-886.
- Salaun L, Berthouze-Aranda SE (2011) Obesity in school children with intellectual disabilities in France. Journal of Applied Research in intellectual disabilities 24: 333-340.
- Mikulovic J, Marcellini A, Compte R, Duchateau G, Vanhelst J, et al. (2011) Prevalence of overweight in adolescents with intellectual deficiency. Differences in socio-educative context, physical activity and dietary habits. Appetite 56: 403–407.
- Nogay NH (2013) Nutritional status in mentally disabled children and adolescents: A study from Western Turkey. Pak J Med Sci29: 614-618.
- Grondhuis SN, Aman MG (2014) Overweight and obesity in youth with developmental disabilities: a call to action. Journal of intellectual disability Research 58: 787-799.
- National Household Baseline Survey (NHBS) (2010) Food and Nutrition Security Assessment in Sudan. Analysis of 2009 National Baseline Household Survey. Sudan Integrated Food Security. Information for Action (SIFSIA). Khartoum, Sudan.
- Jazayeri R, Saberi SH, Soleymanzadeh M (2010) Etiological characteristics of people with intellectual disability in Iran. Neurosciences 15: 258−261.
- Chen AY, Kin SE, Houtrow AJ,Newacheck PW (2010)Prevalence of obesity among children with chronic conditions. Obesity 18: 210-213.
- Corell CU (2007) Weight gain and metabolic effects of mood stabilizers and anti-psychotics in pediatric bipolar disorder, a systematic review and pooled analysis of short term trails. Journal of American Academy of child and adolescent. Psychopharmacology 46: 687-700.
- Dannhauser A, Walsh C, Nel M (2003) Nutritional Status of Disabled Schoolchildren in Bloemfontein. Department of Nutrition and Dietetics, University of the Free State, Bloemfontein. South Africa. SAJCN20: 6-14.
- MathurManju RD, Rachna B, Ramandeep B, Neena L, Sabita B, et al. (2007) Dietary Habits and Nutritional Status in Mentally Retarded Children and Adolescents: A study from North Western India. J. Indian Assoc. Child Adolesc. Ment. Health 3: 18-20.
- Kipping RR, Jago R, Lawlor DA (2008) Obesity in children. Part 2: Prevention and management British Medical Journal 337: 984-989.
- Zawila LG, Steib CS, Hoogenboom B (2003) The female collegiate cross-country runner: nutritional knowledge and attitudes. J Athl Train 38: 67-74.
- Juan CV, Annette LF, Clara IB, Mauricio D, Miyochi U, et al. (2008) Nutritional status and obesity in children and young adults with disabilities in Punta Arenas, Patagonia, Chile. International Journal of Rehabilitation Research31 :305-313.
- Thaana A, Dina Q, Sahar AA, Enas ES, Balsam AZ, et al. (2013) Intelligence Quotient In Relation To Nutritional State and Food Intake of High School Students. Jeddah Life Science Journal 10: 1987-2000.
- Ali AS, Layla AS, Fouad H, Sadeq AS, Saif AT, et al. (2011)Effect of Mothers Nutritional Knowledge and Attitudes on Omani Children’s Dietary Intake. Bahla Hospital, Bahla, Sultanate of Oman. Oman Med J 26: 253-257.
- Lobstein T, Baur L, Uauy R (2004) Obesity in children and young people a crisis in public health. Obesity 5: 4-85.
- Theodore D, Wachs Hilary CK, Santiago C, Enrique J (2005) Maternal Education and Intelligence Predict Offspring Diet and Nutritional Status. Community and International Nutrition. Department of Psychological Sciences, Purdue University, W. Lafayette, IN; Nutrition Unit, Pann- American Health Organization, Washington, DC.
- Dietz WH,Robinston TN (2005) Overweight children and adolescents, New England Journal of medicine 352: 2100-2109.