Keywords
Food insecurity; Food security; Obesity; Nutrition
Introduction
The United States Department of Agriculture (USDA) defines food insecurity as the limited or uncertain availability or ability to acquire, in a socially acceptable way, nutritious and safe foods adequate to sustain basic human health requirements [1]. More recently, the definition was expanded to state that if at any point during the previous year a household experienced uncertainty in the availability or ability to acquire foods sufficient enough to meet basic human needs, they were considered food insecure [2]. Thus from the perspective of being food secure, all household members there must have access and limited risk of losing access to healthy and safe foods [1].
Overall nationwide food insecurity trends have significantly decreased since 2014 [3]; however, rates varied considerably by household composition, race and ethnicity, income level, area of residence, and geographic location in the US [4]. According to the 2016 USDA report, households with children had higher food insecurity rates (16.5%) compared to both households without children (10.5%) and the national average (12.3%) [4]. Even higher rates were noted in households with children headed by a single parent (single woman 31.6%, single man 21.7% vs. married-couple 9.9%), in both black, non-Hispanic (22.5%) and Hispanic households (18.5%) compared to white, non-Hispanic (9.3%), and in households reporting incomes below the 185 percent of poverty line (31.6%) compared to those above (5.6%) [4]. Additionally, rural households (15%) experienced higher rates compared to both urban (14.2%) and suburban households (9.5%). Geographically, households located in the South (13.5%) had the highest reports of food insecurity rates compared to those in the Midwest (12.2%), West (11.5%), and the Northeast (10.8%) [4].
The USDA recommends assessing and addressing food insecurity at all ages, across all populations, and considers food security status as a measure of overall well-being [5]. Children living in food insecure households have been found to have, on average, lower overall dietary quality [6]; specifically, diets lower in dark green vegetables [7], fruit [8], and iron [8], and higher in french fries [9] and have a greater percentage of calories coming from fat [10] than food secure counterparts. Moreover, food insecure middle and high school youth reported eating fewer breakfasts and family meals, and perceived more barriers to eating a healthy diet than food secure youth in the same study [10]. Additionally, Gundersen et al. [11] found children living in food insecure homes were at an increased risk of poor overall health, including mental and psychosocial health. Food insecure children in the study reported higher rates of gastrointestinal distress and headaches, hospital admissions, iron deficiency, and poorer learning readiness than their counterparts [11]. Other health conditions among children associated with food insecurity include higher rates of asthma [12], anxiety and depression [12], and dental caries [13], in addition to reduced physical activity [14], academic performance and social skill development [15].
Similar to findings among youth, food insecurity among adults has been associated with various negative nutrition and health related outcomes. The diets of food insecure adults have been shown to have more inadequate vitamin A and B-6, vegetable, fruit, and dairy intake compared to food secure adults [8]. Additionally, food insecure adults were at an increased odds of various medical conditions including arthritis [16], diabetes [16], metabolic syndrome [17], stroke [16], hypertension [16], heart disease and high cholesterol [16,18], myocardial infarctions [16], kidney disease [19], and human immunodeficiency virus infection [20] vs. those in food secure households.
Prevalence of adult overweight and obesity have been found in both food secure and insecure households; however, higher rates of obesity among food insecure women have been noted compared to their counterparts [21-23]. Literature related to food insecurity and increased risk of overweight and obesity among children remains inconsistent [24-28]. Although youth body mass index (BMI) did not statistically differ by food insecurity status, Nguyen et al. [27] found youth BMI was23 statistically different among those who participated in government food assistant programs compared to those who did not. Further research is needed to investigate such contradictions on the relationship between youth weight and food insecurity status.
Because of the negative health impacts across the lifespan, food insecurity has become a public health concern. The American Dietetic Association (now the Academy of Nutrition and Dietetics) stated in a 2010 position paper that eliminating food insecurity among all populations, of all ages is vital to attain a healthy US population [20]. Additionally, food insecurity is addressed in Healthy People 2020 related to objectives about nutrition and increasing healthy food access [29]. And, for the first time, the relationships between food insecurity and health outcomes were acknowledged in the 2015-2020 Dietary Guidelines for Americans [30] with the Advisory Committee statement about the need for stronger federal nutrition policies and improved equity to healthy food access [31]. As the relationship between household food insecurity and its adverse impact on health continues to evolve, finding comprehensive models to accurately predict food insecurity are crucial.
Although household characteristics may provide potential predictors, no isolated indicator can predict household food insecurity status. As a multifaceted issue, involving all members of household, characteristics of various household members should be explored in food insecurity models. Including both youth and adult characteristics may lead to a more comprehensive predictive model for the household level measurement, rather than isolating family members in separate models.
As part of the iCook 4-H program, youth-adult dyads from diverse, rural, and/or low socioeconomic status populations completed a childhood obesity prevention program with sessions focused on cooking, eating, and playing together as a family. Grounded in the social cognitive theory (SCT) [32] and the 4-H experiential learning model [33], the iCook 4-H program design included a “learn by doing” approach with observational and hands-on learning. Key SCT components were incorporated to impact behavioral outcomes by having adults model and reinforce desired behavior to youth [32] while intertwining 4-H experiential learning, focusing on social support as a way to achieve a healthful lifestyle [33]. The objective was to determine the household food insecurity prevalence and predictors among youth-adult dyads, newly enrolled in the iCook 4-H study at baseline.
Methods
Study design
The iCook 4-H intervention was longitudinal multi-state study focused on nutrition education, physical activity, and family meals. Researchers conducted this collaborative project across their five respective states: Maine, Nebraska, South Dakota, Tennessee, and West Virginia. The study was a randomized control treatment design with baseline and follow-up assessments at 4, 12, and 24 months.
Participants
Participants were familial dyads with youth, 9-10 years, and their primary adult meal preparers. Dyads (with a focus on diverse, rural, and/or low socioeconomic status) were recruited by researchers, community stakeholders, 4-H program staff, and Extension specialists and educators through flyers, emails, and word-of-mouth in schools, after school programs, and other community outlets, such as recreation centers. Participants who indicated interest in person, through email, or over the phone were screened for eligibility before being enrolled in the program.
Selection of eligibility criteria was based on factors that would facilitate participation in the larger iCook 4-H study. Criteria specific to youth included being 9-10 years old at enrollment, and specific to the adult included being ≥ 19 years old. Additionally, both youth and adult eligibility criteria included: ability to participate in the iCook 4-H sessions with their adult primary meal preparer/their youth, being free of food allergies and activity-related medical restrictions, having Internet access, and consuming a diet that allowed for the intake of meat and dairy products. For the purposes of this project, treatment and control youth and adult participants were treated as one singular data source, as only baseline measurements were used. This sub-project used baseline data collected from iCook 4-H participants before the treatment group began receiving the intervention.
Data collection
Baseline assessments were collected from youth and adult participants from both the treatment and control group over a 6 weeks period between the end of July and early September, 2013. Youth and adult participants from both the treatment and control groups completed online surveys and physical assessments at baseline, 4, 12, and 24-month time points. Both youth and adult participants each received a $10 gift card incentive after each completed assessment. Other methods and outcomes for the overall intervention are described elsewhere [34,35]. All researchers completed human subjects’ research training and the Human Subjects Institutional Review Board for each participating state approved all research procedures.
Data collection instruments
The iCook 4-H program was pilot tested one year prior to the intervention study of which this project was part [36]. Pilot survey questions were developed by nutrition experts working on the project and were related to specific skills the program curriculum addressed as well as various sociodemographic indicators. Only variables used in this analysis are described below. Questions were face validated with youth and adults, revised, and administered during intervention implementation through online survey software (Qualtrics, Provo, UT, USA).
Sociodemographic questions
Youth demographic information included age, race, and sex. Adult demographic information included age, sex, marital status, education level, state of residence, and number of children in the household. Additionally, adults were asked to indicate their current participation in government assistance programs for low-income (up to 185% of poverty) individuals and families, such as Head Start, Supplemental Nutrition Assistance Program (SNAP), Temporary Assistance for Needy Families (TANF), or the Women, Infants and Children Program (WIC), which was used as a proxy for income.
Household food insecurity
The Six-Item Short Form of the USDA Household Food Security Survey Module [37] was used to measure household food insecurity. This abbreviated tool, shown to be a valid measure of food insecurity [38], was used to reduce respondent burden. Following the coding and assessment procedures outlined in the Six-Item Short Form, households were classified as food insecure if the participant responded affirmatively to two or more of the six household food insecurity questions [37]. Households were classified as food secure if the participant responded affirmatively to one or less of the six questions [37].
Body mass index
Trained research assistants collected anthropometric measurements of youth, including height and weight. These measurements along with age were used to calculate youth’s BMI-for-age percentile ranking in accordance with Centers for Disease Control and Prevention (CDC) growth charts. Percentile ranking allowed for determination of each youth’s weight category as underweight (less than the 5th percentile), healthy weight (5th percentile to less than the 85th percentile), overweight (85th to less than the 95th percentile), or obese (equal to or greater than the 95th percentile). Adult self-reported height and weight were used to calculate adult’s BMI, which allowed for determination of each adult’s weight status using standard CDC categories as underweight (<18.5), normal weight (18.5-24.9), overweight (25.0-29.9), or obese (≥ 30.0).
Data analyses
All analyses were performed using Statistical Package for the Social Sciences (SPSS) version 24.0. The outcome variable of interest was household food insecurity status. The online survey and codebook were reviewed to identify potential predictors of food insecurity status. Based on a conceptual model (Figure 1), 13 potential predictor variables of food insecurity status were investigated further: youth and adult race, sex, age and BMI, participation in government assistance programs (income proxy), adult marital status, adult education level, state of residence, and number of children living in the household.
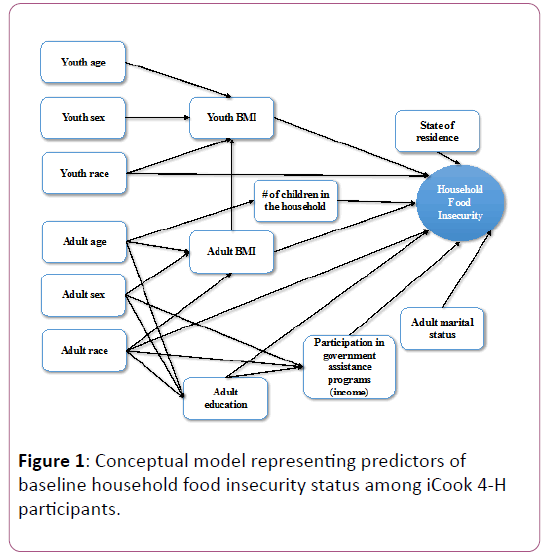
Figure 1: Conceptual model representing predictors of baseline household food insecurity status among iCook 4-H participants.
Data preparation and descriptive analyses
The independent variable, household food insecurity status, was dichotomized into food secure or food insecure. Twenty-two respondents who omitted food insecurity related responses were excluded. Out of the 228 dyads measured at baseline, 206 were included in this study. Because of the over representation of participants identifying as white compared to other race/ ethnicities, race/ethnicity was re-coded by combining Asian, Black, Hispanic, Native American, and Other race as one category; leaving white and non-white as two separate categories. The following categorical variables were dichotomous: youth and adult sex (male, female), participation in government assistance programs (yes, no), adult marital status (married, not married), and adult education level (at least an associate degree, some college or less). The following multicategorical variables were investigated: BMI (underweight, normal, overweight, obese) and state of residence (Maine, Nebraska, South Dakota, Tennessee, West Virginia). The age of youth was a count variable since only 9-10 year olds were included in the study while adult age was continuous. The number of children in the household was a count variable ranging from 0-7.
Percentages were calculated for all categorical variables. The continuous variable (adult age) was centered on the mean (39.13). Shapiro-Wilk test was used to test normality and shape of the distribution was assessed using a histogram of the centered variable. Chi-square tests were used to investigate bivariate relationships between the outcome (food secure, food insecure) and potential predictor variables with statistical inferences based on a critical p ≤ 0.05. One-way ANOVA tests were used to further investigate the relationships between both adult and youth BMI and participation in government assistance programs.
Binomial logistic model data
Simple binomial models between each potential predictor and the binomial food insecurity status outcome led to the multivariable binomial logistic model. Predictor variables that were significantly associated with the outcome (p ≤ 0.05) were considered for the final model. To avoid multi-collinearity issues, Pearson’s correlation coefficients were used to assess the twoway correlations between potential predictors.
Manual backwards elimination was used to fit the final multivariable binomial logistic model with all variables that had statistically significant simple associations with household food insecurity status, with a removal standard set at p ≤ 0.05. Confounding was assessed using a 20% change in parameter estimates when run with and without the potential confounder. Predictors with significant associations (p ≤ 0.05) or that were seen to have a 20% change on the other model variables were included in the final main effects model. Two-way interaction terms of the predictor variables in the final main effects model were assessed and statistically significant interaction terms were retained in the final model. The odds ratios (OR) and the associated 95% CIs were computed for all final model variables. Model goodness-of-fit was assessed using the Hosmer- Lemeshow test (final model p=0.838). The impacts of individual observations were assessed using appropriate graphs.
Results
Descriptive statistics
Sample characteristics of youth and adult participants are summarized in Table 1. Dyads (n=206) were diverse in race, sex, weight status, income, marital status, education level, state of residence, number of children, and household food insecurity status. The average youth age was 9.35 (SD ± 0.65) and the average adult age was 39.13 (SD ± 8.06) years. More than twothirds of youth (69.9%) and adults (74.8%) identified as white vs. non-white. Youth were more diverse in sex (43.7% male vs. 56.3% female) than adults (10.1% male vs. 89.9% female). More than half of youth were categorized as normal (58.3%) weight while over a third of youth were overweight (17.0%) or obese (19.9%). The majority of adults were categorized as obese (42.0%) with an additional 25.9% being overweight. More than half of the adult caregivers held no college degrees (55.3%), while more than two-thirds were married (68.9%). A majority of households did not participate in government assistance programs (57.8%) and had a mean of 2.75 (SD ± 1.23) children living in the house (range 0-7). The dyads were from 5 states (Maine, Nebraska, South Dakota, Tennessee, and West Virginia), with the largest fraction residing in Maine (27.2%). Thirty-four percent of households were deemed food insecure while the remaining 66% reported household food security based on survey responses.
| Characteristic |
Categories |
N=206m |
Weighted % |
| Youth |
| Age (years)a |
8 |
17 |
8.3 |
| 9 |
102 |
49.5 |
| 10 |
84 |
40.8 |
| 11 |
3 |
1.5 |
| Mean |
9.35 |
- |
| Standard Deviation |
0.65 |
- |
| Sexb |
Male |
90 |
43.7 |
| Female |
116 |
56.3 |
| Racec |
White |
144 |
69.9 |
| Non-white |
62 |
30.1 |
| Weight categoryd |
Underweight |
10 |
4.9 |
| Normal |
120 |
58.3 |
| Overweight |
35 |
17 |
| Obese |
41 |
19.9 |
| Adult (Primary Meal Preparer) |
| Age (years)e |
Mean |
39.13 |
- |
| Range |
20-67 |
- |
| Standard Deviation |
8.06 |
- |
| Sexf |
Male |
20 |
10.1 |
| Female |
178 |
89.9 |
| Racec |
White |
154 |
74.8 |
| Non-white |
52 |
25.2 |
| Weight categoryg |
Underweight |
2 |
1 |
| Normal |
60 |
31.1 |
| Overweight |
50 |
25.9 |
| Obese |
81 |
42 |
| Education levelh |
At least an associates |
92 |
44.7 |
| Some college or less |
114 |
55.3 |
| Adult marital statusi |
Married |
142 |
68.9 |
| Not Married |
64 |
31.1 |
| Household |
| Participation in government assistance programsj |
Yes |
87 |
42.2 |
| No |
119 |
57.8 |
| State of residence (dyads)k |
Maine |
56 |
27.2 |
| Nebraska |
37 |
18 |
| South Dakota |
34 |
16.5 |
| Tennessee |
35 |
17 |
| West Virginia |
44 |
21.4 |
| Number of children living in the housel |
Mean |
2.75 |
- |
| Range |
0-7 |
- |
| Standard Deviation |
1.23 |
- |
a Youth were asked via survey “Select your age.” Response options were 8, 9, 10, 11.
b Youth were asked via survey “Are you a boy or a girl?”
c Adults were asked via survey to “Select one group that best represents your child's race.” Response options were white, black, Asian, Hispanic, Native American, and other. All but “white” were classified as “non-white.”
d Youth height and weight were collected by trained researchers and used to calculate youth’s BMI-for-age percentile ranking in accordance with CDC growth charts. Percentile ranking was used to classify youth as healthy weight (>5th and <85th percentiles), overweight (≥ 85th and <95th percentiles), or obese (≥ 95th percentile).
eAdults were asked via survey to “Record your age in years.”
fAdults were asked via survey to “Select their sex.” Response options were male or female.
gAdult height and weight were self-reported and used to calculate adult’s BMI, which allowed for determination of each adult’s weight status using standard CDC categories as underweight (<18.5), normal weight (18.5-24.9), overweight (25.0-29.9), or obese (≥ 30.0).
hAdults were asked via survey to “Select the group that best represents your education level.” Response options were some college or less, or at least an associates degree.
iAdults were asked via survey “Are your married or not married?”
jAdults were asked via survey “Do you or any members of your family participate in any of the following? Aid to Families with Dependent Children (AFDC)/Temporary Assistance for Needy Families (TANF), Expanded Food and Nutrition Education Program (EFNEP), free/reduced price school meals, Medicaid, Welfare to Work (WTW), Special Supplemental Nutrition Program for Women, Infants, and Children (WIC), Supplemental Nutrition Assistance Program (SNAP), Supplemental Security Income (SSI)”
kAdults were asked via survey to “Select your state of residence.” Response options were Maine, Nebraska, South Dakota, Tennessee, or West Virginia.
lAdults were asked via survey to “Provide the number of children under the age of 18 living in your home.”
mSample size varies due to missing responses and rounding of weighted frequencies.
Table 1: Baseline demographic, socioeconomic, and weight status characteristics of household youth and adults (n=206 dyads) participating in iCook 4-H.
Bivariate relationships
Results of the chi-square analyses are summarized in Table 2. The following variables had significant relationships with the binomial household food insecurity status variable: race (youth p<0.001; adult p=0.019), youth sex (p=0.050), adult marital status (p=0.002), adult education (p<0.001), and participation in government assistance programs (p<0.001). However, age (youth p=0.199; adult p=0.051), adult sex (p=0.623), BMI (youth p=0.167; adult p=0.179), number of children living in the household (p=0.257), and states of residence (p=0.140) did not have a significant relationship with food insecurity. Non-white youth and adults, female youth, unmarried and less educated (some college or less) adults, and households participating in government assistance programs (income proxy) were more likely to live in a food insecure household than their counterparts.
| Characteristic |
Categories |
Food Securem (n=135; 59%)n % within independent variable |
Food Insecurem (n=71; 31%)n % within independent variable |
p-valueo |
| Youth |
| Age (years)a |
8 |
88.2 |
11.8 |
0.199 |
| 9 |
61.8 |
38.2 |
| 10 |
65.5 |
34.5 |
| 11 |
66.7 |
33.3 |
| Sexb |
Male |
73.3 |
26.7 |
0.05 |
| Female |
59.5 |
40.5 |
| Racec |
White |
73.6 |
26.4 |
<0.001 |
| Non-white |
46.8 |
53.2 |
| Weight categoryd |
Underweight |
60 |
40 |
0.167 |
| Normal |
70 |
30 |
| Overweight |
68.6 |
31.4 |
| Obese |
51.2 |
48.8 |
| Adult (Primary Meal Preparer) |
| Age (years)e |
0.051 |
| Sexf |
Male |
60 |
40 |
0.623 |
| Female |
66.3 |
33.7 |
| Racec |
White |
70.1 |
29.9 |
0.019 |
| Non-white |
51.9 |
48.1 |
| Weight categoryg |
Underweight |
50 |
50 |
0.179 |
| Normal |
76.7 |
23.3 |
| Overweight |
66 |
34 |
| Obese |
59.3 |
40.7 |
| Education levelh |
At least an associates |
83.7 |
16.3 |
<0.001 |
| Some college or less |
50.9 |
49.1 |
| Adult marital statusi |
Married |
72.5 |
27.5 |
0.002 |
| Not Married |
50 |
50 |
| Household |
| Participation in government assistance programsj |
Yes |
39.1 |
60.9 |
<0.001 |
| No |
84.9 |
15.1 |
| State of Residence (dyads)k |
| |
Maine |
67.9 |
32.1 |
0.14 |
| |
Nebraska |
51.4 |
48.6 |
| |
South Dakota |
79.4 |
20.6 |
| |
Tennessee |
60 |
40 |
| |
West Virginia |
68.2 |
31.8 |
| Number of children living in the housel |
0.257 |
aYouth were asked via survey “Select your age.” Response options were 8, 9, 10, 11.
bYouth were asked via survey “Are you a boy or a girl?”
cAdults were asked via survey to “Select one group that best represents your child's race.” Response options were white, black, Asian, Hispanic, Native American, and other. All but “white” were classified as “non-white.”
dYouth height and weight were collected by trained researchers and used to calculate youth’s BMI-for-age percentile ranking in accordance with CDC growth charts. Percentile ranking was used to classify youth as healthy weight (>5th and <85th percentiles), overweight (≥ 85th and <95th percentiles), or obese (≥ 95th percentile).
eAdults were asked via survey to “Record your age in years.”
fAdults were asked via survey to “Select their sex.” Response options were male or female.
gAdult height and weight were self-reported and used to calculate adult’s BMI, which allowed for determination of each adult’s weight status using standard CDC categories as underweight (<18.5), normal weight (18.5-24.9), overweight (25.0-29.9), or obese (≥ 30.0).
hAdults were asked via survey to “Select the group that best represents your education level.” Response options were some college or less, or at least an associates degree.
iAdults were asked via survey “Are your married or not married?”
jAdults were asked via survey “Do you or any members of your family participate in any of the following? Aid to Families with Dependent Children (AFDC)/Temporary Assistance for Needy Families (TANF), Expanded Food and Nutrition Education Program (EFNEP), free/reduced price school meals, Medicaid, Welfare to Work (WTW), Special Supplemental Nutrition Program for Women, Infants, and Children (WIC), Supplemental Nutrition Assistance Program (SNAP), Supplemental Security Income (SSI)”
kAdults were asked via survey to “Select your state of residence.” Response options were Maine, Nebraska, South Dakota, Tennessee, or West Virginia.
lAdults were asked via survey to “Provide the number of children under the age of 18 living in your home.”
mThe Six-Item Short Form, households were classified as food insecure if the participant responded affirmatively to two or more of the six household food insecurity questions [37]. Households were classified as food secure if the participant responded affirmatively to one or less of the six questions [37].
nSample size varies due to missing responses and rounding of weighted frequencies.
oP values determined via Pearson’s Chi-Square tests with food insecurity status as the dependent variable.
Table 2: Predictor prevalence and relationship with household food insecurity status at baseline among iCook 4-H participants.
Further, results of the one-way ANOVA analyses investigating the relationship between both adult and youth BMI, and household participation in government assistance programs are summarized in Table 3. No significant relationship was found between adult BMI category and participation in government assistance programs (p=0.078, F=3.150). However, there was a statistically significant relationship between youth BMI and participation in government assistance programs (p=0.012, F=6.497).
| Variable |
nd |
df |
F |
pe |
| Youth BMIa |
| Participation in government assistance programsc |
206 |
1 |
6.497 |
0.012 |
| Yes |
87 |
| No |
119 |
| Adult (Primary Meal Preparer) BMIb |
| Participation in government assistance programsc |
193 |
1 |
3.15 |
0.078 |
| Yes |
78 |
| No |
115 |
a Youth height and weight were collected by trained researchers and used to calculate youth’s BMI-for-age percentile ranking in accordance with CDC growth charts. Percentile ranking was used to classify youth as healthy weight (>5th and <85th percentiles), overweight (≥ 85th and <95th percentiles), or obese (≥ 95th percentile).
bAdult height and weight were self-reported and used to calculate adult’s BMI, which allowed for determination of each adult’s weight status using standard CDC categories as underweight (<18.5), normal weight (18.5-24.9), overweight (25.0-29.9), or obese (≥ 30.0).
cAdults were asked via survey “Do you or any members of your family participate in any of the following? Aid to Families with Dependent Children (AFDC)/Temporary Assistance for Needy Families (TANF), Expanded Food and Nutrition Education Program (EFNEP), free/reduced price school meals, Medicaid, Welfare to Work (WTW), Special Supplemental Nutrition Program for Women, Infants, and Children (WIC), Supplemental Nutrition Assistance Program (SNAP), Supplemental Security Income (SSI)”
dSample size varies due to missing responses and rounding of weighted frequencies.
ep values determined via one-way ANOVA with BMI category as the dependent variable.
Table 3: Associations of participation in government assistance programs with BMI category at baseline among iCook 4-H participants.
Multivariable binomial logistic model
Results of the final binomial logistic regression model are presented in Table 4. The revised conceptual model including the significant predictors and final model results are in Figure 2. All predictors, based on this final model, were significantly associated with household food insecurity status. Households with a non-white youth (p<0.001, OR=13.53, 95% CI: 3.33, 55.05), a less educated adult (p=0.001, OR=5.62, 95% CI: 2.01, 15.73), and participation in government assistance programs (p<0.001, OR=5.63, 95% CI: 2.63, 12.07) were more likely to be food insecure than their counterparts. Although, the statistically significant interaction term, youth race*adult education (p=0.001, OR=0.058, 95% CI: 0.01, 0.30) indicated a decrease in the odds of living in a food insecure household when the dyad was a non-white youth and less educated adult, the households with this combination of variables were still more likely to be food insecure.
| Characteristic |
Categories |
Food Insecure Householdd |
| ORe (95% CI) |
p-valuef |
| Youth |
| Racea |
Non-white |
13.53 (3.33, 55.05) |
<0.001 |
| White |
Reference group |
| Adult (Primary Meal Preparer) |
| Education Levelb |
Some college or less |
5.62 (2.01, 15.73) |
0.001 |
| At least an associates |
Reference group |
| Household |
| Participation in government assistance programsc |
Yes |
5.63 (2.63, 12.07) |
<0.001 |
| No |
Reference group |
| Interaction terms |
| Youth Racea*Adult Education Levelb |
- |
0.058 (0.01, 0.30) |
0.001 |
aAdults were asked via survey to “Select one group that best represents your child's race.” Response options were white, black, Asian, Hispanic, Native American, and other. All but “white” were classified as “non-white.”
bAdults were asked via survey to “Select the group that best represents your education level.” Response options were some college or less, or at least an associates degree.
cAdults were asked via survey “Do you or any members of your family participate in any of the following? Aid to Families with Dependent Children (AFDC)/Temporary Assistance for Needy Families (TANF), Expanded Food and Nutrition Education Program (EFNEP), free/reduced price school meals, Medicaid, Welfare to Work (WTW), Special Supplemental Nutrition Program for Women, Infants, and Children (WIC), Supplemental Nutrition Assistance Program (SNAP), Supplemental Security Income (SSI)”
dThe Six-Item Short Form, households were classified as food insecure if the participant responded affirmatively to two or more of the six household food insecurity questions [37]. Households were classified as food secure if the participant responded affirmatively to one or less of the six questions [37].
eOR=Odds ratio
fP values determined via binomial logistic regression tests with food insecurity status as the dependent variable.
Table 4: Final multivariable binomial logistic regression model investigating predictors of baseline household food insecurity status among iCook 4-H participants
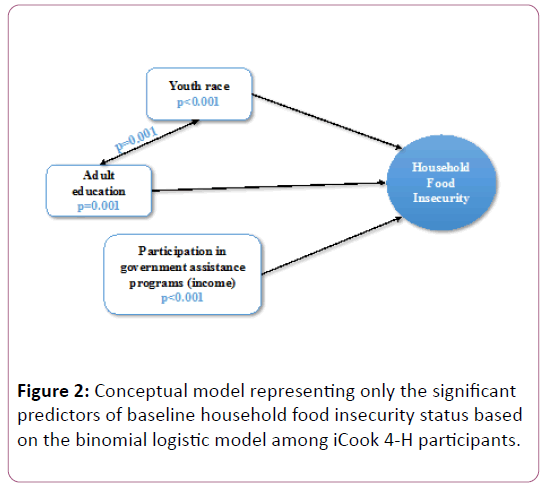
Figure 2: Conceptual model representing only the significant predictors of baseline household food insecurity status based on the binomial logistic model among iCook 4-H participants.
Discussion
Overall, for this sample, significant differences were found in the odds of living in a food insecure home by youth race, adult education, and participation in government assistance programs. Compared to national rates among black, non- Hispanic and Hispanic households [4], food insecurity rates among non-white youth and adult iCook 4-H participants were more than double. Similarly, rates among white youth and adult respondents were more than twice the national estimates for food insecure white, non-Hispanic households [4]. Although both food insecure non-white and white households were overrepresented in this study, consistent with previous reports, food insecurity was still disproportionately higher in minority households [4].
Bivariate relationships between race, both youth and adult, were significantly associated with food insecurity status, consistent with findings from a nationally representative sample [4]. However, notably adult race alone was significantly associated with food insecurity status, but when added to the binomial logistic model it no longer was a significant predictor. In a nationally representative sample, Coleman-Jensen et al. [4] examined characteristics of food insecure households by the head of household socio-demographics. Head of household data were not collected in the iCook 4-H study, which may have impacted study results [4]. However, using the final binomial logistic regression model, significant differences were found in the odds of living in a food insecure home by youth race. To produce more predictive food insecurity models, further research should be conducted to investigate the impact of both household youth and adult races on food insecurity.
Although previously researchers have shown significant differences between adult sex and food insecurity status [39], significant differences were not found in this study. Researchers have shown higher food insecurity rates among adult females compared to males [39]; however, overrepresentation of female adults in this study may have potentially limited the detection of this relationship. Although youth sex has been noted to play a role in the relationship between youth obesity and food insecurity status [15], studies on the direct connection between household food insecurity status and youth sex are limited. Although youth sex was not included in the final model, in this study female youth were more likely to be food insecure than male youth. With noted sex differences in adulthood [39], particular attention to potential sex differences in youth food insecurity status should be further investigated.
Adult demographics including educational level and marital status, and household characteristics including participation in government assistance programs were also significantly associated with food insecurity status, analogous to previous findings [4,40]. The prevalence of both household food insecurity and participation in government assistance programs among iCook 4-H dyads at baseline was nearly double the national averages [4,41]. These results echoed the program’s targeted recruitment efforts for low-income families.
Researchers investigating the relationship between food insecurity and BMI continue to produce inconsistent results [24-28]. No relationship between youth or adult BMI category and food insecurity status was found in the current study. However, similar to the findings from Nguyen et al. [27], youth BMI category was significantly different among those who participated in government assistant programs compared to those who did not. This discrepancy continues to support the need for more research on the relationships between government safety net programs and weight status.
Based on these study results, there might be important differences in the predictors between food secure and food insecure households. Although the interaction term youth race*adult education decreased the odds of living in a food insecure home, households with both a non-white youth and less educated adult were still more likely to be food insecure when compared to a household with only one of these characteristics. Providing a unique examination into the combined impact of both youth and adult predictors on household food insecurity status in a single logistic model, significant differences by youth race, adult education, and participation in government assistance programs on the odds of living in a food insecure home were noted. Interventions to address household food insecurity may be more effective if concentrated on both youth and adult characteristics.
Limitations
While still contributing important information to the literature, there are some notable limitations to this study. Although these data were collected from five different states across the US, the cross-sectional nature of the study is limiting. Without repeated measures over time, temporal sequencing was not possible. Therefore, casual inferences cannot be made from these data [42]. Additionally, self-reported data, including food insecurity status, participation in government assistance programs, and adult BMI are limiting and may lead to bias through misreporting [43].
Using binomial logistic regression models provides insight into differences between predictors and dichotomous outcomes. It is useful to compare predictors of food secure vs. food insecure households; however, this method limits interpretation to these macro levels of food insecurity. Because of sample size, this study was limited to this binomial model. In designing future research, there should be consideration for multinomial or ordinal logistic regression to further explore the connection between youth and adult characteristics at the micro levels of food insecurity including high food security, marginal food security, low food security, and very low food security.
Conclusion
Household food insecurity status was associated with race, youth sex, adult education and marital status, and government assistant program participation. Furthermore, based on the final logistic model, households with non-white youth, less educated adults, who participated in government assistance programs were more likely to be food insecure than their counterparts among iCook 4-H dyads. No relationship between BMI and food insecurity was observed in this study; however, youth BMI was associated with participation in government assistance programs, which warrants further investigation.
Acknowledgements
Agriculture and Food Research Initiative Grant no. 2012-68001-19605 from the USDA National Institute of Food and Agriculture, Childhood Obesity Prevention: Integrated Research, Education, and Extension to Prevent Childhood Obesity, A2101 and respective State Agriculture Experiment Stations.
Funding
Funding provided by Agriculture and Food Research Initiative Grant no. 2012-68001-19605 from the USDA National Institute of Food and Agriculture, Childhood Obesity Prevention: Integrated Research, Education, and Extension to Prevent Childhood Obesity, A2101 and respective State Agriculture Experiment Stations.
Competing and Conflicting Interests
The authors declare that there is no conflict of interest regarding the publication of this article.
References
- https://www.ers.usda.gov/topics/food-nutrition-assistance/food-security-in-the-us/definitions-of-food-security.aspx
- https://www.ers.usda.gov/publications/pub-details/?pubid=46904
- https://www.ers.usda.gov/topics/food-nutrition-assistance/food-security-in-the-us/key-statistics-graphics.aspx
- Coleman-Jensen A, Rabbitt MP, Gregory CA, Singh A (2016) Household food security in the United States in 2015. USDA, Economic Research Service.
- Nord M, Prell M (2007) Struggling to feed the family: What does it mean to be food insecure? Amber Waves 5: 32-39.
- Kaiser LL, Townsend MS (2005) Food insecurity among US children: Implications for nutrition and health. Top Clin Nutr 20: 313-320.
- Casey PH, Szeto K, Lensing S, Bogle M, Weber J (2001) Children in food-insufficient, low-income families: Prevalence, health, and nutrition status. Arch Pediatr Adolesc 155: 508-514.
- Hanson KL, Connor LM (2014) Food insecurity and dietary quality in US adults and children: A systematic review. Am J Clin Nutr 100: 684-692.
- Lorson BA, Melgar-Quinonez HR, Taylor CA (2009) Correlates of fruit and vegetable intakes in US children. J Am Diet Assoc 109: 474-478.
- Widome R, Neumark-Sztainer D, Hannan PJ, Haines J, Story M (2009) Eating when there is not enough to eat: Eating behaviors and perceptions of food among food-insecure youths. Am J Public Health 99: 822-828.
- Gundersen C, Kreider B (2009) Bounding the effects of food insecurity on children’s health outcomes. J Health Econ 28: 971-983.
- Cook JT, Black M, Chilton M, Cutts D, Ettinger de Cuba S, et al. (2013) Are food insecurity's health impacts underestimated in the US population? Marginal food security also predicts adverse health outcomes in young US children and mothers. Adv Nutr 4: 51-61.
- Chi DL, Masterson EE, Carle AC, Mancl LA, Coldwell SE (2014) Socioeconomic status, food security, and dental caries in US children: Mediation analyses of data from the national health and nutrition examination survey, 2007-2008. Am J Public Health 104: 860-864.
- To QG, Frongillo EA, Gallegos D, Moore JB (2014) Household food insecurity is associated with less physical activity among children and adults in the US population, 2. J Nutr 144: 1797-1802.
- Jyoti DF, Frongillo EA, Jones SJ (2005) Food insecurity affects school children’s academic performance, weight gain, and social skills. J Nutr 135: 2831-2839.
- Venci BJ, Park S, Lee SY (2013) Functional limitation and chronic diseases are associated with food insecurity among US adults. FASEB J 27: 1054-1057.
- Parker ED, Widome R, Nettleton JA, Pereira MA (2010) Food security and metabolic syndrome in US adults and adolescents: Findings from the national health and nutrition examination survey, 1999-2006. Ann Epidemiol 20: 364-370.
- Stuff JE, Casey PH, Connell CL, Champagne CM, Gossett JM, et al. (2007) Household food insecurity and obesity, chronic disease, and chronic disease risk factors. J Hunger Environ Nutr 1: 43-62.
- Crews DC, Kuczmarski MF, Grubbs V, Hedgeman E, Shahinian VB, et al. (2014) Effect of food insecurity on chronic kidney disease in lower-income Americans. Am J Nephrol 39: 27-35.
- Holben D (2010) Position of the american dietetic association: Food insecurity in the United States. J Am Diet Assoc 110: 1368-1377.
- Olson CM (2005) Food insecurity in women: A recipe for unhealthy tradeâ€ÂÂÂÂoffs. Top Clin Nutr 20: 321-328.
- Townsend MS, Peerson J, Love B, Achterberg C, Murphy SP (2001) Food insecurity is positively related to overweight in women. J Nutr 131: 1738-1745.
- Adams EJ, Grummer-Strawn L, Chavez G (2003) Food insecurity is associated with increased risk of obesity in California women. J Nutr 133: 1070-1074.
- Kaur J, Lamb MM, Ogden CL (2015) The association between food insecurity and obesity in children-The national health and nutrition examination survey. J Acad Nutr Diet 115: 751-758.
- Holben DH, Taylor CA (2015) Food insecurity and its association with central obesity and other markers of metabolic syndrome among persons aged 12 to 18 years in the United States. J Am Osteopath Assoc 115: 536-543.
- Lohman BJ, Stewart S, Gundersen C, Garasky S, Eisenmann JC (2009) Adolescent overweight and obesity: Links to food insecurity and individual, maternal, and family stressors. J Adolesc Health 45: 230-237.
- Nguyen BT, Ford CN, Yaroch AL, Shuval K, Drope J (2017) Food security and weight status in children: Interactions with food assistance programs. Am J Prev Med 52: S138-S144.
- Larson NI, Story MT (2011) Food insecurity and weight status among US children and families: A review of the literature. Am J Prev Med 40: 166-173.
- https://www.healthypeople.gov/
- https://health.gov/dietaryguidelines/2015/guidelines/
- https://health.gov/dietaryguidelines/2015/resources.asp
- Bandura A (1977) Social learning theory. Englewood Cliffs, NJ.
- Pfeiffer JW, Jones JE (1975) Reference guide to handbooks and annuals. University Associates.
- White AA, Colby S, Franzen-Castle L, Kattelmann K, Olfert M (2014) iCook: A 4-H program to promote culinary skills and family meals for obesity prevention. J Nutr Educ Behav 46: S199-S200.
- White A, Franzen-Castle L, Kattelmann K, Colby S, Olfert M (2016) Cooking, eating and playing together: iCook 4-H Year 4. J Nutr Educ Behav 48: S134.
- Miller A, Franzen-Castle L, Aguirre T, Krehbiel M, Colby S, et al. (2016) Food-related behavior and intake of adult main meal preparers of 9-10 year-old children participating in iCook 4-H: A five-state childhood obesity prevention pilot study. Appetite 101: 163-170.
- https://hungerfreecommunities.org/wp-content/uploads/2011/04/USDA-guide-to-measuring-food-security.pdf
- Blumberg SJ, Bialostosky K, Hamilton WL, Briefel RR (1999) The effectiveness of a short form of the household food security scale. Am J Public Health 89: 1231-1234.
- Jung NM, de Bairros FS, Pattussi MP, Pauli S, Neutzling MB (2017) Gender differences in the prevalence of household food insecurity: A systematic review and meta-analysis. Public Health Nutr 20: 902-916.
- https://endhomelessness.atavist.com/mayorsreport2016
- https://www.census.gov/content/dam/Census/library/publications/2015/demo/p70-141.pdf
- Rothman KJ, Greenland S (2005) Causation and causal inference in epidemiology. Am J Public Health 95: S144-S150.
- Arnold HJ, Feldman DC (1981) Social desirability response bias in self-report choice situations. Acad Manage J 24: 377-385.