Keywords
VEP; AEP; Wavelet; Visual n400
Introduction
Evolutionary dyslexia is a clinical condition involving 3% of school-age children in Italy; it is evident that persisting difficulties in learning and in automatization of basic reading mechanisms show up with the disease. The first attempts to explain developmental dyslexia followed the neuropsychological doctrine hypothesis, so the presence of cerebral damage, even if of congenital nature, at the level of gyrus angolaris; a structure designated to the storage of the visual forms of words. In contrast with this hypothesis, Orton [1,2] suggested that evolutionary dyslexia were correlated with an evolutionary delay in the development of the cerebral hemispheric dominance for language. According to this hypothesis, both linguistic symbols are mirrored in the two hemispheres and the lack of dominance development in one of the cerebral hemisphere (left) means an erroneous visual perception of symbols with consequent confusion in spatial orientation and mistakes in the inversion of mirror letters.
The acceptance of Orton’s hypotheses, concerning inverted letters as a main symptom of evolutionary dyslexia, had a great influence both in clinical and pedagogical environments up to present. Hermann [3], hypothesized an inadequate development of the cortical coordinator and such a dysfunction manifested itself as a lack of spatial orientation, supporting this by the evidence of right-left disorientation, mistakes of inversion, rotation/sequence that are all usually observed in the reading and writing of dyslexic subjects. Liberman [4,5], highlighted the fact that errors of inverted letters/words are a very small part of the types of mistakes made by dyslexic subjects, in facts according to this author errors tend to occur in the first phases of learning of any written language and are not at all exclusive to dyslexic children but are typical of non-dyslexic children as well. After a thorough analysis done by Vellutino [6], he concluded that there was no evidence that the visual-spatial factors had any causal role in the genesis of evolutionary dyslexia, while he affirmed that there was strong evidence of the importance of the role of linguistic factors and in particular of the phonological ones. His work created the scientific basis for new research hypothesis.
This new interpretation from the linguistic point of view concerning problems of reading and writing and consequently the reversal of the theoretical paradigm dominating up to that time, received a fundamental support from the clinical experimental point of view [7,8], concerning also the role of genetic factors. The recognition of a possible multi-faceted matrix induced researchers to hypothesize a different organizational model of the visual and auditory cortices of dyslexic subjects [9]. The idea of a multi-faceted origin is not new; Birch [10] had postulated three different reading deficit mechanisms:
1. Difficulty in integrating auditory and visual sensory information,
2. Lack of development of sensory systems with predominance of one of the two channels (visual auditory),
3. Coherent development and processes of clear analysis and synthesis but consequent difficulty in establishing a relationship among the different codes.
First Myklebust and Johnson [11] and then Boder [12,13], hypothesized that the basic deficit in evolutionary dyslexia could pertain, from time to time, to one or to the other sensory condition, thus introducing the principle of a differentiation of the dyslexics’ profile in three different groups:
1. dyseidetic (visual)
2. dysphonetic (auditory)
3. mixed (both)
Modern neuroscience studies have highlighted how a good functional organization of the cortico-subcortical/subcortical systems requires an adequate codification of the signals that reach the cortical analyzers. In Basar’s studies it was possible to demonstrate that with the use of appropriate algorithms, the identification of the composition of frequency signals coming from the auditory and visual region was possible [14]. Actually, when cortical analyzers are reached by a signal (auditory or visual), they are activated, but the signal that passes is the one that has a frequency code between 9-10 Hz in the congruent channel and of 5-9 or 12-15 Hz in the incongruent channel [15].
Mathematical model of the Wavelet Analysis
The wavelet transform is very similar to the Fourier transform, in fact both methods decompose the signal through base functions.
But while in the Fourier transform the base is a sinusoidal function and the temporal extension infinite, in the wavelet, the base functions are closed in a finite time interval. The starting point is a function called “mother wavelet” Ф (t0,f0) and by some translactions along the time axis and compression/ expansion along the frequency axis a series of functions will be generated that will be the basis of wavelet transform.
In a more simplistic way, we can say that wavelet analysis measures the similarity of the signal in the border (t0,f0 ) ,with the “mother wavelet” in (t0,f0 ).
As Wigner Ville, the wavelet transform does not need the stationarity hypothesis, furthermore, the time-frequency isn't fixed but can change when the frequency changes (at low frequency = good frequency resolution and bad time resolution; At high frequency = bad frequency resolution and good time resolution). This aspect is very useful for EEG signals, where all the frequencies are high and short in time, so we can catch the short “burst” of signals.
About the computational view, the wavelet transform can be implemented with a computational complexity equal to O(n) (n = points of the signal) against O(nlog(n)) of the STFT. In this paper, we used a less efficient algorithm, but it offered a better richness of information, the function chosen is “MORLET WAVELET” so defined
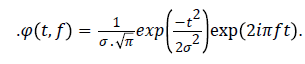
Where
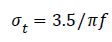
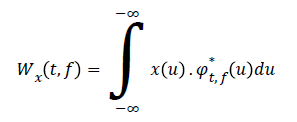
The coefficients of the wavelet transform related a definite frequency is calculated through a convolution of the signal with Ф (t, f). Furthermore, instead of performing the convolution on temporal domain we chose to utilize the products of the Fourier transform and antitransformed the results

Where s (f) and Ф (t, f) are respectively the transform of the signal and the wavelet function, T-1 is the antitransform this result is a graphic where we have:
Time axis (X); Frequencies axis (Y); Power axis (Z)
Objective of the Study
The purpose of our study was to verify this hypothesis: subjects affected by dyslexia show a dysfunctional frequency composition compared to normal subjects. To obtain this information we used auditory and visual evoked potentials, analyzing the signals obtained with the WAVELET method. Another measurement we used is the visual N400.
Materials and Methods
For this study, 13 children affected by dyslexia (6 M, 7 F) between the age of 10-14, and 13 non-dyslexic children between the age of 10-14 y (7 M, 6 F) were enrolled (Table 1).
| Demographic data |
| Control group (N=13) |
7 Male |
Mean age |
13 y |
| 6 Female |
Education |
7 y |
| WISC=127 |
| Dyslexia (N=13) |
8 Male |
Mean age |
14 y |
| 5 Female |
Education |
8 y |
| WISC=94 |
Table 1: Demographic characteristics of groups, dyslexic and non-dyslexic kids are listed.
All of the dyslexic kids have been evaluated with the following test:
WISC (Wechsler Intelligence Scale for Children).
The non-dyslexic kids were not evaluated with WISC since they showed good school performance and reading abilities.
All youngsters in both groups underwent registration of the auditory, visual and N400 visual evoked potentials.
Registration took place as follows:
1. The subject sat in front of a stimulating video screen 45 cm away.
2. The subject was applied a cabled cap on the head
3. A conductive paste-maintained resistance to the skin<5 kΩ,
4. At the beginning traces of EEG were registered with the 10-20 model, monitoring a phase with eyes open and one with eyes closed for a total of ten minutes
5. Auditory stimulation was carried out with a Gaussian sound with 70 ms ascending and 70 ms descending. ISI=400 ms; number of stimuli=100
6. Visual stimulation: the stimulus was made up of a checkerboard projected on a LCD 15 “screen at a distance of 45 cm from the subject; each stimulus lasted 50 ms with a ISI 100 ms for a total of 200 stimuli.
7. VISUAL N400: On the screen we showed 2 different sentences, very clear and in Italian language:
a. mi spalmo un panino con la nutella, frequent stimulus
b. Mi spalmo un panino con il cappotto, rare stimulus
The rare stimulus was presented 70%
The frequent stimulus was presented 30%
The paradigm used is ODDBALL
The data obtained was analysed with an average model synchronized, the result was transformed into EEG and EP traces, then T3 T4 O1 O2 were chosen. Every single trace was calculated according to latency and amplitude.
Each single trace was analysed with the Wavelet method, and each trace calculated according to potency at the point of maximum amplitude. The data obtained were inserted in an Excel sheet and transformed in graph form (Tables 2 and 3 and Figure 1).
| T3 |
Latency |
T3 |
Amplitude |
| N |
Mean |
T |
P |
N |
Mean |
T |
P |
| Control |
13 |
121 |
|
|
CONTROL |
13 |
1.41 |
|
|
| Dyslexia |
13 |
128 |
1.26 |
NS |
DYSLEXIA |
13 |
1.8 |
0.84 |
NS |
| T4 |
Latency |
T4 |
Amplitude |
| N |
Mean |
T |
P |
N |
Mean |
T |
P |
| Control |
13 |
122 |
|
|
Control |
13 |
4.46 |
|
|
| Dyslexia |
13 |
126 |
0.39 |
Ns |
Dyslexia |
13 |
3.31 |
0.59 |
Ns |
| O1 |
Latency |
O1 |
Amplitude |
| N |
Mean |
T |
P |
N |
Mean |
T |
P |
| Control |
13 |
116 |
|
|
Control |
13 |
8.23 |
|
|
| Dyslexia |
13 |
123 |
1.16 |
Ns |
Dyslexia |
13 |
9.15 |
0.5 |
|
| O2 |
Latency |
O2 |
Amplitude |
| N |
Mean |
T |
P |
N |
Mean |
T |
P |
| Control |
13 |
119 |
|
|
Control |
13 |
7.3 |
|
|
| Dyslexia |
13 |
116 |
0.98 |
Ns |
Dyslexia |
13 |
10.38 |
1'82 |
0.005 |
Table 2: Visual evoked potential.
| T3 |
Latency |
PEU T3 |
Amplitude |
| N |
MEAN |
T |
P |
N |
Mean |
T |
P |
| Normal |
12 |
128.3 |
|
|
Normal |
12 |
2.58 |
|
|
| Dyslexia |
12 |
108.5 |
1.79 |
0.005 |
Dyslexia |
12 |
3.41 |
1.28 |
NS |
| T4 |
Latency |
PEU T4 |
Amplitude |
| N |
Mean |
T |
P |
N |
Mean |
T |
P |
| Normal |
12 |
128.9 |
|
|
Normal |
12 |
2.91 |
|
|
| Dyslexia |
12 |
113.7 |
1.23 |
NS |
Dyslexia |
12 |
4 |
1.4 |
NS |
| O1 |
Latency |
PEU O1 |
Amplitude |
| N |
Mean |
T |
P |
N |
Mean |
T |
P |
| Normal |
12 |
137.7 |
|
|
Normal |
12 |
4.83 |
|
|
| Dyslexia |
12 |
107.8 |
2.89 |
0.001 |
Dyslexia |
12 |
3.83 |
0.69 |
NS |
| O2 |
Latency |
PEU O2 |
Amplitude |
| N |
Mean |
T |
P |
N |
Mean |
T |
P |
| Normal |
12 |
139.2 |
|
|
Normal |
12 |
4.83 |
|
|
| Dyslexia |
12 |
114.2 |
1.95 |
0.05 |
Dyslexia |
12 |
4.25 |
0.46 |
NS |
Table 3: Auditory evoked potential.
Figure 1: Concerning wavelet analysis of visual evoked
potentials, shows a notable difference both in the potency of
the signal and in its composition.
The ERP visual N400 was obtained in the derivation FZ CZ PZ, for each one was calculated amplitude and latency (Figure 2).
Figure 2: Concerning wavelet analysis of visual evoked
potentials, Control subjects present with a max peak at
frequency 7-9 Hz in O1 and O2 derivations, whereas
derivations T3 and T4 present with a reduced tracing.
The data collected later underwent statistical analysis with the Fisher T test at 2 tails
Results
At this point a brief introduction is important. The choice of the EEG T3 T4 O1 O2 channels is due to the need to study the frequency composition in every stimulus in the congruent and incongruent areas. We know that the auditory stimulus is analyzed from the auditory regions located in the temporal lobe corresponding to T3 T4 derivations. The same principle is applied to the visual stimulation, which is analyzed in the occipital area derivation O1 O2.
The data collected in the wavelet analysis of the VEP and AEP have been subdivided in this way:
1. Type of potential evoked
2. EEG derivation
both for dyslexic and non-dyslexic subjects.
The same have been done for the visual N400
Table 2 shows the analysis of visual evoked potentials which describes the non-statistically significant amplitude and latency parameters.
Figure 1, concerning wavelet analysis of visual evoked potentials, shows a notable difference both in the potency of the signal and in its composition. Control subjects present with a max peak at frequency 7-9 Hz in O1 and O2 derivations, whereas derivations T3 and T4 present with a reduced tracing. Subjects affected by dyslexia show dispersed and not congruent tracing with the visual signal, instead. The same is true for visual tracings; in fact, control subjects show an evoked response quite similar to the one of subjects affected by dyslexia.
This datum is not valid for wavelet analysis, from which it is evident that controls have a congruous distribution and dyslexic subjects have not (Table 3 and Figure 2). Table 4, concerning visual N400, is statistically significant for what concerns not latency but amplitude, thus confirming the presence of functional anomalies on the semantic memory.
| (FZ) |
| N400 V LATENZA |
N |
Media |
T |
P |
| Normal |
13 |
450.3 |
|
|
| Dyslexia |
13 |
442.3 |
0.49 |
NS |
| N400V AMPIEZZA |
N |
Media |
T |
P |
| Normal |
13 |
6 |
|
|
| Dyslexia |
13 |
3.53 |
2.43 |
0.001 |
| (CZ) |
| N400 V Latency |
N |
Media |
T |
P |
| Normal |
13 |
450.2 |
|
|
| DIX |
13 |
443 |
0.49 |
NS |
| N400V Amplitude |
N |
Media |
T |
P |
| Normal |
13 |
7 |
|
|
| Dyslexia |
13 |
3.69 |
3.64 |
0.001 |
| (PZ) |
| N400 V Latency |
N |
Media |
T |
P |
| Normal |
13 |
450 |
|
|
| Dyslexia |
13 |
442 |
0.498 |
NS |
| N400v Amplitude |
N |
Media |
T |
P |
| Normal |
13 |
7.769 |
|
|
| Dyslexia |
13 |
4.769 |
2.7 |
0.001 |
Table 4: Visual n400 (fz, cz and pz).
Discussion
Our data highlight the clinically relevant differences in dyslexic subjects studied. In fact, these subjects present a particular predisposition in using only one channel both from visual and auditory stimulation. Could it be possible that the dyslexic subjects have a defect in perceiving the stimulus?
This data could probably be the neuropsychological compensation of a disorder of the hierarchical development of the cortical analyzers.
This could constitute a very important factor because it concerns the possibility of setting-up a cognitive rehabilitation plan, designed in such a way to develop the perceptual deficit component of a particular subject, making the cognitive development typical of language learning be harmonic. Actually, cognitive rehabilitation plans need to “personalize” the rehabilitation model of the subject. Until now, this fact was determined by the different neuropsychological test. Today we can say that thanks to the wavelet analysis, visual and auditory evoked potentials it will be possible to integrate these two functional levels to make a more efficient and effective plan.
A particular kind of treatment is the one using the methodology of neurofeedback; thanks to all the information provided by wavelet analysis, it is possible in fact to write an adequate treatment plan. Many aspects of this method need to be developed further and we are in the process of expanding applications thanks to new algorithm which we hope will help to broaden the present model and make it more complete.
References
- Orton ST (1928) Specific reading disability-strephosymbolia. JAMA 90: 1095-1099.
- Orton ST (1925) World-blindness in school children. Arc Neurol Psych 14: 581-615.
- Hermann K (1959) Reading disability, Copenhagen, Munksgaard.
- Liberman IY, Shankweiler D, Fischer FW, Carter FW (1974) Explicit syllable and phoneme segmentation in the young child. J Exp Child Psychol 18: 201-212.
- Liberman IY, Sshankweiler D, Orlando C, Harris KS, Berti FB (1971) Letter confusion and reversals of sequence in the beginning reader: Implications for OrtonÃÆÃâÃââÃÆââ¬Å¡Ã¢ââ¬Å¡Ã¬ÃÆââ¬Å¡Ã¢ââ¬Å¾Ã¢s theory of developmental dyslexia. Cortex 7: 127-142.
- Vellutino FR (1979) Dyxlexia: theory and research, Cambridge, Mass, MIT Press.
- Catts HW (1989) Phonological processing deficits and reading disabilities. Reading disabilities: a developmental language perspective, Boston, Little-Brown.
- Kamhi AG, Catts HW (1989) Reading disabilities: a developmental language perspective, Boston, Little Brown & Co.
- Pennington BF (1990) Annotation: the genetics of dyslexia. J Child Psychol Psychiatry 31: 193-201.
- Birch H (1962) Dyslexia and maturation of visual function. Reading disability: progress and research needs in dyslexia, Baltimora, John Hopkins Press.
- Myklebust HR, Johnson DJ (1962) Dyslexia in children. Except Child 29: 14-25.
- Boder E (1973) Developmental dyslexia: a diagnostic approach based on three atypical reading-spelling pattern. Develop Med Child Neurol 15: 663-687.
- Boden C, Giaschi D (2007) M-stream deficits and reading-related visual processes in developmental dyslexia. Psychol Bull 133: 346-366.
- Basar E (1998) Brain function and oscillation, New York, Springer Verlag.
- Lim SA, Siatkowski RM (2004) Pediatric neuro-ophthalmology. Curr Opin Ophthalmol 15: 437-443.