Jafar Torfifard1*, Erfan Norian1, Ramin Ahmadi2, Mohamad Taghi Ahmadi2,3, and Razali Ismail4
1Department of Electrical Engineering, Izeh Branch, Islamic Azad University, Izeh, Iran
2Department of Physics, Faculty of Science, Urmia University, Iran
3Nano-Technology Research Center, Nano-electronic research Group, Physics Department, Urmia University, Urmia, Iran
4Department of Electronics and Computer Engineering, Faculty of Electrical Engineering, Universiti Teknologi Malaysia, 81310 UTM Johor Bahru, Johor, Malaysia
- *Corresponding Author:
- Jafar Torfifard
Department of Electrical Engineering, Izeh Branch,
Islamic Azad University, Daneshjoo,
Izeh, Khuzestan, Iran
Tel: +98614362020
Email: j173555@gmail.com
Received date: July 24, 2019; Accepted date: August 22, 2019; Published date: August 31, 2019
Citation: Torfifard J, Norian E, Ahmadi R, Ahmadi MT, Ismail R (2019) Polymer Concentration Effect on Nanofiber Growth Using Pulsed Electrospinning. Polym Sci Vol.5 No.1:1.
Keywords
Electrospinning; Nanofibers; Pulsed system; Concentration; Polystyrene
Introduction
Owing to routine necessity to materials with smaller dimensions and more capabilities, researchers have designed and developed new types of materials. Outstanding properties of nanofiber such as large surface area to the volume ratio, high porosity, flexibility and unique mechanical performance (hardness and tensile strength) [1-4] causing to introduce as ideal candidate for filtration, medical, textile, energy devices and tissue engineering, electrical and optical applications [4-10]. In recent years, various methods for production of nanofiber have been used such as drawing, self-assembly, template synthesis, phase separation and electrospinning. Among these methods, electrospinning is a favourite method, because it’s simple and cost-effective, and the only way expanded to mass production of continuous nanofibers from various polymers [4,11-14]. In electrospinning method, the electrostatic force is used to produce thin fibers (in the range of nanometers or micrometers) by using a polymer or melt solutions [15] and produced fibers have larger surface area to the volume ratio and thinner diameter than other methods [1]. Electrospinning process produces fibers based on polymers and natural materials as well as it is employed in metals, metal oxides, ceramics and composite materials [16]. Hence, the parameters affecting on the electrospinning process and morphology of the fibers are divided into the three general factors: solution properties, process factors and ambient factors as indicated in [14,15,17], respectively. Since the first requirement condition for electrospinning process is having appropriate solution, the solution properties are the most important factor [18].
Although electrospinning is a fairly recent term, the basic idea is introduced by Formhals whose purpose is to produce polymer strands. Reneker and Chun have revealed this technology and demonstrated the ability to spinning in various polymer solutions [1,14].
In this paper, a new nanofiber is produced by our novel customized pulsed method. The pulsed electrospinning distinguishes our work from the normal method based on the direct current. The pulsed system is designed and developed by our group based on the proposed circuit of high voltage [19]. According to the insulation performance of polystyrene and its simple production methods, polystyrene based fibers are focused. The possibility of electrospinning on these polymers is investigated and a production of uniform structure is observed. Additionally, an influence of electric field on its production is explored.
Experimental Setup Method
In this work, in order to product of a nanofiber, electrospinning device is designed and fabricated. Figure 1 shows a schematic design of our device. A specific high voltage device to utilize a high electric field between tip of syringe and collector is designed.
Figure 1: The design schematic of our setup.
In order to prepare of a polymer solution, the polystyrene and dimethylformamid (DMF) solvent are used as solution. After dissolution, the polystyrene and DMF solvent made the homogenous polymer solution while the solution is infused in electrospinning syringe.
By applying energy on syringe pump, the solution is pumped with specific flow rate to create the droplet on syringe tip. By applying an electrical voltage on the needle to set up the transported electrical current to the droplet, the droplet surface is covered by homonymous electrical load till repulse each other. These produced homonymous load and electrostatic force create the cone with overcoming on drop surface tension force termed Taylor cone. The Taylor cone is created on the top of needle [20]. As a result, the charge density is increased at the cone surface by optimizing the voltage, which forms an electric field between needle and collector. This also makes the polymer solution to launch the collector. Hence, the nanofibers sit on the collector.
General Model
The electrospinning process is a physical problem associated with fluid dynamics and electro-hydrodynamics, which involves the transport of charge and mass through jet to producing nanofiber. The process consists of the three steps including the jet initiation, jet thinning and Jet solidification [14,21]. It is should be noted that this model is used for all electrospinning process as shall be shown in this study.
Jet initiation
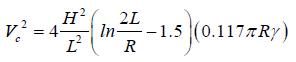
By applying a high electrical voltage, an electrical current is flawed through to the polymer droplets and then electrical charge would be introduced in the polymer solution so that the same charges repulse each other, which creates an electrostatic field. The initiated electrostatic field can be overcome to the surface tension of the polymer solution when its value reaches a certain amount called the critical value (Vc). In this condition, the charge density increases at the tip of the droplet. The droplet under an electric field creates a cone with an angle of 49.3 named Taylor cone. Furthermore, Taylor showed that the Vc is given by eqn. (1).
 (1)
(1)
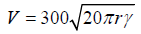
Where H is the air gap distance (the distance between the tip of needle and the collector), L is the length of the capillary tube, R is the radius of the tube, γ is surface tension of the fluid. The Unit of H, L, and R is cm while γ is dyn per cm. The minimum critical voltage of droplet of electrospinning process in the air is similar to the electrostatic spraying of liquid process given by eqn. (2).
 (2)
(2)
where r is the jet radius.
Jet thinning
When charges jet is pulled out from the tip of the Taylor cone, the jet moves approximately through a straight path and becomes thin under some conditions such as flow rate, concentration, field strength and jet velocity. For example, if the flow rate is fast, the radius of the jet decreases. To represent an element of electric jet volume, we assume a simple cylinder. The eqn. (3) shows the ratio of surface area to volume is inversely proportional to the jet radius.
 (3)
(3)
Where A is the surface area of the cylindrical volume element, V is the volume, and R is the radius of the jet. The eqn. (3) shows increase in the jet radius decreases the surface area associated with the volume element.
The eqn. (4) shows the acceleration is proportional to the ratio of charge to mass.
 (4)
(4)
Where a is acceleration, E is the electric field, q is the available charge for the given volume element, and m is the mass of a given volume element. If the polymer solution and surface charge densities are assumed to be constant, then the charge to mass ratio would be decreased by increasing the jet radius as indicated in eqn. (4).
As a result, it can be said that the increase in the jet radius alleviates the fluid acceleration. At this stage, the jet is under effect of some instabilities. By investigating of electrospinning polyethylene oxide jet, the three types of instability are known. The first is the classical axisymmetric Rayleigh instability. The second is the axisymmetric instability based on the conductive jet, and the third is the bending or whipping instability which is non-axisymmetric instability. Controlling these instabilities can help to achieve the successful nanofiber formation.
Jet solidification
When the jet is solidification, a dry nanofiber is formed on the collector. The solidification rate depends on the electrostatic field, polymer concentration, and the distance between tip and collector.
Experimental Results and Discussions
There are several experiments carried out on this work. The nanofiber production parameters affect the electrospinning process. We have investigated the two important parameters effect of concentration and voltage, which are depended on the collector rotation on the morphology of nanofibers produced by electrospinning. These experiments were carried out in two steps described as follows.
First stage
The effect of concentration on the morphology of polystyrene nanofibers produced by electrospinning is explored. Polystyrene and dimethylformamide (DMF) are combined to make the solution used to split the expandable polystyrene into identical pieces. Then, the solution is combined with the DMF solvent that is inside the test tube and placed it for 10 Min at room temperature. After the dissolution, a uniform polymer solution was obtained shown in Figure 2. The solution is then poured into the syringe of an electrical device. By forcing to the pump of syringe, the solution is pumped into the specific discharge to form the needle diameter. Before applying the voltage, the droplet falls from the tip of the needle to the lowest place. The positive pulse voltage of the power supply is connected to the tip of the needle while the negative voltage is linked to the collector to realize a potential difference between the tip of the needle and the collector. Then, by applying the voltage to the needle in the setup, the electric current is transmitted to the droplet. This will cause the droplet level to be absorbed by the same name in order to repel each other. The electrostatic field produced by overcoming the tensile force of the droplet and its elongation lead to form a cone called the Taylor cone located at the tip of the needle. Then, by applying the optimal value of voltage, the loads density at the tip of the cone would be increased while between the needle and the collector an electric field is formed. This causes to throw the polymer solution into the collector and drains the electrical loads. As a result, the nanofibers sit on the collector. This test was carried out at a constant voltage of 10 kV for the three different concentrations of 1.97%, 6.86% and 16.94% by weight according to the procedure described earlier. After sampling, the specimens are placed at room temperature for 30 minutes to dry. then, we used a digital microscope QM9 to examine the morphology of the electrolytic fibers with concentrations of 1.97%, 6.86% and 16.94% by weight are displayed as shown in Figure 3. Assuming that the applied voltage is constant, Figure 3a and 3b illustrate that the increase in polymer concentration enlarges the thickness. There is some unevenness in the samples surfaces, which create some gaps in the fiber surface. Owing to the weakness of the electric field in these regions, the fibers cannot be formed. Since the concentration has influence on the viscosity and surface tension, increase in concentration extends the polymer mass in spinning jet while increase in viscosity enlarges the polymer chains connection as seen in Figure 3c.
Figure 2: The obtained polymer solution.
Figure 3: The produced nanofibers with different concentrations of a) 1.97%, b) 6.86% and c) 16.94% by weight.
Second stage
The effect of collector rotation on the morphology of polystyrene fibers produced by electrospinning is considered. The applied voltage is one of the most important machine parameters on the electrospinning process, which is proportional to the collector circle that shall be measured in this step. The whole process of this experiment is similar to the first stage investigate, and we have changed the voltages corresponding to the collector round to obtain each sample, which was performed the tests for the three various voltages of 10 V, 12 V and 14 V with the concentration of 6.86% by weight. Additionally, the scanning SEM and FTIR samples were taken to get the more accurate insight the work done. It should be noted that the morphology of polystyrene fibers should be carefully studied. The preparation of a viscosity-soluble solution determined by experiment is the first major parameter required to be considered. If the viscosity is low, the polymer is discharged into the droplet. Due to the inability of the surface tension of polymer solution, the jet charge is to overcome the gravity of the earth. Due to increase in surface tension, the viscosity would be high and hence the polymer solution is accumulated on the collector plate. By testing, the optimum viscosity should be achieved, in which a smooth and seedless fiber is formed in the collector [15] and other parameters have to be checked.
Process Characterization
In the second stage, the samples are characterized by using SEM and FTIR spectroscopy.
The SEM is an analysis technique for investigation of the structure and morphology. Figures 4-6 show the SEM images of samples, which are relied on the collector length for the three different voltages of 10 V, 12 V and 14 V, respectively. The electro-spreads instead of electrospinning can be found through the scanning electron microscope images while the fiber is poorly formed as shown in Figures 5 and 6, respectively. In Figure 7, what is more to be seen is the seeds. Since the polystyrene is electrically bonded, increasing the volume and number of grains in the fiber layer is suitable for improving the efficiency of the filters, there is no attempt to remove the seeds. Therefore, the nanofiber structure with uniform grains is accepted for the filtration process, and more research is done to remove the seeds. The produced nanofibers are shown in Figure 6. Figure 6a and 6b are magnified by 1000X and 5000X, respectively. These results show the validity of the study. The next technique used to study structures in nanotechnology is the FTIR spectroscopy. This method is usually a gradual approach used to study the functional groups on the surface of the samples. The synthesized samples are exposed to infrared radiation. In the obtained spectra, absorption and emission (reflected) infrared rays are visible from the samples. It can usually be said that the infrared spectrum of the two molecules is not similar to each other. The FTIR samples spectroscopy, which are leaned upon the collector rotation for the three different voltages of 10 V, 12 V and 14 V are indicated in Figures 7-9, respectively. From Chemical theory, polystyrene is a long chain of hydrocarbons in which carbon-based centers are linked to phenyl groups (carbon-bound gasoline) which the chemical formula is (C8H8) n containing carbon-hydrogen and hydrogen elements. By applying the different voltages to the polymer at the same time, the only one that was removed is a peak of (3400-3600) cm-1, which is related to the tensile of OH. The only reason to remove this peak is to apply a voltage of 14 V based on the collector rotation. This creates heated and causes rapid evaporation of the solvent, while in other voltages there is not enough time to evaporate. Ideally, all solvent residues must be removed at the moment when the fibers reach the collector. Otherwise, if the solvent volatility is low, the fibers may penetrate to each other as they soak together during the collection of fibers on the collector and forming a grid instead of separate fibers. Some studies have shown that electrospinning lattices may have higher mechanical properties than separate nanofibers and fibers obtained from this method [20]. There is no change in the rest of the peak. It should be noted that since the velocity of the collector rotation is very important for nanofibers morphology and should be based on the fiber production to maintain the fiber cohesion [22-24], then the expression of eqn. (5) can be introduced.
ω ∝ R (5)
Figure 4: The SEM image obtained from the loop layer at a voltage of 10 V depended on the collector rotation.
Figure 5: The image obtained from the loop layer at a voltage of 12 V depended on the collector rotation.
Figure 6: The SEM images achieved from the electrified laminate layer at a voltage of 14 V depended on the collector rotation, a) magnified by1000X b) magnified by 5000X.
Figure 7: The samples FTIR spectrum at 10 V.
Figure 8: The samples FTIR spectrum at 12 V.
Figure 9: The samples FTIR spectrum at 14 V.
Where ω is the voltage based on the collector rotation and R is nanofiber average radius. Indeed, the eqn. (5) is the proposed model based on the experimental observation. Due to verification of this matter, experimental data are plotted in Figure 10 showing the voltage is proportional to the collector rotation, which is a function of the nanofiber average radius and general trend of curve conforms to proposed model of eqn. (5).
Figure 10: The voltage depended on the collector rotation as a function of nanofiber radius.
Generally, at the second stage, by increasing the applied voltage, the fiber thickness is reduced while the porosity on the sample surface is increased. Due to increasing the porosity, the nanofiber can be used as a basis for insulation and filtration applications. In order to comparison of our work with other researches, it can be said that Jarusuwannapoom et.al in 2005 explored the effect of eighteen solvents including the DMF on an electro-spinnability of polystyrene solutions [25]. They found the three different concentrations of 10 %, 20% and 30%) with the three different applied DC voltages of 15 KV, 20 KV and 25 KV, respectively. They used the normal electrospinning method for nanofibers growth while the nanofibers are grown by pulsed electrospinning in our research. In our work, the nanofibers are grown only by 10 KV applied voltage while in same research of Jarusuwannapoom et al. used DC 15 KV, 20 KV and 25 KV for growth, which consumes a lot of energy compared with the proposed model for growing the nanofibers. That is benefit and specific property of pulsed system on production of nano-fiber. According to Jarusuwannapoom et.al investigation, for example at 10% concentration and by applying 20 KV voltage, the obtained fibers were fused to adjacent fibers [25]. As a result, the optimized voltage is 20 KV, which means that twice amount of applied voltage in our work.
It should be noted that the concentration of previous study [25] and our work are different.
Conclusion
This research is based on a different approach that can be used to produce nanofibers efficiently and easily. In this research, nanofibers are produced by fabricated electrospinning device in which pulsed system used in our work is distinct with other normal systems. This research is done by means of two steps. In the first step, the effect of concentration on the morphology of polystyrene nanofibers is explored through the constant voltage of 10 kV for the three different concentrations of 1.97%, 6.86% and 16.94% by weight of polystyrene. From this step, it can be concluded that the increase in the polymer concentration increases the thickness through constant voltage of pulsed system used in this work. In the second step, the effect of collector rotation on the morphology of polystyrene nanofibers with the constant concentration of 6.86% by weight for the three different applied voltages of 10 V, 12 V and 14 V is investigated. The results show increasing the applied voltage alleviates the fiber thickness while enlarges the porosity on the sample surface. Moreover, the produced nanofibers are characterized by the SEM and FTIR. The proposed model is examined by the experimental data showing good correlation and low power dissipation with respect to other works in the literature.
References
- Frenot A, Chronakis IS (2003) Polymer nanofibers assembled by electrospinning. Curr. Opin. Colloid Interface Sci 8: 64-75.
- Zargham S, Bazgir S, Tavakoli A, Rashidi AS, Damerchely R (2012) The Effect of Flow Rate on Morphology and Deposition Area of Electrospun Nylon 6 Nanofiber. J Eng Fibers Fabr 7: 42-49.
- Oktay B, Kayaman-Apohan N, Erdem-Kuruca S (2014) Fabrication of nanofiber mats from electrospinning of functionalized polymers. IOP Conf Ser: Mater Sci Eng 64: 012011
- Lu Y, Li Y, Zhang S, Xu G, Fu K, et al. (2013) Parameter study and characterization for polyacrylonitrile nanofibers fabricated via centrifugal spinning process. Eur Polym J 49: 3834-3845.
- Shenoy SL, Bates WD, Frisch HL, Wnek GE (2005) Role of chain entanglements on fiber formation during electrospinning of polymer solutions: good solvent, non-specific polymer–polymer interaction limit. Polym 46: 3372-3384.
- Khan WS, Asmatulu R, Ceylan M, Jabbarnia A (2013) Recent progress on conventional and non-conventional electrospinning processes. Fibers Polym 14: 1235-1247.
- Shi X, Zhou W, Ma D, Ma Q, Bridges D, et al. (2015) Electrospinning of nanofibers and their applications for energy devices. J Nanomater 16: 122.
- Katta P, Alessandro M, Ramsier RD, Chase GG (2004) Continuous electrospinning of aligned polymer nanofibers onto a wire drum collector. Nano Lett 4: 2215-2218.
- Kriegel C, Kit KM, McClements DJ, Weiss J (2009) Electrospinning of chitosan–poly (ethylene oxide) blend nanofibers in the presence of micellar surfactant solutions. Polym 50: 189-200.
- Meinel AJ, Germershaus O, Luhmann T, Merkle HP, Meinel L (2012) Electrospun matrices for localized drug delivery: current technologies and selected biomedical applications. Eur J Pharm Biopharm 81: 1-13.
- Nayak R, Padhye R, Kyratzis IL, Truong YB, Arnold L (2012) Recent advances in nanofibre fabrication techniques. Text Res J 82: 129-147.
- Yang Y, Leong KW (2010) Nanoscale surfacing for regenerative medicine. Wiley Interdisciplinary Rev: Nanomed Nanobiotechnol 2: 478-495.
- Jayaraman K, Kotaki M, Zhang Y, Mo X, Ramakrishna S (2004) Recent advances in polymer nanofibers. J Nanosci Nanotechnol 4: 52-65.
- Huang ZM, Zhang YZ, Kotaki M, Ramakrishna S (2003) A review on polymer nanofibers by electrospinning and their applications in nanocomposites. Compos. Sci. Technol. 63: 2223-2253.
- Bhardwaj N, Kundu SC (2010) Electrospinning: a fascinating fiber fabrication technique. Biotechnol. Adv. 28: 325-347.
- Yang Y, Jia Z, Liu J, Li Q, Hou L, et al. (2008) Effect of electric field distribution uniformity on electrospinning. J Appl Phys 103: 104307.
- Rogina A (2014) Electrospinning process: Versatile preparation method for biodegradable and natural polymers and biocomposite systems applied in tissue engineering and drug delivery. Appl Surf Sci 296: 221-230.
- MitÃÆÃâÃââÃÆââ¬Å¡Ã¢ââ¬Å¡Ã¬ÃÆââ¬Å¡ÃâÃÂuppatham C, Nithitanakul M, Supaphol P (2004) Ultrafine electrospun polyamideÃÆÃâÃââÃÆââ¬Å¡Ã¢ââ¬Å¡Ã¬ÃÆââ¬Å¡ÃâÃÂ6 fibers: effect of solution conditions on morphology and average fiber diameter. Macromol Macromol Chem Phys 205: 2327-2338.
- Ahmadi R, Ahmadi MT, Ismail R (2018) Carbon Nano-particle Synthesized by Pulsed Arc Discharge Method as a Light Emitting Device. J Electron Mater 47: 4003-4009.
- Andrady AL (2008) Science and technology of polymer nanofibers. John Wiley and Sons, New Jersey.
- Garg K, Bowlin GL (2011) Electrospinning jets and nanofibrous structures. Biomicrofluidics 5: 013403.
- Murugan R, Ramakrishna S (2007) Design strategies of tissue engineering scaffolds with controlled fiber orientation. Tissue Eng 13: 1845-1866.
- San Choi J, Lee SJ, Christ GJ, Atala A, Yoo JJ (2008) The influence of electrospun aligned poly (ÃÆÃââââ¬Ã°ÃÆââ¬Å¡Ã¢ââ¬Ãº-caprolactone)/collagen nanofiber meshes on the formation of self-aligned skeletal muscle myotubes. Biomaterials 29: 2899-2906.
- Xu CY, Inai R, Kotaki M, Ramakrishna S (2004) Aligned biodegradable nanofibrous structure: a potential scaffold for blood vessel engineering. Biomaterials 25: 877-886.
- Jarusuwannapoom T, Hongrojjanawiwat W, Jitjaicham S, Wannatong L, Nithitanakul M, et al. (2005) Effect of solvents on electro-spinnability of polystyrene solutions and morphological appearance of resulting electrospun polystyrene fibers. Eur Polym J 41: 409-421.