Keywords
Octocrylene; Nonylphenoxyacetic acid; Pearl River Estuary; Huangpu River; East China Sea; South China Sea; Aquatic pollution
Introduction
The world population now exceeds 7 billion people and over 54.9% of the population live in urban areas [1]. Urbanization can be observed worldwide for past-centuries. At present, urbanization can be seen in the emergence of megacities (population: >10 million people) with 8.4% of the world population already living in megacities. Since the 1980s until today China has experienced a population migration from rural to urban areas and approximately 54% (2014) of China’s population now live in urban areas [2]. The megacities Shanghai (population: 23.4 million) and Guangzhou (population: 19 million) ranked 7th and 13th place in the list of largest cities in the world in 2016 [1]. Urbanization can be seen by typical foot-prints such as lights at night, from airplane or space. It also leaves its marks in the environment around it e.g. higher waste production and pollution of air and water. With the growth of the population not only did the urbanization increase but also the request and usage of personal care products (PCPs) and household chemicals increased. PCPs include a wide range of products such as lotions, creams, soaps, cologne and toiletries [3]. There are two major pathways for PCPs to enter the aquatic environment: Either they enter the aquatic environment by an indirect input (e.g. showering, cleaning, washing machine etc.) via the waste water due to an incomplete removal or as is the case for sunscreen, directly via recreational activities. PCPs are counted as ubiquitous contaminants and are defined as ‘pseudo’- persistent due to their inefficient removal from waste water and constant input into the environment [4,5]. Their occurrence in the environment is of growing scientific concern, as many of them have endocrine disrupting properties and effects on organisms [6]. One of the investigated compounds is the organic UV-filter octocrylene (OC), which is mainly used in sunscreen products to protect the skin from UV-radiation. In China the total usage of OC was estimated to be 206 t per year, with a total emission of 116 t per year. OC is mostly used in skin care products (63%), which include 80 t sunscreen products and 47 t daily face care products [7]. Additionally, it is also used as a stabilizer for other UV-filters in formulas or in plastics. It is photostable, non-degradable and a lipophilic neutral compound, due to its high logKOW (6.9) [7]. It can be adsorbed to particles or sediments and its neutral form is mostly transported from water to sediment. Most studies about OC have focused on the sediment phase and on biota, as approximately 91% of the discharged OC can be found in freshwater sediment and only 4% in marine sediment [7]. In recent years, studies reported that OC is bio-accumulative and was not only found in mussels (M. galloprovincialis, M. edulis), fish, shrimp and squids but also in higher trophic levels such as dolphins and in human breast milk, which suggest that it can possibly be bio-magnified in the food-web [3,8-14]. Blüthgen et al. and Zhang et al. were able to prove that OC is affecting the endocrine system of zebrafish (D. rerio) and androgenic, antiandrogenic and anti-estrogenic activities were observed [6,15]. Furthermore, Campos et al. recently published that OC impairs the growth of C. riparius larvae and it reduces the weight of imagoes and delays their emergence [16]. Additionally, toxicity against P. lividus embryogenesis and the early larval growth has been reported [17]. The other investigated compound is nonylphenoxyacetic acid (NP1EC). It is an intermediate which is formed e.g. by the aerobic degradation of the non-ionic surfactant nonylphenol polyethoxylate, which is mostly used as an industrial laundry detergent [18,19]. Only few studies have been conducted about NP1EC so far and not much is known about it. However, NP1EC is known to have endocrine activities and it is listed in category 2 of the European endocrine disruptor priority list for wild life and human health [20]. In difference to its degradation product nonylphenol, it can mostly be found in the water phase as its logKOW-value is 2.2 [21]. Around the world studies have focused on the occurrence of PCPs and endocrine disrupting chemicals in influents and effluents of waste water treatment plants, in lakes and rivers and also soils and sediments [22-26]. However, only few studies so far have put a focus on the marine environment and the transport of PCPs along salinity gradients [27]. This study is focused on the occurrence of the two endocrine disruption chemicals OC and NP1EC in two Chinese rivers (Huangpu River, Pearl River), which are influenced by the megacities Shanghai and Guangzhou, respectively. Furthermore, their transport into the open marine environment of East and South China Sea was under investigation.
Materials and Methods
Chemicals
All chemicals and reference standards were of analytical grade (>98%). Reference standards of octocrylene and nonylphenoxyacetic acid were purchased from Dr. Ehrenstorfer GmbH (Germany). The internal standard benzophenone-3-d5 (BP-3-d5) was obtained from CDN Isotopes (Canada). Solvents used in China (acetone, methanol and hydrochloric acid (HCl)) were contributed by Guangzhou Marine Geological Survey and Shanghai Jiao Tong University. Acetone and methanol used in Germany were purchased from Promochem (Germany). Water (LC-grade) was acquired from VWR (Germany) and acetic acid and formic acid were purchased from Sigma-Aldrich (Germany).
Sampling areas and sampling strategy
The Huangpu River (HP) is the largest river (114 km) flowing northeast through Shanghai. It is originating in Tai Lake and discharges north of Shanghai into the Changjiang River (discharge volume: 10 billion m3/a). Industry and residential areas dominate the lower river (83 km) [28,29]. Samples from Huangpu River (n=10) were collected in July 2016 stream upwards from Minhang district (HP-1) towards the Changjiang River (HP-10). From the Huangpu River 2 L surface water (0.5 m) samples were taken, from the river bank with a pre-cleaned metal bucket. The samples were filled in 2 L pre-cleaned amber bottles, kept cold (4°C) and in the dark for the transport to the laboratory (Shanghai Jiao Tong University), where the solid-phase extraction was carried out within 48 h (Figure 1a) (Table S1).
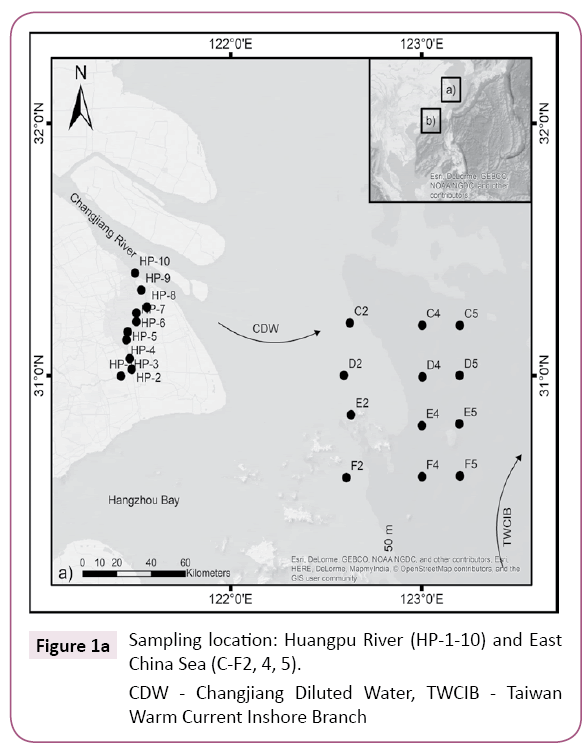
Figure 1a: Sampling location: Huangpu River (HP-1-10) and East China Sea (C-F2, 4, 5).
CDW - Changjiang Diluted Water, TWCIB - Taiwan Warm Current Inshore Branch
The East China Sea is the largest marginal sea in the north western Pacific Ocean. It is dominantly influenced by the Changjiang River discharge and slightly by the Hangzhou Bay [30]. The East China Sea receives freshwater from the Changjiang Estuary which forms a strong plume of Changjiang Diluted Water (CDW) on the shelf. It is also influenced by the inshore branch of the Taiwan Warm Water Current (TWCIB) flowing north east during the south west monsoon season. The Changjiang Estuary and the East China Sea shelf are defined by a eutrophic, low-salinity, inshore (CDW, coastal current) current system in the summer. The CDW (S<34) is dominating the upper water column [31]. During a cruise with research vessel ZheHai Ke 1 (Zhejiang Ocean University) in July 2016 discrete surface and bottom (n=12, both) water samples were taken in the East China Sea using a go-flow bottles. At each station conductivity, temperature and pressure were measured with CTD-sensors from Sea Bird Scientific (Bellevue, WA, USA). All samples were collected in 1 L pre-cleaned amber bottles and the extraction was carried out on the ship (Figure 1a) (Table S1).
The Pearl River (PR) is approximately 120 km long and is the largest water system discharging (336 billion m3/a) into the South China Sea (SCS) [32,33]. It is heavily influenced by the waste waters from industrial and domestic activities but also from intensive agriculture and aquaculture. One of the characteristics is its semi-diurnal tidal cycle [34]. Discrete surface (n=12) and bottom (n=9) water samples were taken from the Pearl River in August 2016 with the research vessel Haiyang 4 (Guangzhou Marine Geological Survey, GMGS) using a go-flow bottle. Samples at station PR-7-9 and PR-11 were taken directly from the surface. Samples were taken from upstream (Dong Jiang River) towards the South China Sea. The conductivity, temperature and pressure were measured at station PR-1-6, PR-10 and PR-12 with a CTDsystem (Sea Bird Scientific, Bellevue, WA, USA). The samples were stored in 2 L pre-cleaned amber bottles and kept in the dark at 4°C until extraction in the GMGS-laboratory within 48 h (Figure 1b).
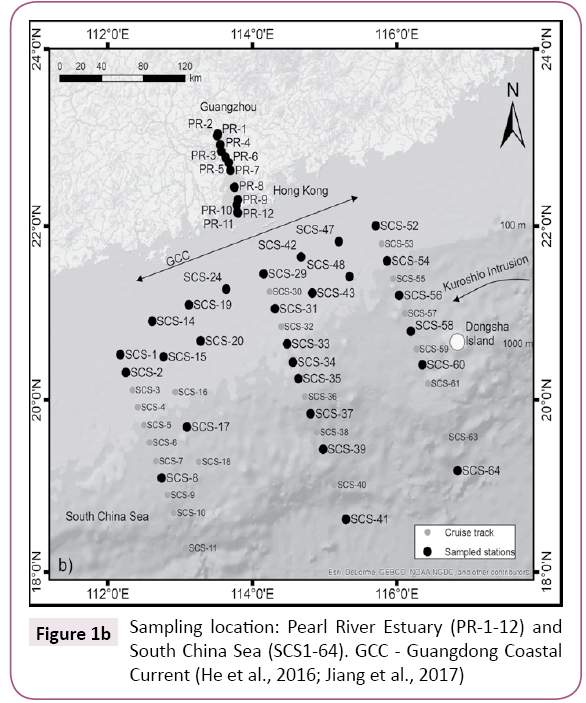
Figure 1b: Sampling location: Pearl River Estuary (PR-1-12) and South China Sea (SCS1-64). GCC - Guangdong Coastal Current (He et al., 2016; Jiang et al., 2017)
The South China Sea with a total area of approximately 3.5x10⁶ km2 is the largest semi-enclosed sea in the western tropical Pacific Ocean. The Pearl River Estuary is located midway along the northern boundary of the South China Sea between the Taiwan Shoal and Hainan Island. The coast has ENE-WSW orientation and is connected to a shelf of 150-250 km width [35]. The Pearl River Delta is one of its largest contributor with a drainage area of 453,690 km2 covering most of south China and Vietnam [36]. The estuary freshwater forms a buoyant plume over the shelf and the winter surface circulation is cyclonic in the South China Sea. During the winter season the north easterly monsoon transports the freshwater plume southwestwards along the coast line [34]. The surface water (n=29) of South China Sea was sampled in March 2015 with the research vessel Haiyang 4. Discrete water samples were taken with go-flow bottles and conductivity, temperature and pressure were measured with the CTD-system (Sea Bird Scientific, Bellevue, WA, USA). All samples were collected in 1 L pre-cleaned amber bottles and extracted on board. (Figure 1b) (Table S1).
The extracted samples were kept in the dark at -20°C and further analyzed in Germany. For the South China Sea, samples for the following parameters were taken during the cruise and measured in Germany: Particulate organic carbon (POC), dissolved organic carbon (DOC), suspended particulate matter (SPM) and chlorophyll a (Chl a). Data of POC and Chl a for the East China Sea was obtained from satellite imagery provided by NASA, in order to estimate transport processes in the particulate phase (Table S2) [37].
SPE and LC-MS/MS
The solid phase extraction (SPE) and chromatography analysis have been published by Fisch et al. and Orlikowska et al. [25,38]. The 2 L of sampled water were divided into 1 L amber glass bottles and spiked with 20 ng/L internal standard (BP-3-d5). 1 L of sampled water was extracted and enriched via SPE. Prior to the SPE the pH was adjusted to pH=2 with 5M HCl. Chromabond® EASY (3 mL, 200 mg, Marchery-Nagel GmbH) cartridges were cleaned and preconditioned with 4 mL acetone and 4 mL LCwater. The samples were brought onto the column via a filtration unit equipped with glass-fiber filters (GF/F, 0.7 μm, Whatman), to remove SPM and POC from the water phase. After extraction, the cartridges were cleaned with 4 mL water (pH=2) and gently dried under vacuum. The columns were wrapped in aluminum foil and stored in the dark at -20°C and further analyzed in Germany. In Germany the columns were eluted with 4 mL acetone/methanol (1/1, v/v) and 6 mL methanol/13% NH3 (aq) (97/3, v/v). The eluate was evaporated to complete dryness in a water bath at 40°C in a Turbo-Vap (LV, Zymark, USA) evaporator. The samples were reconstituted in 1 mL methanol/water (1/1, v/v).
The 1 mL samples were analyzed with liquid chromatography equipped with a heated electrospray ionization source and tandem mass spectrometer (LC-MS/MS) from Thermo Fischer Scientific (Germany). The chromatographic separation was achieved with a reverse-phase Kinetex C-18 column (2.6 μm, 50 x 2.1 mL, 100 Å, Phenomenex, USA), running a gradient program (mobile phase A: water + 0.1% acetic acid, mobile phase B: methanol + 0.1% formic acid, flow rate: 250 μL/min). A sample volume of 10 μL was injected and each sample was measured in triplicate. The temperatures (capillary, vaporizer) were set to 300°C. The measurement was carried out in selected reaction mode (SRM). For each compound two distinctive transitions of the precursor molecular ion/product ion were scanned. The ionization was achieved in positive and negative mode. For quality control the transition of two characteristic precursor molecular ion/product ion transitions were monitored in SRM. Quantification and qualification were conducted on the first and second most abundant transitions, respectively. Both were based on the signal-to-noise ratio and the area ratio of sample to internal standard. Further information can be found in Orlikowska et al. [38].
Calculation of attenuation coefficient and risk quotient
For interpretation of the behavior of OC and NP1EC in the Huangpu and Pearl River the attenuation coefficient (k) was calculated according to Luo et al. and Zhang et al., assuming a first order attenuation [39,40]. Adsorption, dilution and bio-degradation are often described as factors affecting the attenuation. Additionally, it needs to be considered that currents (direction and strength) may vary within/along the river and that diffused sources are more dominant than point sources.
In addition to the attenuation, a risk quotient (RQ) was calculated to determine the potential risk of the compounds to the environment. RQ is the quotient of measured environmental concentration (MEC) over predicted no-effect concentration (PNEC). It was calculated for all analyzed Chinese water systems. The RQ is classified in three levels: RQ < 0.1 low risk, 0.1 ≤ RQ ≤ 1 medium risk, 1 ≤ RQ high risk [41].
Results and Discussion
During the summer 2016 a total of 34 samples of surface and bottom water were collected from Huangpu River, East China Sea and Pearl River. One year prior, 29 surface water samples were taken in South China Sea. Both OC and NP1EC were detected in Huangpu River, Pearl River and East China Sea and only OC in the South China Sea (Table 1).
| Compound |
LOD |
Huangpu River (n=10) |
Pearl River (n=10) |
East China Sea (n=12) |
South China Sea (n=29) |
| |
|
freq. |
mean |
max. |
freq. |
mean |
max. |
freq. |
mean |
max. |
freq. |
mean |
max. |
| |
[ng/L] |
[%] |
[ng/L] |
[ng/L] |
[%] |
[ng/L] |
[ng/L] |
[%] |
[ng/L] |
[ng/L] |
[%] |
[ng/L] |
[ng/L] |
| OC |
1.7 |
100 |
18.1 ± 3.8 |
23.2 |
100 |
3.9 ± 2.1 |
9.8 |
33.3 |
3.6 ± 8.7 |
30.1 |
76 |
4.4 ± 4.0 |
17.8 |
| NP1EC |
1.0 |
100 |
463.9 ± 146.0 |
658.3 |
100 |
226.9 ± 133.9 |
396.1 |
100 |
10.7 ± 3.2 |
18.2 |
0 |
n.d. |
n.d. |
LOD - limit of detection, freq. - frequency of detection, mean - mean value of samples above LOD, max - maximum concentration, ± - standard deviation
Table 1: Measured surface concentrations of octocrylene (OC) and nonylphenoxyacetic acid (NP1EC) in Huangpu River, Pearl River, East and South China Sea.
Occurrence and distribution of OC in aquatic environment
OC was detected at every station in Huangpu River with a concentration range of 11.9 ± 1.2 - 23.2 ± 2.3 ng/L. The concentration along the river does not vary much and no significant point sources were detected. The attenuation coefficient of k=0.004 indicates that the dilution of OC is insignificant. The measured concentrations of OC have been correlated with the population density in the area (10 km radius) surrounding the sampling stations as suggested by Wu et al. [42]. There is a slight positive correlation between the population density and the occurrence of OC in the Huangpu River (r=0.2, p=0.5). It can be considered that the consumption in densely populated areas could be of importance. Wu et al. were able to see an increase in UV-filters (benzophenone) from suburban to urban areas and also towards the Changjiang River [42]. The latter increase was explained by the many cosmetic factories and waste water treatment plants (WWTPs) along the Suzhou River and Yunazo Brook, which drain into the Huangpu River near Changjiang River. The same increase could not be confirmed for OC. The connectivity rate of WWTPs in Shanghai is estimated to be around 81%, which exposes the Huangpu River to 419 million m3 of untreated waste water, pointing towards waste water being a source of OC in the Huangpu River [7,29]. Even though OC is expected to be adsorbed by soil and sediment, due to its lipophilicity (logKOW=6.9) and tendency to bio-accumulate, it can be transported in water as it is highly stable in the environment [4,7,43]. In Shanghai OC has only been detected in indoor dusts by Ao et al. [44]. The median concentration of OC added up to 1170.4 ng/g, which was 5-10 times higher than the other analyzed UV-filters. This result point towards a high consumption rate of OC and explains its presence in the Huangpu River (Figure 2) (Table 1 and S1).
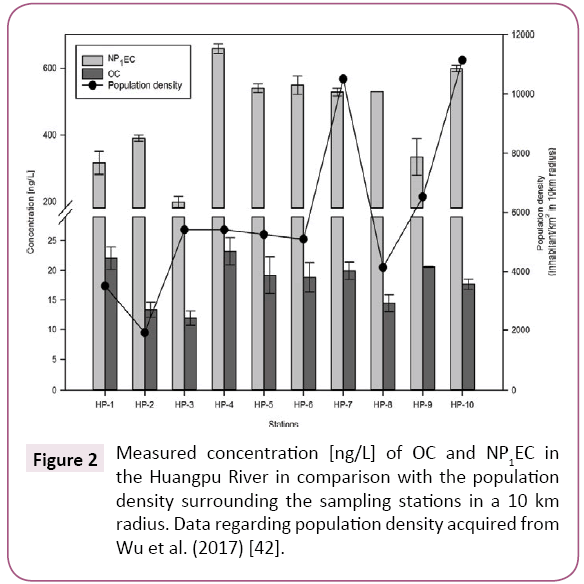
Figure 2: Measured concentration [ng/L] of OC and NP1EC in the Huangpu River in comparison with the population density surrounding the sampling stations in a 10 km radius. Data regarding population density acquired from Wu et al. (2017) [42].
OC was detected in 33% of surface water samples and 50% of bottom water samples in the East China Sea. At the surface it was only detected at the stations closest to the coast (F2, E2 and D2) and station F5, which all were of lower salinity. The maximum concentration (30.1 ± 2.5 ng/L) was measured at station F2, which is higher than in the Huangpu River. OC shows a slight positive correlation with salinity (rS=0.1, p=0.6), indicating that dilution has a minor effect on the distribution pattern of this compound. However, all sampling stations were positioned in the Changjiang Diluted Water (CDW, salinity<31), indicating that OC was transported with the CDW into the East China Sea. An ANOVA analysis displays, that there is a significant statistical difference (p<0.001) between the concentration in the Huangpu River and the East China Sea. Another possible input source can be the waste water of Zhejiang (WWTP connectivity: 71%) or the direct discharge of waste water from Shanghai into the East China Sea [7,28]. OC is photostable and not easily degradable. Higher concentrations in the bottom than surface water can be explained by is tendency to adsorb to particles, resulting in its transport/sinking through the water column or desorption from re-suspended sediment or particles [43,45]. Due to its lipophilic properties, sedimentation could be a possible sink for OC in the environment. That would explain the occurrence not only in the surface water but in the bottom water as well. The slight negative correlation with POC (rPOC=-0.1, p=0.7), is an additional indicator that the sorption of OC to particles can be seen as a sink of OC in the environment. However, it needs to be accounted for that this correlation is based on just few measurements. It is an indicator that there is a possible correlation between the concentration of OC and the particulate organic carbon content. In the East China Sea, OC has only been detected in Tokyo Bay (87-108 ng/L, Tsui et al.) and off-shore near Okinawa (n.d.-8.1 ng/L) [5]. Even though the sampling stations near Okinawa are closer to the coast, they display a slightly lower mean value than the mean concentration (10.7 ng/L) measured in this study (Figure 3) (Table 1 and S1).
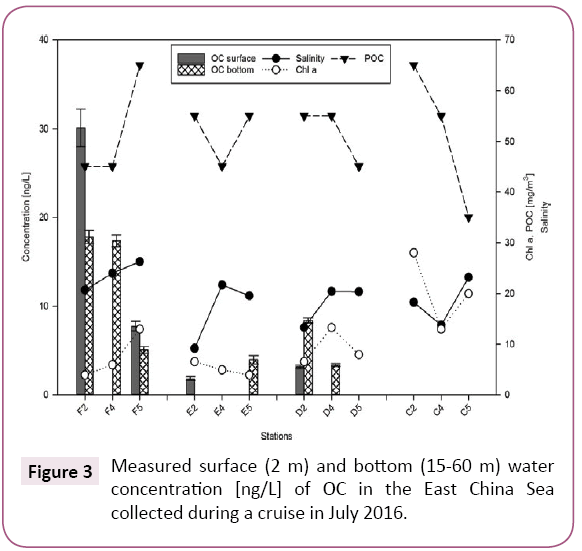
Figure 3: Measured surface (2 m) and bottom (15-60 m) water concentration [ng/L] of OC in the East China Sea collected during a cruise in July 2016.
In all surface and bottom water samples from Pearl River, OC was detected. No correlation was detected between the occurrence of OC and the population density of the surrounding area (10 km radius) of the sampling stations [47]. The surface and bottom water concentration are in similar range. The highest surface water concentration (9.8 ± 0.3 ng/L) was detected at station PR-1, which is the closest station to the city center of Guangzhou. OC then decreases towards the open South China Sea. Both, surface and bottom water concentration of OC display a negative correlation with salinity (rS=-0.4, p=0.3, rS=-0.3, p=0.4, respectively), which is different from the open marine system (see East and South China Sea, positive correlation). The attenuation coefficient adds up to k=0.01. The negative correlation with salinity, together with the attenuation coefficient point towards weak dilution effects as a reason for the declining OC concentration. However, even though OC gets slightly diluted the concentration does not decrease much from station PR-6 to PR-12, being close to a mean concentration of 2.9 ± 0.4 ng/L (Tables 1 and S1) (Figures 1b, S1 and 4).
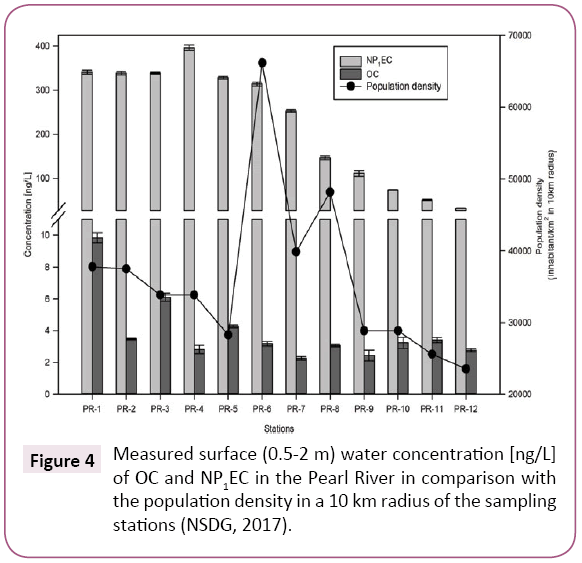
Figure 4: Measured surface (0.5-2 m) water concentration [ng/L] of OC and NP1EC in the Pearl River in comparison with the population density in a 10 km radius of the sampling stations (NSDG, 2017).
At 50% of the station OC was found in higher concentration in bottom water. It is possible that OC sinks towards the bottom due to its lipophilicity or is desorpt from sediment as a possible partition to other phases as was suggested by Tsui et al. [45]. The input into the environment occurs either directly (e.g. recreational activities) or indirectly via waste water. The Pearl River drains most of the Guangdong region, which has a WWTP connectivity of 51%, exposing the Pearl River Estuary (PRE) to a large amount of untreated waste water [7]. A few studies have been carried out on the occurrence of OC in the PRE so far. However, all studies were focused on the sediment phase or the biota and not the water phase. OC has been detected in fish, mussels and squid in the estuary [3,14]. OC was found up to >1000 ng/g in sediment of the PRE by Tsui et al. and Pintado- Herrera et al. [45,48]. Another study by Peng et al. detected up to 917 ng/g of OC as a major UV-filter in sediment of the estuary, which were in agreement with other studies carried out in Japan, Hong Kong, France and Germany [26]. Huang et al. reported a mean concentration of 16.0 ± 7.5 ng/g in the sediments of the estuary and a decrease in concentration towards the South China Sea [49]. Additionally, they detected hotspots of OC near the eastern side of the upper Pearl River, which they connected to a high sewage discharge of the large cities on the eastern side of the estuary, this could not be confirmed for the water phase in this study. Only the decrease from the city center of Guangzhou towards the South China Sea could be confirmed (Figure S1).
The Pearl River drains into the South China Sea, which has complex water dynamic. OC was detected in 76% of the surface water samples, mostly at stations on the eastern side of the estuary. The median concentration is 4.0 ng/L, with the maximum being 17.8 ± 0.4 ng/L at station SCS-58, near Dongsha Island. OC has not been measured in the open South China Sea before. The median concentration is slightly higher than in Pearl River (median: 3.2 ng/L), which might be caused by the different sampling seasons (March: Wet season, July: Dry season). However, an ANOVA analysis shows that there is no statistical significant difference (p=0.7) between the occurrence of OC in the Pearl River and the South China Sea. At all stations the salinity was slightly above 34, which is an indicator for oceanic conditions. However, a cyclonic eddy exists near Dongsha Island. He et al. reported that when the eastward Pearl River plume is transported towards the Taiwan Bank, it encounters the northern edge of the cyclonic eddy [50]. Its anticlockwise rotation is able to entrain the Pearl River Plume and to force some of the plume water southwestward, which might explain the occurrence and the slightly raised concentrations of OC in this area. The occurrence of OC correlates positively with the salinity (rS=0.1, p=0.5) as in the East China Sea. Again, this might be an indication that OC can be transported over a longer distance and is not easily degradable in the marine environment. An additional source could be the input of OC through the atmosphere. As has been reported by Ao et al., OC can be found in high amounts in indoor dusts [44]. If OC can be transported through the atmosphere needs to be examined. In agreement to the East China Sea, a slightly negative correlation between POC (rPOC=-0.4, p=0.01) and OC could be seen. More data is needed to determine the significance of POC as a sink for OC in the marine environment (Tables 1 and S1) (Figure 5).
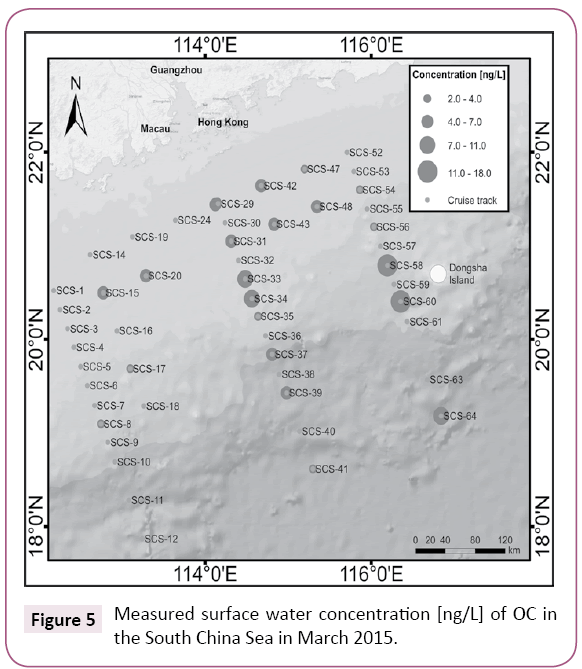
Figure 5: Measured surface water concentration [ng/L] of OC in the South China Sea in March 2015.
In comparison to other seas the measured median (4.0 ng/L) concentration is much lower. OC has been detected at higher concentrations in surface water near beaches in Norway (n.d.- 7301 ng/L), Gran Canaria (median: 109.7 ng/L), South Carolina (227 ng/L) and slightly higher in the Baltic Sea (median: 7.9 ng/L) [25,51-53]. However, these measurements were taken much closer to the coast and near beaches with high recreational activities. Furthermore, the mean concentration in the South China Sea is only half of that measured in the East China Sea within this study. A reason could be the different geological surroundings as the waters of the East China Sea are restricted by land, whereas the South China Sea is less restricted and is more openly connected to other seas. Whereas, statistical analysis shows that there is no statistical significant difference (p=0.3, ANOVA) between the East and South China Sea. Yet, it might be of great scientific interest and important for environmental studies to also analyze the sediments of both seas, in order to gain even more information about the behavior of OC and its distribution in the marine environment (Table 1).
Occurrence and distribution of NP1EC in aquatic environment
NP1EC is an intermediate in the degradation process from nonylphenol ethoxylate to nonylphenol and is mostly formed during the waste water treatment process (Montgomery-Brown et al., 2008). In the Huangpu River, NP1EC was detected in all samples with a concentration range from 198.1 ± 16.3 ng/L to 658.3 ± 13.9 ng/L. A negative attenuation coefficient (k=-0.01) was calculated, confirming the increase in concentration along the river towards the Changjiang River. Furthermore, a positive correlation (r=0.4, p=0.3) was found between the occurrence of NP1EC and the population density surrounding the sampling stations (data acquired from Wu et al.) [42]. As NP1EC is formed under aerobic conditions in WWTP, it enters the environment via waste water effluents [19]. It is relatively stable and more hydrophilic than nonylphenol, which explains its occurrence in the water phase. The positive correlation indicates a higher input rate of NP1EC in the densely populated urban area, resulting from a possible higher input of waste water from cosmetic industry and urban area surrounding the Changjiang River, as its parent compound is used in industrial laundry detergents (Figure 2) (Tables 1 and S1) [18,42].
In the East China Sea, NP1EC was detected at all surface water stations and in 75% of the bottom water samples. The measured concentrations (n.d. - 18.2 ng/L) are much lower than in the Huangpu River (p<0.001, ANOVA). Additionally, slightly higher concentrations were detected at the stations closest to the coastline (C2, D2, E2, F2) than at the off-shore stations (C5, D5, E5, F5) and in the surface water compared to the bottom water. The inverse correlations with salinity (rS=-0.3, p=0.3), POC (rPOC=-0.3, p=0.3) and Chl a (rChl a=-0.4, p=0.2) reconfirm the assumption that dilution is a major key player in the transport process. Furthermore, NP1EC can be degraded in 7-14 days under experimental conditions to nonylphenol, which is more toxic and can dominantly be detected in sediment [19]. The possible degradation to nonylphenol and consequentially the sorption to particular matter might explain the low bottom water concentrations. So far, NP1EC was not detected in marine waters prior to this study (Figures 6 and S2) (Tables 1 and S1).
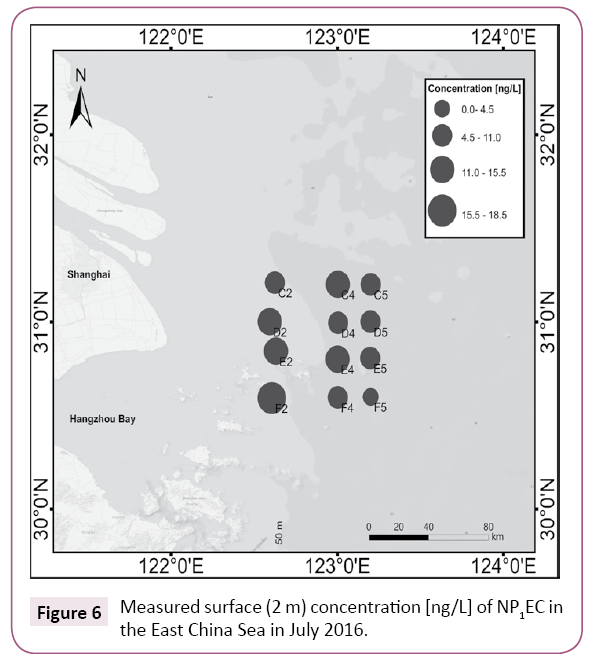
Figure 6: Measured surface (2 m) concentration [ng/L] of NP1EC in the East China Sea in July 2016.
In the Pearl River, lower concentrations than in the Huangpu River but higher than in the East China Sea of NP1EC were found. In difference to OC, a positive correlation (r=0.4, p=0.2) between NP1EC and the population density of the area surrounding the sampling stations was observed as in Shanghai (NSDG, 2017). NP1EC was not detected in the South China Sea during this study. However, in the Pearl River it was identified in all surface and bottom water samples. Surface and bottom water concentration are similar to each other and they display the same occurrence pattern. The concentrations increase from the city center (PR-1) towards PR-4, at which station the highest concentration was detected. The increase might be due to additional diffuse source e.g. waste water. From the maximum concentration (396.1 ± 6.1 ng/L) at PR-4 it then decreases towards the open South China Sea (PR-12, 32.5 ± 0.5 ng/L). Both, the surface and bottom water concentration display an inverse correlation with the salinity (rS=-0.9, p<0.01, rS=-0.9, p<0.01, respectively). This negative correlation is an indicator that the dilution effect is responsible for the decrease in concentration. Additionally, the attenuation coefficient (k=0.021) also provides proof of the transport of NP1EC along the river, with dilution taking place. As in the East China Sea, the NP1EC concentrations display an inverse correlation with POC (rPOC=-0.9, p=0.03) and Chl a (rChl a=-0.9, p=0.03). A possible explanation might be that NP1EC is degraded to nonylphenol, which then binds to particles and sinks out of the water column (Tables 1 and S1) (Figures 4 and 7).
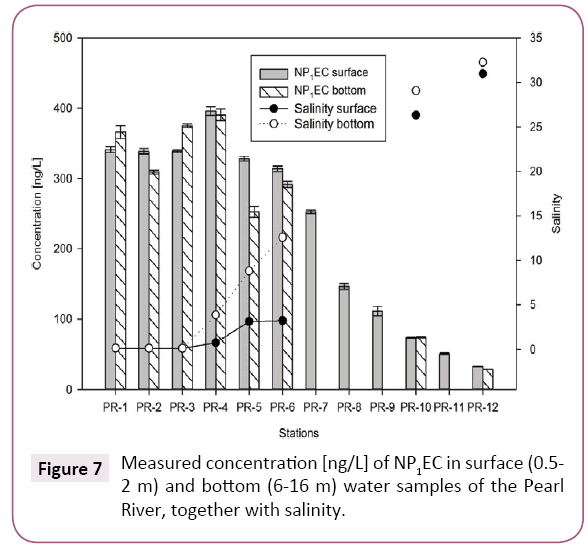
Figure 7: Measured concentration [ng/L] of NP1EC in surface (0.5- 2 m) and bottom (6-16 m) water samples of the Pearl River, together with salinity.
Nonylphenol is a largely analyzed endocrine disruptor in the Pearl River region. As for NP1EC, high amounts of nonylphenol were measured in sediments of the northern part (1906 ng/g) of the river and lower concentrations near Macau (26 ng/g) [48]. In 2011 Xu et al. measured a mean concentration of 45 ng/L of the degradation product nonylphenol in the PRE, which is significantly lower than the mean concentration of NP1EC (226.9 ± 133.9 ng/L) reported during this study [54]. The large difference in reported concentrations of nonylphenol is more likely related to its particle affinity as it can be more often found in the sediment phase due to a higher logKOW-value (5.7). In comparison to literature data the median concentration of the Pearl River (283.1 ng/L) is in similar range as the median value of 122 European rivers (233 ng/L) [24]. However, both mean concentrations of the Huangpu and Pearl River are lower than the mean concentration (661 ng/L) measured in the Seine Estuary in France (Table 1) [55].
Mass load and risk assessment
The mass load was calculated by multiplying the mean river concentration with the annual discharge volume of the rivers. When comparing the Huangpu and Pearl River, it becomes apparent that in the Huangpu River higher concentrations of both endocrine disruptors were found (mean concentration: 482.0 ng/L, 230.8 ng/L, respectively). In spite of a higher mean total concentration the total mass load in the Huangpu River is much lower than in the Pearl River (total mass load: 4.8 t/a, 77.6 t/a, respectively). This existing difference is due to the large difference in the annual water discharge volumes of the rivers (Huangpu River: 10 billion m3/a, Lee, Pearl River: 336 billion m3/a, Zhang et al.) [56,57]. The calculated mass load for OC is similar to the estimated emission rate of Zhu et al. [7]. They estimated an OC emission rate of 0.07 - 0.2 t of OC for Shanghai. Our study resulted in a mass load of 0.2 t/a of OC in the Huangpu River, which is within the range of the estimation. The OC mass load (1.3 t/a) of the Pearl River also fits with previous estimates in the range of 0.5-6.6 t for Guangdong [7]. Concentrations and mass load reported in this study mirror the prevailing conditions during the sampling period and are most likely typical for the freshwater discharge season (Table 1).
Furthermore, a risk assessment was carried out to better understand the potential effects of the occurring concentrations. For both endocrine disruptors a risk quotient (RQ) was calculated for each system. So far the measured concentrations of OC are of low risk (RQ<0.1) to aquatic organisms in the evaluated four water systems. For NP1EC no RQ was calculated for the South China Sea as it was not found and only a low risk was calculated for the East China Sea. Yet, it does pose a medium risk to aquatic organisms in both rivers as it was detected in high ng/L range (Tables 1 and 2).
| Compound |
PNEC(freshwater) |
PNEC(marine) |
Huangpu River |
Pearl River |
East China Sea |
South China Sea |
| |
[µg/L] |
[µg/L] |
RQ |
RQ |
RQ |
RQ |
| OC |
0.51 |
2.32 |
0.04 |
0.02 |
0.01 |
0.007 |
| NP1EC |
2.03 |
2.03 |
0.3 |
0.2 |
0.01 |
- |
RQ<0.1 low risk, 0.1 ≤ RQ ≤ 1 medium risk, 1 ≤ RQ high risk.
Table 2: Calculated risk quotient (RQ) of octocrylene (OC) and nonylphenoxyacetic acid (NP1EC) in freshwater systems: Huangpu River and Pearl River and in marine systems: East and South China Sea [57-59].
Conclusion
The results obtained in this study validate, that both endocrine disrupting compounds (OC, NP1EC) occur in the Huangpu and Pearl River at concentrations which are comparable to other studies. The occurrence of both compounds in the East China Sea and the occurrence of OC in the South China Sea open up questions about a possible long half-life time and a possible stability in the marine environment. In case of OC, which was mostly found in sediment so far, this study shows that water phase is also of importance. Future studies should focus on the partitioning of OC between the water and sediment phase and a possible re-suspension from the sediment phase. Furthermore, in terms of OC studies are needed to determine, if dust events could be an additional source of these compounds in the open marine environment.
Supporting Information
Supplementary data associated with this article can be found in the online version at: https://www.imedpub.com/supplementaryfile/ IPJAPT-1s.pdf
Acknowledgement
This study was financed by the German academic exchange service (57212311), Leibniz-Institute for Baltic Sea Research (IOW internal budget) and the China Geological Survey on Marine Geology (GZH201100311 and DD20160216). The cruise with research vessel ZheHai Ke 1 was financed by Chinese National Science Foundation (J1310037). The authors thank Klaus Bohn from LPL for the logistical help. From IOW we would also like to thank Ingo Schuffenhauer and Siegfried Krüger for the CTDMeasurements, Jenny Jeschek and Ines Hand for measuring POC and Chl a in the South China Sea during the cruise in March 2015. We thank all crew members, scientists and technicians involved in the field work and cruises. Furthermore, we would like to thank Zhen Xia and all GMGS for their cooperation.
References
- Demographia (2017) Demographia world urban areas. Built Up Urban Areas or World Agglomerations 4: 1-112.
- OECD (2015) OECD urban policy reviews: China 2015. OECD Publishing, Paris.
- Sang Z, Leung KSY (2016) Environmental occurrence and ecological risk assessment of organic UV filters in marine organisms from Hong Kong coastal waters. Sci Total Environ 566: 489-498.
- Rodil R, Quintana JB, Lopez-Mahia P, Muniategui-Lorenzo S, Prada-Rodriguez D (2008) Multiclass determination of sunscreen chemicals in water samples by liquid chromatography-tandem mass spectrometry. Anal Chem 80: 1307-1315.
- Tsui MMP, Leung HW, Wai TC, Yamashita N, Taniyasu S, et al. (2014) Occurrence, distribution and ecological risk assessment of multiple classes of UV filters in surface waters from different countries. Water Res 67: 55-65.
- Blüthgen N, Meili N, Chew G, Odermatt A, Fent K (2014) Accumulation and effects of the UV-filter octocrylene in adult and embryonic zebrafish (Danio rerio). Sci Total Environ 476: 207-217.
- Zhu Y, Price OR, Kilgallon J, Rendal C, Tao S, et al. (2016) A multimedia fate model to support chemical management in China: A case study for selected trace organics. Environ Sci Technol 50: 7001-7009.
- Schlumpf M, Kypke K, Wittassek M, Angerer J, Mascher H, et al. (2010) Exposure patterns of UV filters, fragrances, parabens, phthalates, organochlor pesticides, PBDEs and PCBs in human milk: Correlation of UV filters with use of cosmetics. Chemosphere 81: 1171-1183.
- Bachelot M, Li Z, Munaron D, Le-Gall P, Casellas C, et al. (2012) Organic UV-filter concentrations in marine mussels from French coastal regions. Sci Total Environ 420: 273-279.
- Gago-Ferrero P, Díaz-Cruz MS, Barceló D (2012) An overview of UV-absorbing compounds (organic UV-filters) in aquatic biota. Anal Bioanal Chem 404: 2597-2610.
- Gago-Ferrero P, Alonso MB, Bertozzi CP, Marigo J, Barbosa L, et al. (2013) First determination of UV-filters in marine mammals. Octocrylene levels in Franciscana Dolphins. Environ Sci Technol 47: 5619-5625.
- Gago-Ferrero P, Díaz-Cruz MS, Barceló D (2015) UV-filters bioaccumulation in fish from Iberian river basins. Sci Total Environ 518: 518-525.
- Peng X, Jin J, Wang C, Ou W, Tang C (2015) Multi-target determination of organic ultraviolet absorbents in organism tissues by ultrasonic assisted extraction and ultra-high performance liquid chromatography-tandem mass spectrometry. J Chromatography A 1384: 97-106.
- Peng X, Fan Y, Jin J, Xiong S, Liu J, et al. (2017a) Bioaccumulation and bio magnification of ultraviolet absorbents in marine wildlife of the Pearl River Estuarine, South China Sea. Environ Pollut 225: 55-65.
- Zhang QY, Ma XY, Wang XC, Ngo HH (2016) Assessment of multiple hormone activities of a UV-filter (octocrylene) in zebrafish (Danio rerio). Chemosphere 159: 433-441.
- Campos D, Gravato C, Quintaneiro C, Golovko O, Žlábek V, et al. (2017) Toxicity of organic UV-filters to the aquatic midge Chironomus riparius. Ecotoxicol Environ Saf 143: 210-216.
- Giraldo A, Montes R, Rodil R, Quintana JB, Vidal-Liñán L, et al. (2017) Ecotoxicological evaluation of the UV Filters ethylhexyl dimethyl p-aminobenzoic acid and octocrylene using marine organisms Isochrysis galbana, Mytilus galloprovincialis and Paracentrotus lividus. Arch Environ Contam Toxicol 72: 606-611.
- Marcomini A, Filipuzzi F, Giger W (1988) Aromatic surfactants in laundry detergents and hard-surface cleaners: Linear alkylbenzene sulphonates and alkylphenol polyethoxylates. Chemosphere 17: 853-863.
- Montgomery-Brown J, Li Y, Ding WH, Mong GM, Campbell JA, et al. (2008) NP1EC degradation pathways under oxic and microxic conditions. Environ Sci Technol 42: 6409-6414.
- Esteban S, Gorga M, Petrovic M, González-Alonso S, Barcel D, et al. (2014) Analysis and occurrence of endocrine-disrupting compounds and estrogenic activity in the surface waters of Central Spain. Sci Total Environ 466: 939-951.
- Pojana G, Gomiero A, Jonkers N, Marcomini A (2007) Natural and synthetic endocrine disrupting compounds (EDCs) in water, sediment and biota of a coastal lagoon. Environ Int 33: 929-936.
- Molins-Delgado D, Tavora Ja, Díaz-Cruz MS, Barceló D (2017) UV filters and benzotriazoles in urban aquatic ecosystems: The footprint of daily use products. Sci Total Environ 601: 975-986.
- Tamura I, Yasuda Y, Kagota Ki, Yoneda S, Nakada N, et al. (2017) Contribution of pharmaceuticals and personal care products (PPCPs) to whole toxicity of water samples collected in effluent-dominated urban streams. Ecotoxicol Environ Saf 144: 338-350.
- Loos R, Gawlik BM, Locoro G, Rimaviciute E, Contini S, et al. (2009) Eu-wide survey of polar organic persistent pollutants in European river waters. Environ Pollut 157: 561-568.
- Fisch K, Waniek JJ, Schulz-Bull DE (2017) Occurrence of pharmaceuticals and UV-filters in riverine run-offs and waters of the German Baltic Sea. Mar Pollut Bull 124: 388-399.
- Peng X, Xiong S, Ou W, Wang Z, Tan J, et al. (2017b) Persistence, temporal and spatial profiles of ultraviolet absorbents and phenolic personal care products in riverine and estuarine sediment of the Pearl River catchment, China. J Hazard Mater 323: 139-146.
- Sun Q, Li Y, Li M, Ashfaq M, Lv M, et al. (2016) PPCPs in Jiulong River estuary (China): Spatiotemporal distributions, fate and their use as chemical markers of wastewater. Chemosphere 150: 596-604.
- Jiang L, Hu X, Yin D, Zhang H, Yu Z (2011) Occurrence, distribution and seasonal variation of antibiotics in the Huangpu River, Shanghai, China. Chemosphere 82: 822-828.
- Zhang A, Li Y, Chen L (2014) Distribution and seasonal variation of estrogenic endocrine disrupting compounds, N-nitrosodimethylamine and N-nitrosodimethylamine formation potential in the Huangpu River, China. J Environ Sci 26: 1023-1033.
- Gao L, Li D, Ishizaka J, Zhang Y, Zong H, et al. (2015) Nutrient dynamics across the river-sea interface in the Changjiang (Yangtze River) estuary-East China Sea region. Limnol Oceanogr 60: 2207-2221.
- Jiang Z, Chen J, Zhou F, Zhai H, Zhang D, et al. (2017) Summer distribution patterns of Trichodesmium spp. in the Changjiang (Yangtze River) Estuary and adjacent East China Sea shelf. Oceanologia 59: 248-261.
- Peng X, Yu Y, Tang C, Tan J, Huang Q, et al. (2008) Occurrence of steroid estrogens, endocrine-disrupting phenols and acid pharmaceutical residues in urban riverine water of the Pearl River Delta, South China. Sci Total Environ 397: 158-166.
- Zhang W, Wang Wg, Zheng Jh, Wang Hg, Wang G, et al. (2015b) Reconstruction of stage-discharge relationships and analysis of hydraulic geometry variations: The case study of the Pearl River Delta, China. Glob Planet Change 125: 60-70.
- Zu T, Gan J (2015) A numerical study of coupled estuary shelf circulation around the Pearl River Estuary during summer: Responses to variable winds, tides and river discharge. Deep Sea Res Part II: Top Stud Oceanogr 117: 53-64.
- Wang D, Shu Y, Xue H, Hu J, Chen J, et al. (2014) Relative contributions of local wind and topography to the coastal upwelling intensity in the northern South China Sea. J Geophys Res: Oceans 119: 2550-2567.
- Chen JC, Heinke GW, Zhou MJ (2004) The pearl river estuary pollution project (PREPP). Cont Shelf Res 24: 1739-1744.
- NASA, Giovanni.
- Orlikowska A, Fisch K, Schulz-Bull DE (2015) Organic polar pollutants in surface waters of inland seas. Mar Pollut Bull 101: 860-866.
- Luo Y, Xu L, Rysz M, Wang Y, Zhang H, et al. (2011) Occurrence and transport of tetracycline, sulfonamide, quinolone and macrolide antibiotics in the Haihe River Basin, China. Environ Sci Technol 45: 1827-1833.
- Zhang R, Tang J, Li J, Zheng Q, Liu D, et al. (2013) Antibiotics in the offshore waters of the Bohai Sea and the Yellow Sea in China: Occurrence, distribution and ecological risks. Environ Pollut 174: 71-77.
- European C (2003) European commission technical guidance document in support of commission directive 93//67/eec on risk assessment for new notified substances and commission regulation (ec) no. 1488/94 on risk assessment for existing substance, part II. Commission, E(Edtn), pp: 100-103.
- Wu Mh, Xie Dg, Xu G, Sun R, Xia Xy, et al. (2017) Benzophenone-type UV filters in surface waters: An assessment of profiles and ecological risks in Shanghai, China. Ecotoxicol Environ Saf 141: 235-241.
- Brausch JM, Rand GM (2011) A review of personal care products in the aquatic environment: Environmental concentrations and toxicity. Chemosphere 82: 1518-1532.
- Ao J, Yuan T, Ma Y, Gao L, Ni N, et al. (2017) Identification, characteristics and human exposure assessments of triclosan, bisphenol-A and four commonly used organic UV filters in indoor dust collected from Shanghai, China. Chemosphere 184: 575-583.
- Tsui MMP, Leung HW, Kwan BKY, Ng KY, Yamashita N, et al. (2015) Occurrence, distribution and ecological risk assessment of multiple classes of UV filters in marine sediments in Hong Kong and Japan. J Hazard Mater 292: 180-187.
- Tashiro Y, Kameda Y (2013) Concentration of organic sun-blocking agents in seawater of beaches and coral reefs of Okinawa Island, Japan. Mar Pollut Bull 77: 333-340.
- NSDG (2017) National and Guangdong statistics department.
- Pintado-Herrera MG, Wang C, Lu J, Chang YP, Chen W, et al. (2017) Distribution, mass inventories and ecological risk assessment of legacy and emerging contaminants in sediments from the Pearl River Estuary in China. J Hazard Mater 323: 128-138.
- Huang W, Xie Z, Yan W, Mi W, Xu W (2016) Occurrence and distribution of synthetic musks and organic UV filters from riverine and coastal sediments in the Pearl River estuary of China. Mar Pollut Bull 111: 153-159.
- He X, Xu D, Bai Y, Pan D, Chen CTA, et al. (2016) Eddy-entrained Pearl River plume into the oligotrophic basin of the South China Sea. Contin Shelf Res 124: 117-124.
- Langford KH, Thomas KV (2008) Inputs of chemicals from recreational activities into the Norwegian coastal zone. Journal of Environmental Monitoring 10: 894-898.
- Rodríguez AS, Sanz MR, Rodríguez JRB (2015) Occurrence of eight UV filters in beaches of Gran Canaria (Canary Islands). An approach to environmental risk assessment. Chemosphere 131: 85-90.
- Bratkovics S, Wirth E, Sapozhnikova Y, Pennington P, Sanger D (2015) Baseline monitoring of organic sunscreen compounds along South Carolina’s coastal marine environment. Mar Pollut Bull 101: 370-377.
- Xu W, Yan W, Huang W, Miao L, Zhong L (2014) Endocrine-disrupting chemicals in the Pearl River Delta and coastal environment: Sources, transfer and implications. Environ Geochem Health 36: 1095-1104.
- Cailleaud K, Forget-Leray J, Souissi S, Lardy S, Augagneur S, et al. (2007) Seasonal variation of hydrophobic organic contaminant concentrations in the water-column of the seine estuary and their transfer to a planktonic species Eurytemora affinis (calanod, copepod). Part 2: Alkylphenol-polyethoxylates. Chemosphere 70: 281-287.
- Lee S (2006) Water and Development in China: The political economy of Shanghai water policy.
- Zhang NS, Liu YS, Brink PJVD, Price OR, Ying GG (2015a) Ecological risks of home and personal care products in the riverine environment of a rural region in South China without domestic wastewater treatment facilities. Ecotoxicol Environ Saf 122: 417-425.
- Langford KH, Reid MJ, Fjeld E, Oxnevad S, Thomas KV (2015) Environmental occurrence and risk of organic UV-filters and stabilizers in multiple matrices in Norway. Environ Int 80: 1-7.
- Fenner K, Kooijman C, Scheringer M, Hungerbühler K (2002) Including transformation products into the risk assessment for chemicals: The case of nonylphenol ethoxylate usage in Switzerland. Environ Sci Technol 36: 1147-1154.