Keywords
Paediatric glaucoma; Disc damage likelihood scale; Optic coherence tomography; Stereo photography; Heidelberg retina tomography
Abbreviations
DDLS-Disc Damage Likelihood Scale; GPS-Glaucoma Probability Score; HRT-Heidelberg Retina Tomography; IOP-Intraocular Pressure; MD-Mean Defect; MRA-Moorfields Regression Analysis; OCT-Optic Coherence Tomography; POAG-Primary Open Angle Glaucoma; PSD-Pattern Standard Deviation; ONH-Optic Nerve Head; RNFL-Retinal Nerve Fibre Layer; SD-OCT-Spectral Domain-Optic Coherence Tomography.
Background
Various glaucoma parameters and new devices were developed for monitoring glaucoma patients and suspects recently [1-6]. These techniques were usually adapted to an adult cohort [1-3,6]. As paediatric glaucoma is still one of the leading causes for inability to work and blindness in young age, investigations of effective parameters for early detection, diagnosis and follow up have to be made [7]. Morphological optic nerve head (ONH) parameters such as the retinal nerve fibre layer (RNFL), Moorfields regression analysis (MRA), glaucoma probability score (GPS) and F.S. Mikelberg and R. Burk coefficients showed to be adequate in ONH evaluation in glaucoma patients [2,3,5,8-10]. Spectral Domain optical coherence tomography (SD-OCT) can be used to assess peripapillary RNFL thickness, macular thickness, and retinal layer thickness in children as young as 5 years [10]. SD-OCT was easier to obtain than Time Domain (TD)-OCT in children (n=83) [11]. Yanni et al. developed a data set for paediatric means and normative reference ranges that could be used as a standard with which to compare those children suspected of having retinal or optic nerve abnormalities [10]. Progressive disc tilting and the development or enlargement of peripapillary atrophy (PPA) are known factors during a myopic shift in children and must be taken into account when analysing infantile discs [12]. Eyes of childhood glaucoma patients, however, exhibited less significant changes in disc morphology during myopic shift compared to eyes with normal disc or enlarged cup-to-disc ratio [12].
See comment in PubMed Commons belowSee comment in PubMed Commons belowThe disc damage likelihood scale (DDLS) was devised by Spaeth et al. to incorporate the effect of disc size and focal rim width into a clinical grading scale in 2002 [6,13]. It could be demonstrated that DDLS is highly correlated with glaucomatous visual field defects and showed a high interobserver reproducibility [6,13,14].
In this study the DDLS was objectively measured by the KOWA nonmyd WX 3D fundus camera. The aim of this study was to assess the correlation between the objective DDLS and the Heidelberg retina tomography (HRT) and OCT as widely used glaucoma diagnostic tools and to assess the predictability of glaucomatous damage in children.
Methods
This prospective study was completed under the agreement of the ethical committee of the Charite university medicine, Berlin. The criteria of the declaration of Helsinki were fulfilled. Written consent of all patients was obtained; three different versions of agreement forms for different ages were provided and a form for the parents/caretakers to sign it. Children of any age could understand the meaning and consequences of conducting in this study, however, all parents/guardians also signed the consent form. All consent forms were approved by the ethical committee of the Charite university medicine, Berlin.
A total of 47 eyes (n=47) were included. Patients were categorized into three groups; 14 normal optic discs (11 female, 3 male, age 12.7 ± 6.1 years), 15 glaucoma suspects (3 female, 12 male, age 11.7 ± 3.1 years) and 18 paediatric glaucoma diagnoses (10 female, 8 male, 11.2 ± 2.5 years), summarized in Table 1. The paediatric glaucoma cohort consists of 8 infantile glaucoma, 5 primary congenital glaucoma, 1 aniridia and 4 secondary glaucoma (2 pseudophacic glaucoma, 2 uveitic glaucoma).
| Cohort |
|
Age |
CDR Examiner |
GAT |
Phakic |
Pseudo |
Cup volume KOWA |
Cup volume |
| Normal |
Mean ± stdev |
12.7 ± 6.10 |
0.37 ± 0.11 |
17.82 ± 3.46 |
12 |
2 |
0.22 ± 0.14 |
0.16 ± 0.13 |
| Median |
10.6 |
0.4 |
18 |
|
|
|
|
| Glaucoma suspects |
Mean ± stdev |
11.7 ± 3.10 |
0.49 ± 0.12 |
16.08 ± 2.72 |
15 |
|
0.32 ± 0.21 |
0.25 ± 0.10 |
| Median |
12.8 |
0.5 |
16 |
|
|
|
|
| Glaucoma |
Mean ± stdev |
11.2 ± 2.50 |
0.76 ± 0.07 |
18.47 ± 4.34 |
16 |
2 |
0.47 ± 0.30 |
0.54 ± 0.45 |
| Median |
10.8 |
0.8 |
18 |
|
|
|
|
Table 1: Demographic and descriptive statistics (mean, standard deviation, median) of different glaucoma parameters in the three study cohorts.
Inclusion criteria were age >5years (able to absolve diagnostic tests), best corrected visual acuity of at least 20/200 (6/60), astigmatism <2.5 dpt and clear optic media. To avoid nationality based differences in optic disc morphology, a Caucasian cohort was used for this study [15]. Exclusion criteria included macrodiscs, microdiscs, higher spherical errors (>5 dpt.) and higher astigmatism >2.5 dpt., contact lenses, hazy optic media interfering with fundus examination, ocular trauma and patients with intraocular surgery for less than 3 months. Additionally, children with neurologic disorders and prematurity were excluded.
We recognised in this study cohort, that reliable visual field tests were obtained at the age of 11 years. Healthy eyes were selected out of the normal population and did not show distinctive structural or morphological features of glaucoma (if possible, mean defect (MD) <2dB, pattern standard deviation (PSD) <2dB). Glaucoma suspects were defined as having morphological and structural alterations (funduscopy, if possible, visual field test MD>2-4dB, PSD>2-4dB) of the optic disc and normal intraocular pressure or eyes with borderline/ high individual IOP and normal diagnostics (MD<2dB, PSD<2dB).
To be diagnosed as manifest paediatric glaucoma structural and morphological optic disc alterations were present. The optic disc was described according to the diagnostic criteria by Jonas in children >11years, which were able to repeat reliable visual field testing (MD>4dB, PSD>4dB) [16]. In addition especially in children, the increased IOP and wide diurnal IOP variations were a sensitive marker for glaucoma [17].
All patients were measured by the Kowa nonmyd WX 3D camera (2D/3D Nonmydriatic Retinal Camera, Kowa Company Ltd., Japan), the HRT3 (Heidelberg Engineering GmBH, Germany), and OCT (SD-OCT, Carl Zeiss Meditec, Dublin, CA, USA) by one examiner on the same day. The correlation of the CDR between KOWA, HRT3, and Funduscopy was analysed in the study cohort. All 3 devices graded the optic disc topography related to the predictability for glaucomatous damage in “healthy”, “borderline” and “outside normal limits” results. The study population was split into two groups: Diagnosis 1 “outside normal limits”, diagnosis 2 “borderline and outside normal limits”. Kowa nonmyd WX 3D.
The Kowa nonmyd WX 3D (2D/3D Nonmydriatic Retinal Camera, Kowa Company Ltd.) fundus camera recorded simultaneously two images (stereometric) of the optic disc which are at an angle of 34° to each other. The pupil diameter should not be smaller than a minimum diameter of 4 mm. Due to the different shooting angle a horizontal shift of the pixels (1600 × 1600 pixels) was obtained, which was highly reproducible. Based on the correlation coefficient of the red, green and blue channel images, the corresponding pixels of the two captured images could be identified and the disparity was calculated. This was correlated with the depth of the image and was specified via an algorithm. As a reference plane the retina was chosen. It was defined by a horizontal line through the centre of the papilla.
The contour of the disc was marked by the inner margin of Elschnig's scleral ring. The contour of the cup was assigned by the outer margin of the cup, which was indicated by the bending of the ONH vessels at the rim [18]. The observer determined several points on the contour (usually 8-12), and the contour line was then automatically generated by software spline interpolation [18].
Stereometric parameters obtained were disc area, rim volume, cup volume, disc volume, vertical cup/disc ratio, cup disc area ratio, rim disc area ratio, height variation contour etceteras. In this study the items vertical cup/disc ratio, disc area and cup volume were used for further analysis. The rim/disc ratio was objectively quantified in the six quadrants of the optic nerve head.
Spectral domain-optical coherence tomography (SD-OCT)
The technique of optical coherence tomography is described in several papers.1, In summary, the OCT is an optical signal acquisition method [1,4]. It captured micrometre resolution, three-dimensional images from optical scattering media [4,5,10]. OCT is an interferometric technique using near-infrared light. The use of relatively long wavelength light allowed it to penetrate into the scattering medium. The OCT retinal nerve fibre layer thickness analysis was performed by fast retinal nerve fibre layer map protocols using an internal fixation target [4].
Heidelberg retina tomography (HRT 3)
Based on the confocal laser scanning ophthalmoscopy technique it displayed high-resolution optical images with depth selectivity [19]. In-focus images from selected depths could be acquired. Images were traced point-by-point and reconstructed with a software program allowing three-dimensional reconstructions of the objects. Moorfields regression analysis (MRA), glaucoma probability scores (GBS) and stereometric parameters were evaluated. Furthermore R Burk and FS. Mikelberg coefficients were analysed [2,3].
Disc damage likelihood scale (DDLS)
This scale incorporated the size of the disc and the radial width of the neuroretinal rim in evaluating the optic nerve head. The system categorised the optic nerve head (ONH) as small (<1.5 mm), medium (1.5-2.0 mm) or large (>2.0 mm).
This ensured that the disc size was measured thereby reducing misclassification bias based on disc size [6,14,20]. In this study, the KOWA fundus camera objectively measured the DDLS (Figure 1).
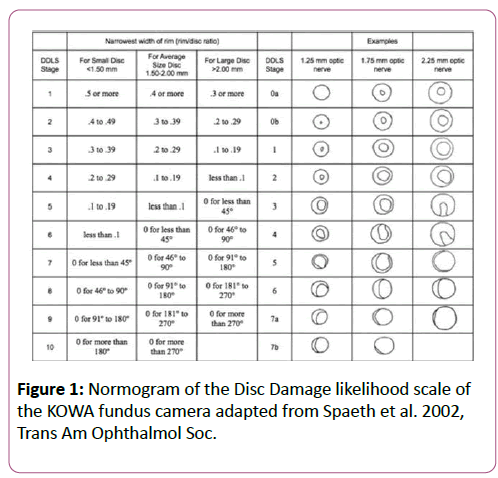
Figure 1: Normogram of the Disc Damage likelihood scale of the KOWA fundus camera adapted from Spaeth et al. 2002, Trans Am Ophthalmol Soc.
Statistical Analysis
Statistical data were calculated using Statistical Package for the Social Sciences (SPSS) version 20.0; from SPSS, Inc. linear regression analysis and descriptive statistics (mean, standard deviation, 95% limits of agreement and correlation quotients) were processed.
The relationship between DDLS, HRT3 parameters, and OCT RNFL was analysed with a c2-test. The area under the curve (Receiving operating characteristics ROC) was used to identify useful parameters to detect glaucomatous damage. A p-value of less than 0.05 indicated a statistically significant difference.
Results
Data of 14 healthy eyes, 15 glaucoma suspects and 18 paediatric glaucoma were analysed. Descriptive Statistics were presented in Table 1.
The disc area measured by HRT 3 was 2.39 ± 0.66 mm2 and the mean disc area of the KOWA was 3.19 ± 0.48 mm2 in healthy patients (p=0.01).
The mean disc area of the HRT was 2.38 ± 0.41 mm2, whereas the mean disc area of the KOWA was 3.25 ± 0.70 mm2 in glaucoma suspects (p=0.01).
The mean disc area of the HRT was 3.41 ± 1.05 mm2, whereas the mean disc area of the KOWA was 3.45 ± 0.84 mm2 in paediatric glaucoma (p=0.80).
Correlation of the KOWA rim/disc ratio compared to the RNFL, MRA and GPS in the six quadrants of the optic nerve head was summarized in Table 2.
Kowa rim/disc ratio, Correlation coefficient,
p value |
Normal |
|
|
Glaucoma suspects |
|
|
Manifest Glaucoma |
|
|
| |
RNFL |
MRA |
GPS |
RNFL |
MRA |
GPS |
RNFL |
MRA |
GPS |
| Temporal |
r=0.446 |
r=-0.583 |
r=0.253 |
r=-0.004 |
r=-0.147 |
r=-0.693 |
r=0.288 |
r=-0.028 |
r=-0.656 |
| p=0.110 |
p=0.130 |
p=0.545 |
p=0.988 |
p=0.813 |
p= 0.194 |
p=0.262 |
p=0.938 |
p= 0.039 |
| Superotemporal |
r=0.244 |
r=-0.808 |
r=0.162 |
r=-0.041 |
r=-0.029 |
r=-0.715 |
r=-0.087 |
r=-0.255 |
r=-0.755 |
| p=0.40 |
p=0.015 |
p=0.701 |
p=0.883 |
p=0.963 |
p=0.175 |
p=0.739 |
p=0.477 |
p=0.012 |
| Superonasal |
r=0.213 |
r=-0.108 |
r=-0.020 |
r=0.078 |
r=0.668 |
r=-0.941 |
r=0.068 |
r=-0.190 |
r=-0.794 |
| p=0.465 |
p=0.800 |
p=0.963 |
p=0.792 |
p=0.218 |
p=0.017 |
p=0.795 |
p=0.598 |
p=0.006 |
| Inferotemporal |
r=-0.188 |
r=-0.161 |
r=-0.026 |
r=0.417 |
r=0.033 |
r=-0.641 |
r=0.133 |
r=-0.220 |
r=-0.636 |
| p=0.520 |
p=0.702 |
p=0.952 |
p=0.122 |
p=0.958 |
p=0.244 |
p=0.611 |
p=0.542 |
p=0.048 |
| Inferonasal |
r=0.237 |
r=0.493 |
r=0.181 |
r=-0.220 |
r=-0.605 |
r=-0.556 |
r=-0.217 |
r=-0.440 |
r=-0.659 |
| p=0.436 |
p=0.214 |
p=0.668 |
p=0.449 |
p=0.280 |
p=0.331 |
p=0.402 |
p=0.203 |
p=0.038 |
| Nasal |
r=-0.106 |
r=0.173 |
r=-0.026 |
r=0.313 |
r=-0.339 |
r=-0.717 |
r=-0.366 |
r=0.334 |
r=-0.845 |
| p=0.719 |
p=0.682 |
p=0.952 |
p=0.255 |
p=0.577 |
p=0.173 |
p=0.149 |
p=0.346 |
p=0.002 |
Table 2: Correlation of the KOWA rim/disc ratio compared to retinal nerve fibre layer (RNFL), Moorfields regression analysis (MRA) and glaucoma probability score (GPS) in six quadrants of the optic nerve head.
Correlation of the cup/disc ratio between KOWA, HRT and funduscopy
In healthy patients, the CDR of the KOWA compared to CDR by HRT 3 (r=-0.689 p=0.059) and to the CDR of the examiner (r=-0.618 p=0.032) showed a good correlation. Further the CDR of the HRT 3 compared to the CDR of the examiner showed a good correlation (r=0.624 p=0.098).
In glaucoma suspects, the CDR of the KOWA compared to CDR by HRT 3 showed a good correlation (r=0.761 p=0.136), whereas the CDR of the KOWA (r=0.161 p=0.568) and the CDR by HRT 3 (r=0.107 p=0.864) compared to the CDR of the examiner showed a poor correlation.
In paediatric glaucoma, the CDR of the KOWA compared to CDR by HRT 3 showed a very good correlation (r=0.850, p=0.002). Additionally the CDR of the KOWA (r=0.558 p=0.059) compared to the CDR of the examiner showed a good correlation. In contrast, the CDR by HRT 3 (r=0.198 p=0.609) compared to the CDR of the examiner showed a poor correlation.
Glaucoma diagnostic analysis in normal patients
Referring to diagnosis 1 (“outside normal limits”) Figure 2
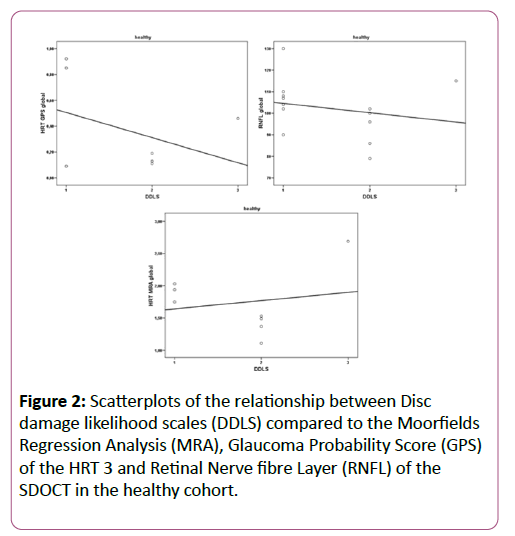
Figure 2: Scatterplots of the relationship between Disc damage likelihood scales (DDLS) compared to the Moorfields Regression Analysis (MRA), Glaucoma Probability Score (GPS) of the HRT 3 and Retinal Nerve fibre Layer (RNFL) of the SDOCT in the healthy cohort.
DDLS did not show a significant correlation with MRA (p=0.565), GPS (p=0.108) and RNFL (p=0.907).
Referring to diagnosis 2 (“borderline or outside normal limits”)
The GPS (p=0.076), MRA (p=0.801) and RNFL (p=0.610) did not correlate significantly compared to DDLS. Between DDLS 0-4 and R. Burk (p=0.126) and F.S. Mikelberg coefficient (p=0.053) a statistically significance could not be reached.
Glaucoma diagnostic analysis in glaucoma suspects
Referring to diagnosis 1 (“outside normal limits”) Figure 3
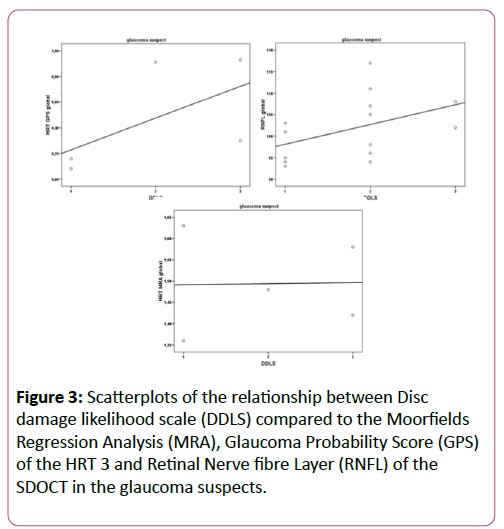
Figure 3: Scatterplots of the relationship between Disc damage likelihood scale (DDLS) compared to the Moorfields Regression Analysis (MRA), Glaucoma Probability Score (GPS) of the HRT 3 and Retinal Nerve fibre Layer (RNFL) of the SDOCT in the glaucoma suspects.
DDLS did not show a significant correlation with MRA (p=0.082), GPS (p=0.233) and RNFL (p=0.448).
Referring to diagnosis 2 (“borderline or outside normal limits”)
DDLS did not correlate significantly with MRA (p=0.082), GPS (p=0.082) and RNFL (p=0.343). No significant correlation between DDLS Grading 0-4 and R. Burk (p=0.167) and F.S. Mikelberg coefficient (p=0.073) was found.
Glaucoma diagnostic analysis in paediatric glaucoma
Referring to diagnosis 1 (“outside normal limits”) figure 4
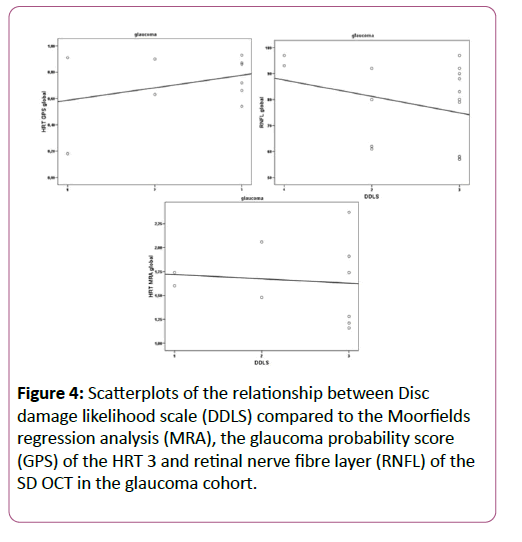
Figure 4: Scatterplots of the relationship between Disc damage likelihood scale (DDLS) compared to the Moorfields regression analysis (MRA), the glaucoma probability score (GPS) of the HRT 3 and retinal nerve fibre layer (RNFL) of the SD OCT in the glaucoma cohort.
DDLS did not show a significant correlation with MRA (p=0.108), glaucoma probability score analysis (p=0.108) and RNFL (p=0.447).
Referring to diagnosis 2 (“borderline or outside normal limits”)
DDLS did not correlate significantly with MRA (p=0.072), glaucoma probability score analysis (p=0.108) and RNFL (p=0.064). No significant correlation between DDLS Grading 0-4 and R. Burk (p=0.508) and F.S. Mikelberg coefficient (p=0.850) was found.
Using the area under the curve (ROC) comparing R.Burk and F.S. Mikelberg coefficient and DDLS for Diagnosis 1+2, the DDLS had the best predictive power in comparison to HRT 3 and OCT apart from the MRA Diagnosis 2 results (Table 3 and Figure 5).
| |
|
FSM |
RB |
DDLS |
| Diagnosis1_MRA |
Area |
0.1 |
0.227 |
0.785 |
| Std. Error |
0.063 |
0.102 |
0.099 |
| Diagnosis2_MRA |
Area |
0.05 |
0.142 |
0.733 |
| Std. Error |
0.041 |
0.078 |
0.109 |
| Diagnosis1_GPS |
Area |
0.223 |
0.246 |
0.669 |
| Std. Error |
0.106 |
0.103 |
0.115 |
| Diagnosis2_GPS |
Area |
0.208 |
0.25 |
0.8 |
| Std. Error |
0.096 |
0.101 |
0.091 |
| Diagnosis1_OCT |
Area |
0.619 |
0.595 |
0.833 |
| Std. Error |
0.139 |
0.175 |
0.098 |
| Diagnosis2_OCT |
Area |
0.411 |
0.464 |
0.732 |
| Std. Error |
0.118 |
0.12 |
0.119 |
Table 3: Value of area under the curve for ROC for F S Mikelberg coeffiecient (FSM), R Burk coefficient (RB), Disc damage likelihood scale (DDLS) considering Diagnosis 1 and 2 (MRA-Moorfields Regression Analysis, GPS-Glaucoma Probability Score, OCT-Optic Coherence Tomography).
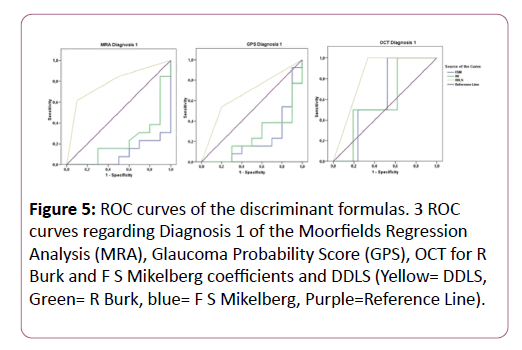
Figure 5: ROC curves of the discriminant formulas. 3 ROC curves regarding Diagnosis 1 of the Moorfields Regression Analysis (MRA), Glaucoma Probability Score (GPS), OCT for R Burk and F S Mikelberg coefficients and DDLS (Yellow= DDLS, Green= R Burk, blue= F S Mikelberg, Purple=Reference Line).
Discussion
Paediatric glaucoma is a severe disease with high intraocular pressure peaks and wide diurnal variations [17]. Paediatric glaucoma showed characteristics that differ compared to the primary open angle glaucoma (POAG) in adults. For example, cup reversal, topographic improvement of the optic disc after glaucoma therapy, and different genetic mutations can be observed in paediatric but not POAG glaucoma [21-23]. The most difficult diagnostic process is to detect beginning glaucomatous changes in children before irreversible damage occurs. To improve the clinical management of paediatric glaucoma various diagnostic tools were described using the analysis of perimetry, IOP devices, fundus photography, optical coherence tomography, HRT and funduscopy [8,9,11,24-27]. Larsson et al. stated that HRT could be used in children between 5 and 16 years of age [24]. Children of this study fell within this age range. Additionally, the SD-OCT showed reliable results of RNFL and retinal layer thickness in children up to 5 years [10]. Another approach to assess early glaucomatous changes is the estimate of circumpapillary and macular retinal ganglion cell counts which enable us to discriminate different stages of glaucoma [26]. However, all the established devices rely on normative databases, which did not include morphological differences and age related alterations of children.
This study presented the first objectively measured DDLS compared to both widely used glaucoma diagnostic tools SD-OCT and HRT3 in children. Before an objective analysis was developed determination of the CDR and the DDLS stage was made by using a slit lamp examination with a 66-90 dpt. Lens [6,13].
Stereometric parameters
We found a significant difference in the disc area evaluation of the KOWA camera compared to the HRT 3 in the healthy subjects and glaucoma suspects (p=0.01). In the paediatric glaucoma cohort the difference did not show statistically significance (p=0.80). Januschowsky et al. found a significant mean difference of the disc area between KOWA and HRT III of 0.33 mm2 in adult normal and glaucomatous subjects [28]. In contrast, the findings in this paediatric study outreached the results of Januschowsky (mean differences 0.8 mm2 in healthy eyes and 0.87 mm2 in glaucoma suspects), which might be due to the different magnifying factor of the HRT and KOWA camera. However, the disc area of KOWA and HRT was closely related (mean difference 0.04 mm2) in glaucoma patients. This relationship of KOWA and HRT in manifest glaucoma, in contrast to the difference in glaucoma suspects, may be used for observing progression in manifest glaucoma. Population-based studies using fundus photography have found that the area of the ONH ranged from 2.09 to 2.94 mm2 [18,29].
Furthermore Januschowsky´s results showed a mean difference of the cup volume of 0.03 mm3 in normal adults compared to the mean difference of 0.06 mm3 in healthy children [28]. In glaucomatous eyes the mean difference of the cup volume was 0.08 mm3 in adults and 0.07 mm3 in children (Table 1). So the measurements showed a closer congruence in manifest glaucoma between adults and children. No age matched analysis was found for comparative statistics in a paediatric cohort.
Glaucoma diagnostics
In this study the DDLS showed no statistically significant correlation in all three study cohorts compared to glaucoma probability score, Moorfields regression analysis and RNFL. It is known that children may have morphologic abnormalities of the optic nerve [24,30]. These abnormalities do not cause visual acuity or functional decreases, but might be the reason for the missing correlation [30]. According to the correlation between the disc damage likelihood scale and R. Burk and F.S. Mikelberg coefficient, no statistical significance was present.
In paediatric glaucoma a significant correlation of the glaucoma probability score compared to KOWA rim/disc ratio was found in all six quadrants (Table 2). Strikingly the only strong correlation that was found was between the KOWA rim/disc ratio and the only parameter of the HRT that does not depend on disc size, GPS. As GPS is determined automatically, the question arises, how much the subjective examiner input is influencing the outcome of detecting glaucomatous damage in children.
Regarding the area under the ROC curve the highest predictive power was demonstrated by the objectively measured DDLS (0.669-0.833) in comparison to R.Burk (0.142-0.595) and F.S. Mikelberg (0.050-0.619) coefficients considering all devices (Table 3 and Figure 5). There were no comparative studies in children regarding ROC curves after an extensive pubmed research. Majid et al. stated following results for the subjectively obtained DDLS in adults. In POAG, the DDLS had the best predictive power (0.917), followed by the PSD (0.895) and RNFL (0.864) [31]. Danesh Meyer stated that the subjective DDLS (area under the curve 0.95) had the best predictive power, followed by the clinical examination of C/D ratio (0.84), and HRT-II Moorfields analysis (0.68) [20]. The predictive values reached higher levels in the comparative studies than our results. According to the known difficulties in diagnosing paediatric glaucoma the objectively measured DDLS seemed to be an effective additional tool.
As a limitation of our study it must be addressed that there is still no gold standard of objective parameters to detect glaucoma disease in children [32]. To reduce this bias in our study the optic nerve head was defined in healthy eyes, suspects or glaucomatous eyes before recruitment and the objective diagnostic analysis. Additionally, reliable visual field testing in children is based on a certain age. The mean age of our study cohort was 11-12 years, so we could report about generally reproducible visual field tests. Already El Dairi et al. stated that in the absence of reliable visual field data on many children with suspected or known glaucoma, ONH cup evaluation was essential for determining the presence and severity of glaucoma [32]. Further limitation of the present study could be the missing differentiation of the impact of birth weight, length, head circumference and sex of term infants on the optic nerve head parameters and their future risk on developing a glaucomatous damage [15,33,34]. We excluded preterm children as they exhibit different characteristics of optic nerve head parameters (increased rim volume, smaller cup shape, increased height variation contour, increased cup depth) with HRT III analysis [35].
Conclusion
In conclusion, studies have shown that OCT and HRT could distinguish between glaucomatous damage and healthy optic nerve heads in children. The objectively measured DDLS showed the highest predictive power for glaucomatous damage compared to Mikelberg and Burk coefficients in the established devices. Further studies seem to be sensible to use the KOWA camera for diagnosis of childhood glaucoma. In addition to the optic disc analysis with HRT and OCT, the gold standard of ONH assessment does still include the examination of the fundus photography. As stereophotography is an easy and timesaving instrument, it might be an additive, helpful tool in diagnosis and follow-up of paediatric glaucoma.
Declarations
Ethics approval: This prospective study was completed under the agreement of the ethical committee of the Charité university medicine, Berlin. The criteria of the declaration of Helsinki were fulfilled.
Consent for publication: Written consent of all patients was obtained; three different versions of agreement forms for different ages were provided and a form for the parents/ caretakers to sign it. Children of any age could understand the meaning and consequences of conducting in this study, however, all parents/guardians also signed the consent form. All consent forms were approved by the ethical committee of the Charite university medicine, Berlin.
Availability of data and materials: All data generated or analysed during this study are included in this published article. The rest of datasets generated during and/or analysed during the current study are not publicly available due but are available from the corresponding author on reasonable request.
Competing interests: No financial interest is reported by any of the authors.
Authors' contributions: MP is the corresponding author, a major contributor in planning the study setting, examining the children and writing the manuscript. A-K MW, NT, MK, EB and SW collected, analysed and interpreted the patient data regarding healthy and glaucoma patients. CE interpreted glaucomatous changes and was involved in the setup of this study (inclusion, exclusion criteria). All authors read and approved the final manuscript.
References
- Jaffe GJ, Caprioli J (2004) Optical coherence tomography to detect and manage retinal disease and glaucoma. Am J Ophthalmol 137: 1.
- Mikelberg FS, Parfitt CM, Swindale NV, Graham SL, Drance SM et al (1995) Ability of the Heidelberg retina tomograph to detect early glaucomatous visual field loss. J Glaucoma 4.
- Burk RO,Noack H, Rohrschneider K (1999) Prediction of glaucomatous visual field defects by reference plane independent three-dimensional optic nerve head parameters. In: Wall M, Wild JM eds. Perimetry Update 1998/1999: Proceedings of the XIIIth International Perimetric Society Meeting. Gardone Riviera (BS), Italy, September 6–9, 1998. The Hague, Netherlands. Kugler 1999.
- Chen TC, Cense B, Pierce MC, Nassif N, Park BH, et al. (2005) Spectral domain optical coherence tomography: ultra-high speed, ultra-high resolution ophthalmic imaging. Arch Ophthalmol 123: 12.
- Roberti G, Centofanti M, Oddone F, Tanga L, Michelessi M, et al. (2014) Comparing optic nerve head analysis between confocal scanning laser ophthalmoscopy and spectral domain optical coherence tomography. Curr Eye Res 39:10.
- Spaeth GL, Henderer J, Liu C (2002) The disc damage likelihood scale: reproducibility of a new method of estimating the amount of optic nerve damage caused by glaucoma. Trans Am Ophthalmol Soc100: 185-186.
- Gilbert C, Foster A (2001) Childhood blindness in the context of VISION 2020—The Right to Sight. Bull World Health Organ 79.
- Alasil T, Wang K, Keane PA, Lee H, Baniasadi N et al (2013) Analysis of normal retinal nerve fiber layer thickness by age, sex, and race using spectral domain optical coherence tomography. J Glaucoma 22: 7.
- Ghasia FF, Freedman SF, Rajani A, Holgado S, Asrani S et al (2013)Optical coherence tomography in paediatric glaucoma: time domain versus spectral domain. Br J Ophthalmol 97: 7.
- Yanni SE, Wang J, Cheng CS (2013): Normative reference ranges for the retinal nerve fiber layer, macula and retinal layer thicknesses in children. Am J Ophthalmol 155: 2.e1.
- Loon SC, Tong L, Gazzard G (2011) The use of HRT with and without the aid of disc photographs. J Glaucoma 20: 4.
- Park HY, Kim SE, Park CK (2015)Optic Disc Change during Childhood Myopic Shift: Comparison between Eyes with an Enlarged Cup-To-Disc Ratio and Childhood Glaucoma Compared to Normal Myopic Eyes. PLoS One 10: 7.
- Bayer A, Harasymowycz P, Henderer JD, Steinmann WG, Spaeth GL (2002) Validity of a new disk grading scale for estimating glaucomatous damage: Correlation with visual field damage. Am J Ophthalmol 133.
- Danesh-Meyer HV, Ku JYF, Papchenko TL, Jayasundera T, Hsiang JC. et al. (2006) Regional Correlation of Structure and Function in Glaucoma, Using the Disc Damage Likelihood Scale, Heidelberg Retina Tomograph and Visual Fields. Ophthalmology 113.
- Huynh SC, Wang XY, Rochtchina E, Crowston JG, Mitchell Pl (2006)Distribution of optic disc parameters measured by OCT: findings from a population-based study of 6-year-old Australian children. Invest Ophthalmol Vis Sci 47: 8.
- Jonas JB, Schmidt AM, Müller-Bergh JA, Schlötzer-Schrehardt UM, Naumann GO (1992) Human optic nerve fibre count and optic disc size. Invest Ophthalmol Vis Sci 33.
- Park SC, Kee C (2007) Large diurnal variation of intraocular pressure despite maximal medical treatment in juvenile open angle glaucomaSee comment in PubMed Commons below J Glaucoma 16: 1.
- Yokoyama Y, Tanito M, Nitta K, Katai M, Kitaoka Y, et al. (2014) Stereoscopic analysis of optic nerve head parameters in primary open angle glaucoma: the glaucoma stereo analysis study. PLoS One 9: 6.
- Webb RH, Hughes GW, Delori FC (1987) confocal scanning laser ophthalmoscope. Applied Optics 26: 8.
- Danesh-Meyer HV, Gaskin BJ, Jayusundera T, Donaldson M, Gamble GD (2006) Comparison of disc damage likelihood scale, cup to disc ratio, and Heidelberg retina tomograph in the diagnosis of glaucoma. Br J Ophthalmol 90.
- Elgin U, Ozturk F, Sen E, Sendar K (2010) Comparison of optic disc topography before and after antiglaucoma treatment in juvenile glaucoma. Eur J Ophthalmol 20: 5.
- Turalba AV, Chen TC (2008) Clinical and genetic characteristics of primary juvenile-onset open-angle glaucoma (JOAG). SeminOphthalmol 23: 1.
- Ely AL, El-Dairi MA, Freedman SF (2014) Cupping reversal in pediatric glaucoma- evaluation of the retinal nerve fiber layer and visual field. Am J Ophthalmol 158: 5.
- Larsson E, Nuija E, Alm A (2011) The optic nerve head assessed with HRT in 5-16-year-old normal children: normal values, repeatability and interocular difference. Acta Ophthalmol 89: 8.
- Maldonado RS, Izatt JA, Sarin N, Wallace DK, Freedman S et al (2010): Optimizing hand-held spectral domain optical coherence tomography imaging for neonates, infants, and children. Invest Ophthalmol Vis Sci51: 5.
- Distante P, Lombardo S, VerticchioVercellin AC, Raimondi M, Rolando M et al (2015) Structure/Function relationship and retinal ganglion cells counts to discriminate glaucomatous damages. BMC Ophthalmol 29: 15.
- Krzyżanowska-Berkowska P, Asejczyk-Widlicka M, Pierscionek B (2012) Intraocular pressure in a cohort of healthy eastern European schoolchildren:variations in method and corneal thickness. BMC Ophthalmol . 2: 12.
- Januschowski K, Blumenstock G, Rayford II CE, Bartz-Schmidt KU, Schiefer U, et al. (2011) Stereometrische Parameter der Papillentopographie: Vergleich einer simultan-stereoskopischen Non-Mydriasis-Funduskamera (KOWA WX 3D) mitdem Heidelberg Retina Tomograph (HRT III). Ophthalmol oge 108.
- Varma R, Tielsch JM, Quigley HA, Hilton SC, Katz J, et al. (1994) Race, age, gender and refractive error-related differences in the normal optic disc. Arch Ophthalmol 112.
- Ruberto G, Angeli R, Tinelli C, Bianchi PE, Milano G (2014) Morphologic and functional analysis of the optic nerve in premature and term children with OCT, HRT, and pVEP: a 10-year resurvey. Invest Ophthalmol Vis Sci. 15: 54-55.
- Majid AS, Kwag JH, Jung SH, Yim HB, Kim YD,et al. (2010) Correlation between disc damage likelihood scale and optical coherence tomography in the diagnosis of glaucoma. Ophthalmol ogica 224: 5.
- El-Dairi MA, Holgado S, Asrani SG, Enyedi LB, Freedman SF (2009) Correlation between optical coherence tomography and glaucomatous optic nerve head damage in children. Br J Ophthalmol 93: 10.
- Kandasamy Y, Smith R, Wright IM, Hartley L (2012) Optic disc measurements in full term infants. Br J Ophthalmol 96: 5.
- Samarawickrama C, Huynh SC, Liew G, Burlutsky G, Mitchell P (2009) Birth weight and optic nerve head parameters. Ophthalmology 116: 6.
- Alshaarawi S, Shatriah I, Zunaina E, Wan Hitam WH (2014) Assessment of the optic nerve head parameters using Heidelberg retinal tomography III in preterm children. PLoS One. 13: 2-9.