Elena Bogova*, Natalya Volevodz, Valentina Peterkova and Ilin Alexander
Endocrinology Research Centre, Institute of Pediatric Endocrinology, Moscow, Russian Federation
*Corresponding Author:
Elena Bogova
Endocrinology Research Centre, Institute of Pediatric Endocrinology
Moscow, Russian Federation
Tel: +7-925-882-05-48
E-mail: eabogova@gmail.com
Received date: June 10, 2017; Accepted date: July 31, 2017; Published date: August 03, 2017
Citation: Elena Bogova, Natalya Volevodz, Valentina Peterkova, Ilin Alexander (2017) Metabolic Parameters and Orexigenic/Anorexigenic Factors of Obesity in Prader-Willi Syndrome. J Child Obes Vol No 2 Iss No: 3:13 doi: 10.21767/2572-5394.100034
Copyright: © 2017 Elena Bogova. This is an open-access article distributed under the terms of the Creative Commons Attribution License, which permits unrestricted use, distribution, and reproduction in any medium, provided the original author and source are credited.
Introduction
Prader-Willi syndrome (PWS) is a complex multisystem genetic disorder that arises from lack of expression of paternally inherited imprinted genes on chromosome 15 [1]. PWS is the most frequent cause of syndromic obesity occurring in 1 out of 10000–30 000 live births [2]. It is a neurodevelopmental disorder, characterized by neonatal hypotonia and failure to thrive, followed by a rapid weight gain between the ages of 1 and 6 years, leading most PWS subjects to develop morbid obesity and therefore premature mortality from its complications. The PWS phenotype includes multiple characteristics, most of which are central of origin (temperature dysregulation, high pain threshold, behavioral abnormalities, hypothalamic hypogonadism, growth hormone deficiency, central hypothyroidism, central adrenal insufficiency). Obesity, mostly due to an insatiable appetite, represents one of the most serious symptoms of PWS, leading to develop premature mortality from its complications. Therefore, we tried to investigate more deeply distinctive features of obesity and appetite regulation in PWS patients.
We evaluated metabolic parameters of obese children with genetically confirmed PWS who were non-treated with growth hormone (GH) and compared the data with age, sex and BMImatched non-PWS obese controls (OC). We also measured levels orexigenic (increasing appetite) and anorexigenic factors (decreasing appetite) to understand their role in PWS. It is assumed, that ‘PWS region' (15q11-q13) contains genes, which are overly expressed in the hypothalamus and encode for proteins critical to brain development, function and also the appetite regulation. The mechanism of satiety/hunger is under neuroendocrine control of central and peripheral peptides (Figure 1).
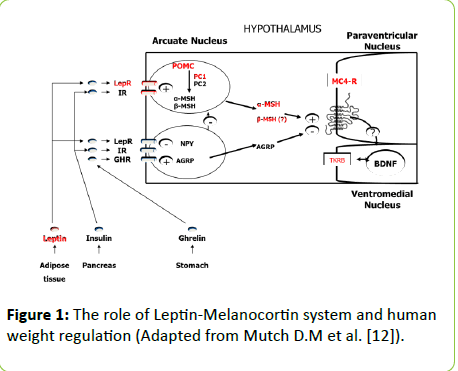
Figure 1: The role of Leptin-Melanocortin system and human weight regulation (Adapted from Mutch D.M et al. [12]).
Subjects and Methods
17 obese (BMI SDS=3,66 [2.99 ÷ 4.57]) non-treated with GH children with PWS (6 boys, 11 girls) at a median age of 9,9 years [6.5 ÷ 13,9] were compared with 15 obese children (OC) of similar age (9.8 [6.5 ÷ 12.0] years), gender (4 boys, 11 girls) and BMI (3.21 [2.76 ÷ 3.62] SDS). All children included in the study were pre-pubertal (Tanner stage 1).
PWS patients were genetically confirmed (methylationspecific PCR). Subjects with chronic secondary illnesses such as diabetes mellitus, liver or kidney disease or active malignancy, or those taking investigational drugs were excluded. Subject characteristics and comparisons are shown in Table 1.
| Characteristics |
PWS (n=17) |
ÞC (n=15) |
p |
| Age (years) |
9.9 [6.5 ÷ 13.9] |
9.8 [6.5 ÷ 12.0] |
p=0.82 |
| Males/females |
06-Nov |
04-Nov |
p=0.85 |
| Tanner stage |
1 |
1 |
p=0.4 |
| SDS BMI |
3.66 [2.99 ÷ 4.57] |
3.21 [2.76 ÷ 3.62] |
p=0.2 |
| SDS height |
-0.02 [-1.29 ÷ 0.49] |
1.74 [1.06 ÷ 2.65] |
p=0.0001* |
| Fat mass (%) |
53.05 [48.75 ÷ 56.5] |
42.2 [40.5 ÷ 45.0] |
|
| Lean mass (%) |
46.95 [43.5 ÷ 51.25] |
57.8 [55.0 ÷ 59.5] |
|
Table 1: Characteristics of PWS and OC.
Physical examination included determination of height and weight. Standing height was determined by a Harpenden Stadiometer (Holtain Limited, Crymych, Dyfed, UK).
Body weight was measured to the nearest 0.1 kg, by using a standard equipment. BMI was defined as weight in kilograms divided by the square of height in meters. Standards for age- and gender-specific height (Tanner J.M, Whitehouse R.H, 1976) and BMI percentiles (Cole T.J., 2000) were used for a calculating standard deviation score (SDS) as well as for classifying the children as non-obese (BMI<2.0 SDS) or obese (BMI>2.0 SDS).
All blood samples were collected in the morning after a 12-h overnight fast. Laboratory measurements included serum glucose, leptin, insulin, insulin-like growth factor 1 (IGF-1), lipids (total cholesterol, high-density lipoprotein (HDL), low-density lipoprotein (LDL), triglycerides), aspartate aminotransferase (AST), alanine aminotransferase (ALT), fasting and postprandial serum brain-derived neurotrophic factor (BDNF) and plasma ghrelin. Insulin and IGF-1 concentration was measured by chemiluminescent immunometric assay, using Cobas 6000 (Roche) and Liaison (Dia Sorin) analyzers. Leptin levels were determined by enzyme immunoassay using. Homeostasis model insulin resistance index (HOMA-IR) was calculated using fasting insulin and glucose concentrations (fasting glucose x fasting insulin/22,5). Fasting and postprandial (on 60 min and 120 min) plasma total ghrelin and serum BDNF levels were measured during mixed meal testing (370 kcal: 20% protein, 50% carbohydrate and 30% fat), using commercial enzyme immunoassay kits (Phoenix Pharmaceuticals inc. and R&D systems). Blood samples for ghrelin evaluation were collected in EDTA-containing vacutainer tubes with aprotinin and stored at 70 C up to 1 month.
Body composition was evaluated by dual-energy X-ray absorptiometry (DEXA).
Statistical analyses were performed by using Statistica for Windows v.8.0. Data are presented as the median and interquartile range. Manne-Whitney test used for comparing 2 groups. P values at the standard 0.05 level were used to determine the statistical significance.
Results
The details of the patients’ measurements are described in Table 2.
| Characteristics |
PWS (n=17) |
C (n=15) |
p |
| Leptin (ng/ml) |
85.05 [43.7 ÷ 117.45] |
37.2 [27.7 ÷ 44.90] |
|
| IGF-1 (ng/ml) |
84.5 [52.7 ÷ 173.3] |
238.2 [221.9 ÷ 323.8] |
p=0.0003* |
| Insulin (U/l) |
9.7 [5.4 ÷ 15.45] |
12.6 [8.2 ÷ 18.5] |
p=0.38 |
| Glucose (mmol/l) |
4.55 [4.0 ÷ 5.0] |
4.75 [4.2 ÷ 5.1] |
p=0.37 |
| HOMA-IR |
1.44 [1.04 ÷ 2.05] |
2.74 [1.9 ÷ 3.95] |
p=0.01* |
| Cholesterol total (mmol/l) |
4.9 [4.3 ÷ 5.6] |
4.06 [3.7 ÷ 5.1] |
p=0.08 |
| LDL (mmol/l) |
3.18 [2.45 ÷ 4.0] |
2.8 [2.0 ÷ 3.1] |
p=0.13 |
| HDL(mmol/l) |
1.1 [0.87 ÷ 1.5] |
0.97 [0.88 ÷ 1.2] |
p=0.42 |
| Triglycerides (mmol/l) |
0.8 [0.7 ÷ 1.1] |
1.05 [0.95 ÷ 1.25] |
p=0.07 |
| ÃÂÂÂÂÂÂÂLT (U/l) |
25.75 [18.0 ÷ 42.7] |
18.15 [18.0 ÷ 22.0] |
p =0.1 |
| ÃÂÂÂÂÂÂÂST (U/l) |
27.0 [24.5 ÷ 36.15] |
23.5 [21.0 ÷ 25.0] |
p=0.05 |
Table 2: Measurements of PWS and OC.
When compared to OC, PWS children of similar age, sex and BMI had lower height SDS (-0.02 [0.49 ÷ 1.78] vs. 1.74 [1.06 ÷ 2.65], p=0.0001) and IGF-1 levels (84.5 [52.7 ÷ 173.30]) vs. (238.2 [221.9 ÷ 323.8], p=0.0003). Body composition studies showed increased body fat in PWS children in comparison with control group of OC (53.05 [48.75 ÷ 56.5] vs. 42.2 [40.5 ÷ 45.0]%, respectively), and decreased lean mass (46.35 [42.7 ÷ 49.85] vs. 57.80 [55.0 ÷ 59.5]%,. Relative to OC, leptin levels were nearly 2-fold higher in PWS (85.05 [43.7 ÷ 117.45] vs. 37.2 [27.7 ÷ 44.9] ng/ml, in contrast, there were no significant differences in total cholesterol, high-density lipoprotein (HDL), low-density lipoprotein (LDL), triglycerides, AST, ALT levels between two groups. HOMA-IR was lower in PWS compared with OC (1.44 [1.04 ÷ 2.05] vs. 2.74 [1.9 ÷ 3.95], p=0.01), suggesting that PWS children are more insulin sensitive.
Fasting ghrelin concentration (1.0 [0.5 ÷ 1.0] vs. 0.23 [0.13 ÷ 0.30] ng/ml, and postprandial ghrelin levels on 60 and 120 min (0.47 [0.4÷1.0] vs. 0.18 [0.11 ÷ 0.31], p=0.00039 and 0.5 [0.37 ÷ 1.0] vs. 0.14 [0.11 ÷ 0.28] ng/ml, p=0.000025) were significantly higher in PWS children in comparison with OC (Figure 2).
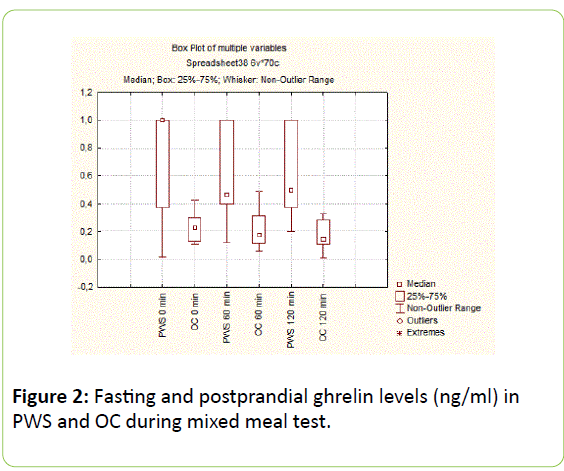
Figure 2: Fasting and postprandial ghrelin levels (ng/ml) in PWS and OC during mixed meal test.
There were no significant differences in basal (22.8 [15.7 ÷ 29.19] vs. 18.42 [10.40 ÷ 28.50] ng/ml, p=0.54) and postprandial anorexigenic BDNF levels on 60 and 120 min between PWS and OC (27.7 [21.4 ÷ 30.27] vs. 22.53 [13.02÷26.20], p=0.43 and 24.62 [18.56 ÷ 27.75] vs. 17.53 [11.08 ÷ 25.50] ng/ml, p=0.21) (Figure 3).
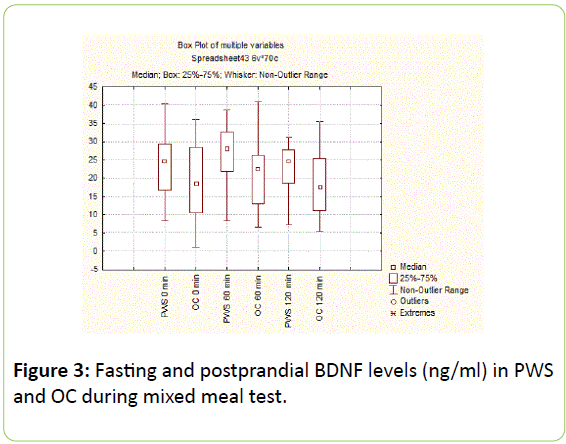
Figure 3: Fasting and postprandial ghrelin levels (ng/ml) in PWS and OC during mixed meal test.
Discussion
We measured the levels of orexigenic (ghrelin) and anorexigenic factors (leptin, BDNF) in children with PWS and OC with “simple obesity”. PWS patients showed higher fasting and postprandial levels of ghrelin than OC, that might contribute to their hyperphagia and high level of adiposity. Ghrelin is the only known peripheral orexigenic peptide, that stimulates food intake, adipose tissue lipogenesis and inhibits lipid oxidation. It is produced primarily in the stomach and is thought to be a meal initiator: its concentration rises before feeding and decreases to a minimum one-hour after eating. Elevated ghrelin concentrations in PWS patients have been reported in previous studies [3,4], but the results in children are controversial [5,6]. The cause of hyperghrelinemia in PWS is unclear. There are data, suggesting that PWS patients have the increased number of ghrelin-expressing cells in gastric tissue [7]. In addition, relative hypoinsulinemia and/or increase in insulin sensitivity may act as an additive signal to enhance hyperghrelinemia in PWS (as insulin has an inhibitory role on ghrelin secretion) [8]. In our study we found that insulin sensitive index HOMA was higher in patients with PWS than in OC. Proposed reasons for increased insulin sensitivity in PWS include relative lower amounts of visceral fat and growth hormone deficiency. In turn, hyperghrelinemia can promote the different glucoregulatory mechanisms in PWS patients (decreased insulin secretion and increased insulin sensitivity) [9].
The concentration of anorexigenic hormone leptin was higher in patients with PWS in comparison with OC. As is known, leptin is secreted from fat cells (adipocytes) in direct proportion to the amount of stored fat. Therefore, the observed hyperleptinemia reflects the high level of adiposity in patients with PWS [10]. Body composition study showed increased body fat and decreased lean mass in PWS children in comparison with OC, which in combination with short stature and low IGF-1 suggests that PWS patients are growth hormone deficient.
The brain-derived neurotrophic factor (BDNF) is a central anorexigenic factor, known to influence growth, development and survival of neurons and appears to function downstream of the leptin-melanocortin signaling pathway to control appetite (Figure 1). In both animals and humans, diminished BDNF function is associated with hyperphagia and obesity. Hunger suppresses BDNF gene expression in the hypothalamus, whereas feeding does the opposite. BDNF is produced mainly by central nervous system and platelets serve as a reservoir. BDNF peripheral circulation is believed to reflect cerebral BDNF output [11]. We didn’t find any difference in the levels of fasting and postpransial BDNF between PWS and OC. However, in the work by Joan C. Han et al. PWS children had lower peripheral BDNF compared to OC, and the authors concluded that BDNF insufficiency could be the potential cause for PWS hyperphagia [12]. The difference in BDNF levels between studies could be associated with leptin content. Leptin levels were similar between PWS and OC in Joan C. Han study in contrast with the observed hyperleptinemia in PWS children in our work. It is known that leptin activates hypothalamic BDNF-expression, so not decreased levels of BDNF in our group of PWS patients could be coneÑÂÂÂÂted with high leptin content, reflecting their adiposity.
Various peptides and hormones have been studied in patients with PWS, but still there is no precise concern about the mechanism of PWS hyperphagia. Probably not one, but many factors could play a role in heightened appetite of PWS patients.
Conclusions
Observed PWS children have short stature, low IGF-1 levels and abnormal body composition with increased body fat and decreased lean body mass, resembling patients with growth hormone deficiency. Leptin levels in PWS children are higher than in OC, reflecting the degree of adiposity. HOMA-IR was lower in PWS compared with OC, suggesting that children with PWS are more insulin sensitive than patients with «simple obesity». This could suggest a different role of insulin in the pathogenesis of metabolic alterations in PWS as compared to simple obesity. Fasting and postprandial orexigenic ghrelin levels are significantly higher in PWS children compared to obese controls, indicating the presence of intrinsic hyperphagia in patients with this syndrome. There are no significant differences in basal and postprandial anorexigenic BDNF levels between PWS children and OC, however further research is needed to clarify the role of BDNF and its receptor in weight reduction, energy expenditure, and appetite control in PWS.
References
- Abdilla Y, Andria Barbara M, Calleja-Agius J (2017) Prader-Willi syndrome: Background and m anagement. Neonatal Netw. 1: 134-141.
- Cassidy SB, Schwartz S, Milller JL, Driscoll DJ (2012) Prader-Willi syndrome. Genet Med.14:10-26.
- Cummings DE, Clement K, Purnell JQ, Vaisse C, Foster KE, et al. (2002) Elevated plasma ghrelin levels in Prader–Willi syndrome. Nat Med. 8: 643-644.
- Goldstone AP, Patterson M, Kalingag N, Ghatei MA, Brynes AE, et al. (2005) Fasting and postprandial hyperghrelinemia in Prader–Willi syndrome is partially explained by hypoinsulinemia, and is not due to peptide YY3-36 deficiency or seen in hypothalamic obesity due to craniopharyngioma. J Clin Endocr Metab. 90: 2681–2690.
- Erdie-Lalena CR, Holm VA, Kelly PC, Frayo RS, Cummings DE (2006) Ghrelin levels in young children with Prader–Willi syndrome. J Pediatr. 149:199–204.
- Butler MG, Bittel DC (2007) Plasma obestatin and ghrelin levels in subjects with Prader–Willi syndrome. Am J Med Genet A. 143: 415–421.
- Choe YH, Song SY, Paik KH, Oh YJ, Chu SH, et al. (2005) Increased density of ghrelin-expressing cells in the gastric fundus and body in Prader-Willi syndrome. J Clin Endocr Metab. 90: 5441-5445.
- Paik KH, Lee MK, Jin DK, Kang HW, Lee KH, et al. (2007) Marked suppression of ghrelin concentration by insulin in Prader-Willi syndrome. J Korean Med Sci. 22:177-182.
- Heppner KM, Tong J, Kirchner H, Nass R, Tschöp MH (2011) The ghrelin O-acyltransferase-ghrelin system: A novel regulator of glucose metabolism. Curr Opin Endocrinol Diabetes Obes.18: 50-55.
- Woods SC (2004) Gastrointestinal Satiety Signals I. An overview of gastrointestinal signals that influence food intake Am J Physiol Gastrointest Liver Physiol. 286: 7-13.
- Han JC, Muehlbauer MJ, Cui HN, NewgardCB, HaqqAM (2010) Lower Brain-Derived Neurotrophic Factor in Patients with Prader-Willi Syndrome Compared to Obese and Lean Control Subjects. J Clin Endocrinol Metab. 95: 3532–3536.
- Mutch DM, Clément K (2006) Unraveling the Genetics of Human Obesity. PLoS Genet. 2: e188.