Keywords
Total Factor Productivity, Agricultural Sector, Growth Accounting Model
Introduction
One of the fundamental questions that arises in all economies this is how much of their economic growth to the
growth of the primary factors of production like physical and human capital and how much it is due to factors such
as technological changes and the foundation. Although about positive effects of physical and human capital on
economic growth there is consensus between economists but high economic growth most economists know
dependent to technological changes and the foundation. Assuming constant returns towards scale and competitive
labor market can be achieved diversion rate of economic growth of total physical and human capital growth rate.
This (TFP) deviation shows that technological change and the foundation, called total factor productivity. In last few
decades there have been numerous studies on agricultural development all over the county in various academic
disciplines. But most studies skip any pin-pointed definition of agricultural development.
In Iran, agricultural sector is one of the sectors which its value added share in non oil value added was changed
following changes in oil incomes such that during the first oil shock (1974-1977), the share of this sector has
decreased to 12.6 percent from 19.2 percent in non oil GDP. The export of traditional and agricultural products is as
one of the main pillars in non oil export so that during 1961-1965 agricultural export has climbed continuously and
during 1973-1978 domestic demand has increased strongly due to increasing oil incomes and the unprecedented
growth and in this period agricultural export has negative grown and from 505.1 million dollars in 1973 reached to 367.9 million dollars in 1978 year1. In during 1980-1988 agricultural export growth was low because of terms of
revolution and war and various boycotts economic. The export of traditional and agricultural products from 770
million dollars in 1988 reached to 2516 million dollars in 1993 so that being included over 70 percent of total non
oil export and during third-year development plans the export of traditional and agricultural products from 1463.2
million dollars in 2000 reached to 1892 million dollars in 2004 due to favorable weather conditions, supportive
government policies and rising oil incomes. In during 1968-1977 export in services sector has climbed but during
1979-1988 has climbed down due to terms of revolution and war and various boycotts economic and during 1995-
1998 has climbed to 2023 million dollars in 1998 and also during 2000-2006 has climbed from 2012.17 million
dollars in 2000 reached to 8554 million dollars in 2006 due to rising oil price. Generally, from the Islamic
Revolution to 1990 (except 1988) value added in only agriculture sector has had always uptrend, especially in 1985-
1988 years agricultural sector has had an effective role to prevent increasing economic recession while more
economic sectors have had negative growth because there was war Problems and shortages of raw materials and
economic recession society. Share of services value added sector have decreased during the period 1982-1990 from
58.3% in 1982 to 50.9% in 1990 year. In 2004 services value added sector has reached the highest growth (8.1%
growth) during these few years and has increased to 51.7%.
According to table 1, average annual growth rate of total factor productivity agricultural sector during the third
programs fourth and fifth before the Islamic Revolution, respectively was -3.3 ,2.9 , --5.2 percent while the average
during the revolution and war, programs first, second, third and the first two years fourth Development Plan
respectively, has been 2.6, 4.11, 0.2, 0.5, 2.9 percent. In other words, average annual growth rate of total factor
productivity agricultural sector during the periods 1342-1356 and 1357-1385 respectively, has been 4.7-and 2
percent, that is the result of disproportion significant growth in capital stock with value added growth in during
construction programs before the Islamic Revolution. Because by doing land reform and lack of replacement
efficient management instead lord and rural practices, disproportion value added growth with the growth of
production inputs caused and thus has led to negative growth of total factor productivity in the agricultural sector
during period 1342-1356 [1].
Table 1: Average growth in the agricultural sector of Iran's economy in the years 1342 to 1385
The composition of the Iranian GDP after the revolution has changed significantly. The agricultural growth rates are
presented in Figure 1. During the pre-revolution period (1960-1978), the agricultural sector had an average growth rate
of approximately 4.4 percent per annum. During the ten years following the revolution, the agricultural sector grew
by approximately 4.3 percent annually. This shows that although the Iranian economy as a whole was affected very
negatively by the war, the agricultural sector was less seriously affected than other sectors of the economy.
Following the cease fire, the agricultural sector had an annual growth rate of 6.4 percent over the length of the first
Five-year Economic Development Plan (FYDP2). During the second FYDP (1995-1999), however, a serious and
dramatic reduction in the amount of rainfall caused the average growth rate in the agricultural sector to fall to 2.2
percent, far below its target of 4.3 percent growth and During the 3th FYDP (2000-2004), the agricultural sector had an annual growth rate of 4.4 percent (Central bank of Iran). The agricultural sector enjoyed an average annual
growth rate of 4.3 percent during the whole period after the revolution, reaching a peak of 11 percent in 1990. The
lowest rate of –7.3 percent have been occurred in 1999 due to a drought (See Figure 1).
Figure 1: Annual Growth Rate of the Agriculture Sector at Constant 1997 Price (1960-2007)
The present research explores from macro perspective an alternative way in which the Total Factor Productivity in
agricultural sector could be explored employing time series data. Following Solow [2] and Hall and Jones [3], the
production growth is divided into two factors, workforce production and physical capital production. For that
purpose, we use the bounds testing (or ARDL) approach to co-integration proposed by Pesaran et al. [4] to test the
Total Factor Productivity in agricultural sector in framework of Growth Accounting using data over the period
1961–2007. The ARDL approach to co-integration has some econometric advantages which are outlined briefly in
the following section. Finally, we apply it taking as a benchmark Solow [2] and Hall and Jones [3] study in order to
sort out whether the results reported there reflect a spurious correlation or a genuine relationship Total Factor
Productivity in agricultural sector and the variables in question. This contributes to a new methodology in the
agricultural sector literature. Next section starts with discussing the model and the methodology. Then in next
Section we describe the empirical results of unit root tests, the F test, ARDL co-integration analysis, Diagnostic and
stability tests and Dynamic forecasts for dependent variable and next Section summarizes the results and
conclusions.
Materials and Methods
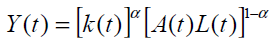
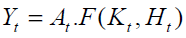
Growth accounting framework: The first standard framework was introduced by Solow. Solow knows production
growth due to two factors production labor and physical capital. Solow is considered production function, as user
and follows:
 (1)
(1)
Y is the total economic production and K accumulation physical capital economy, L total workforce and T is the
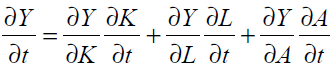
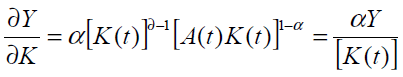
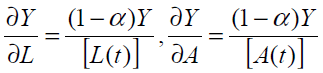
time index. Relative changes in production can be explained using relative changes in capital, labor and TFP. To
calculate the relative changes in production we derive from equation (1) relative to T.
 (2)
(2)
In equation (2) we have:
 (3)
(3)
 (4)
(4)
 (5)
(5)
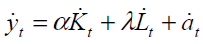
For conversion equation (3,4,5) as growth rate we have:
 (6)
(6)
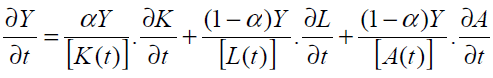
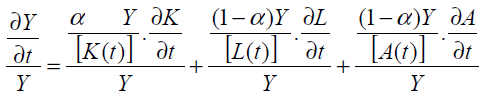
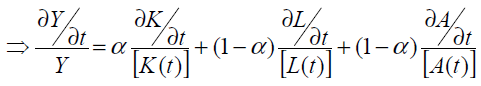
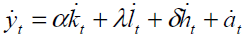
Phrase left side of in equation (6) relative changes in production and two phrase first the right side respectively
shows the relative changes save capital and labor force. The third phrase on the right side shows the Solow residual,
that shows productivity share in GDP. Equation (6) can be written as follows:
 (7)
(7)
So that:
 (8)
(8)
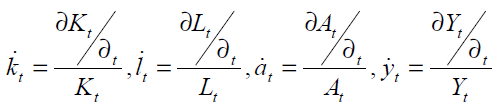
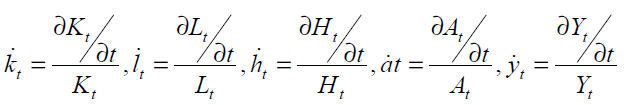
Where,  respectively show production growth rates, save physical capital and labor force.
 Shows
growth rate TEP, Which is obtained of the remaining estimates equation (2). Also a,λ show respectively share of
workforce and capital of the production. The second standard framework has been suggested for analysis of growth
factors as generalized Solo model. This framework has been suggested, to two methods almost the same by
Mankiew and et al [5], other by Hall and Jones [3]. In generalized model new forms of the capital as accumulation
of human capital is located, as a factor important production besides the accumulation of physical capital and labor.
The model with regard human capital that considered by Mankiew and et al [5] is as follows:
Shows
growth rate TEP, Which is obtained of the remaining estimates equation (2). Also a,λ show respectively share of
workforce and capital of the production. The second standard framework has been suggested for analysis of growth
factors as generalized Solo model. This framework has been suggested, to two methods almost the same by
Mankiew and et al [5], other by Hall and Jones [3]. In generalized model new forms of the capital as accumulation
of human capital is located, as a factor important production besides the accumulation of physical capital and labor.
The model with regard human capital that considered by Mankiew and et al [5] is as follows:
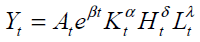 (9)
(9)
So that H accumulation of human capital and δ Share of human capital in production a,λ, also respectively show
share of workforce and capital of the production. If efficiency is fixed relative to scale we have: To calculate the
relative changes in production can be extracted the following relationship for equation (3).
 (10)
(10)
So that:
 (11)
(11)
Where,  Shows growth rate of human capital and TFP shows by which is achieved of the remaining estimate
equation (6). Hall and Jones for importing human capital, consider the following production function:
Shows growth rate of human capital and TFP shows by which is achieved of the remaining estimate
equation (6). Hall and Jones for importing human capital, consider the following production function:
 (12)
(12)
So that H in this regard measures, save skilled workforce that:
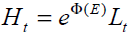 (13)
(13)
Where F(E) measures efficiency per unit of skilled workforce so that year’s education E plays an essential role in
this regard. The analytical framework they will be as follows:
 (14)
(14)
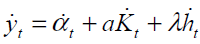
That in this regard is 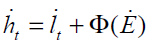 , where a,l the shares factors of production are and
  are
respectively show production growth rates stored in physical capital and save the skilled workforce and also shows TFP growth.
are
respectively show production growth rates stored in physical capital and save the skilled workforce and also shows TFP growth.
Results and Discussion
In this paper, we investigate Total Factor Productivity (TFP) in agricultural sector by Solow [2] and Hall and Jones
[3] during 1959-2007 in Iran. In this regards we used current assumption of growth accounting based on constant
efficiency to scale [2,5-7]. Therefore, growth accounting model in agricultural sector is included total production
as depend variable and total workforce, physical capital and human capital skilled in agricultural sector as
independent variables as following:
LYA is Logarithm of total production in agricultural sector in 1997 constant prices based on million dollars. LWA is
Logarithm of total workforce in agricultural sector based on thousands. LKA is Logarithm of physical capital in
agricultural sector in 1997 constant prices based on million dollars. LHA is Logarithm of human capital in
agricultural sector based on thousands (the number of employed workforce with a university degree).
Unit Root Test: ADF test investigates the presence of unit root in time series data. Strong negative numbers of unit
root reject the null hypothesis of unit root at some level of confidence. ADF framework to check the stationary of
time series has been given in following equation:
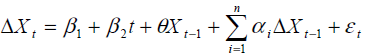 (15)
(15)
Where, εt is white noise error term. Basically, this test determines whether the estimates of θ are equal to zero or not.
The results of ADF test is displayed in Table 2.
Table 2: Results of unit root by ADF test
The results reported in Table 2 show that null hypothesis of ADF unit root is accepted in case of LYA, LWA and LHA
variables but rejected in first difference at 1% level of significance. This unit root test indicate that LYA, LWA and
LHA variables considered in the present study are difference stationary I (1) while LKA variable is level stationary
I(0) as per ADF test. On the basis of this test, it has been inferred that LYA, LWA and LHA variables are integrated of
order one I (1), while LKA variable is integrated of order zero I (0).
Bound F test: In order to test the presence of long-run relationship between LYA, LWA, LKA and LHA, ARDL
equation is estimated. A general to specific modeling approach guided by the short data span and Schwarz’s
Bayesian Criterion (SBC) respectively to select a maximum lag order of 2 for the conditional ARDL-VECM is
preferred because of annually frequency. The presence of co-integration between the variables is accepted if Fstatistics
reject the null at 95 per cent critical bound values generated by Narayan [8] for small sample.
The calculated F statistic presented for total production in agricultural sector as dependent variable in Table 3 is
5.5416 and is higher than the upper bound at 1% level of significance. Thus, null hypothesis of no co-integration is
rejected, implying that there exists a long-run relationship among the variables LYA, LWA, LKA and LHA, when the
regression is normalized on logarithm of total production in agricultural sector (LYA).
Table 3: Bound Test for Co-integration
ARDL co integration analysis: The estimated coefficients of the long-run relationship and Error Correction Mode
(ECM) are displayed in Table 4.
Table 4: Estimated Long-run and ECM Coefficients using ARDL (1,0,0,0) Model
As we see in Table 4, ECM version of this model show that the error correction coefficient which determined speed
of adjustment, had expected and significant negative sign. Bannerjee et al. [9] holds that a highly significant error
correction term is further proof of the existence of a stable long-term relationship. The results indicated that
deviation from the long-term in inequality was corrected by approximately 45 percent over the following year or
each year. This means that the adjustment takes place relatively quickly, i.e. the speed of adjustment is relatively
high.
Conclusion and Recommendations
The goal of this paper was to test the existence of long run relationship determinants of total factor productivity in
agricultural sector in Iran. This objective was aided by the technique of Pesaran et al. [4] approach to co-integration
which presents non-spurious estimates. Subsequently, our work provides fresh evidence on the long run relationship
determinants of total factor productivity in agricultural sector. The results at relationship confirm the studies of
Solow [2] and Hall and Jones [3] but our results are more robust.
This study has attempted using the growth accounting framework and Solow [2] Hall and Jones [3] study to review
TFP in agricultural sector in Iran. studies Results like results studies Lucas [10] and Ganev [11] showed that
contrary to theoretical discussions, in terms of human capital growth model has been unable that adds on
explanatory power Solow model, in decomposition sources of growth and TFP in agricultural sector in Iran. Also
long-term TFP growth trends although it has been positive in mentioned course of but its rate has been very small
and intensity oscillatory. In addition results sensitivity analysis of TFP growth rate in agricultural sector compared to
changes in physical capital share of production shows during the period 1966 to 1979 and 2003 to 2007 growth rate
of K has been larger than growth rate of H. Findings study implies to the harsh reality that massive government
investment and people in the field of human resources in agricultural sector such as infrastructure development and
educational facilities, especially universities, and also development of scientific and research centers, because
nonoccurrence quantity and quality of labor market needs and supply of trained labor has not had much impact on
production levels and growth. Based on results obtained recommended that in order to create a perceptible upward
trend in growth rate of TFP in agricultural sector as one of the most important stimulus economic growth, effective
planning and accurate be designed with the approach achieve the following goals:
1. Coordination of educational structure with business environment and demand-driven.
2. Use forces skilled and trained in occupations related to their specialty.
3. Provide positive space investment and capital accumulation in line policies principle 44.
4. Proportional and facilitate the business environment as the field absorption efficient manpower in agricultural
sector.
5. Effort to run packages to improve productivity in order achieving the goals vision document.
6. Create coordination the growth rate of skilled labor and specialist and growth rate of physical capital in
agricultural sector.
1These are Summary of balance sheets of central banks and economic reports in the years 1961 to 2006.
2Iran's FYDP was initiated since the end of Iran-Iraq war in 1988. High rates of economic growth for a decade is a
strategic approach as well as an outstanding issue in the fourth five-year development plan of Iran (March 2005-
2010).
References
- Shahabadi A. Dev. Ros. Qarterly. 2009, 12(4): 147-125.
- Solow RM. Quar. J. Econ. 1956, 70: 65-94.
- Hall RE., Jones CI. Quar. J. Econ. 1999, 114 (1): 83–116.
- Pesaran HM., Shin Y & Smith JR. J. Appl. Econ. 2001, 16:289–326.
- Mankiew NG., Romer D. & Weil DN. Quar. J. Econ. 1992, 107 (2): 407–437.
- Gollin D. J. Polit. Econ, 2002, 110: 458–475.
- Ganev K. Conference for Medium-Term Econ. Assessment (CMTEA), 2005, 29-30.
- Narayan PK. Appl. Econ. 2005, 37:1979–1990.
- Banerjee A., Lumsdaine RL & Stock JH. J. Bus. Econ. Stat. 1992, 10: 271-287.
- Lucas RE. J. Mon. Econ. 1988, 22: 3–42.
- Ganev K. Conf. Medium-Term Econ. Assessment (CMTEA). 2005, 29-30.
- Kankal SB., Gaikwad RW. Adv. Appl. Sci. Res. 2011, 2(1): 63.
- Elinge CM., Itodo AU., Peni IJ., Birnin-Yauri UA. & Mbongo AN. Advan. Appl.Sci. Res. 2011, 2(4): 279.
- Ameh EG., Akpah FA. Advan. Appl. Sci. Res. 2011, 2(1): 33.
- Ogbonna O., Jimoh WL., Awagu EF., & Bamishaiye EI. Advan. Appl. Sci.Re. 2011, 2(2): 62.
- Yadav, S. S., Kumar, R. Advances in Applied Science Research, 2011, 2 (2), 197.
- Sen, I., Shandil, A., Shrivastava, V. S. Advan. Appl. Sci. Res. 2011, 2(2): 161.
- Levine, D. M., Sulkin, S. D. J. Exp. Mar. Biol. Eco. 1984, 81: 211-223.
- Gupta N., Jain U. K. Der Pharmacia Sinica 2011, 2(1): 256-262.