Quality problem or issue: To improve the operations of one federally qualified health center, this research sought to reduce patient cycle time. However, this investigation was impeded by the health center’s lack of an accurate and reliable measurement system.
Initial assessment: To address this issue, this health center undertook a process improvement project in one of their faclitites. Through process mapping and measurement activities, project team members obtained a collective understanding regarding the inner workings of their process and identified problems with their measurement system regarding missing and infeasible data.
Choice of solution: Through a series of process audits, project team members identified that measurement errors were due to not having a specific staff member assigned to check-out patients; later, they found this was due to medical assistants not fully understanding how to enter patient check-out times in the electronic medical record.
Implementation: The accuracy and reliability of the measurement system was improved by assigning the task of checking out patients to medical assistants, and providing them with training about how to enter patient check-out times in the electronic medical record.
Evaluation: The effect of the improvements made to the measurement system are evident given the decrease in the amount of infeasible patient cycle time data recorded (34% less) and the reduction in patient cycle time variation for the improved process.
Lessons learned: This case study provides an example from which others can learn regarding the importance of measurement system accuracy and reliability with respect to process improvement efforts.
Keywords
Continuous quality improvement; Quality measurement; Process improvement; Primary care/general practice
Quality Problem or Issue
The mission of any health care organization is to provide care to the patients they serve. The complex, multifaceted nature of health care systems, however, often make the fulfillment of this mission challenging [1]. Unfortunately, health care processes can be poorly designed, unnecessarily duplicate services, and/or have long wait times [2]. Patient cycle time (i.e., patient’s time in a facility from check-in to check-out), for example, is a critical driver of patient satisfaction for outpatient facilities [3]. Patient cycle time can be reduced through process improvement efforts targeted at eliminating waste and/or errors in the process based on data collected through accurate and reliable measurement systems [4,5].
Continuous quality improvement methods have been used successfully to improve processes within health care [6-8]. In hospitals, these methods have been used to reduce patient length of stay by both streamlining the discharge process and improving patient care rounds [1,9]. These methods have also been employed previously in outpatient facilities to, when possible, perform tasks in parallel to reduce patient cycle time [4].
To improve the operations of one federally qualified health center (FQHC), this research sought to reduce patient cycle time. However, this investigation was impeded by the FQHC’s lack of an accurate and reliable measurement system; hence, this case study demonstrates how to improve the FQHC’s patient cycle time measurement system. This work involved mapping the patient visit process, auditing the check-in and check-out steps to identify the cause(s) of measurement errors, and implementing solutions to address the issues identified.
Initial Assessment
Central Care Integrated Health Services is a FQHC that serves to more than 30,000 low-income, uninsured, and under-served residents in Houston, Texas. They have seven locations that generate over 65,000 patients visit each year. Unfortunately, Central Care does not have an accurate and reliable measurement system to support improvement efforts. To address this issue, they undertook a process improvement project in one of their faclitites. The project team included Central Care’s President/Chief Executive Officer, Chief Medical Officer (CMO), and Information Technology (IT) staff. This project aimed to improve the patient cycle time measurement system as follows:
Problem statement: Central Care’s patient cycle time measurement system had 12% missing data and 35% infeasible data over the last 5 months (October 2016–February 2017).
Mission statement: Reduce Central Care’s percentage of missing and infeasible data for patient cycle time measurements.
To better understand the patient visit process, the project team shadowed those working in the process (i.e., front desk staff, medical assistants, etc.) and developed a supplier, input, process, output, and customer (SIPOC) diagram, as shown in Table 1 [10]. The project team also developed a cross functional flowchart/ swim-lane diagram to document the details of the patient visit process [10]. This included the specific tasks performed by front desk staff, medical assistants, providers, and the internal laboratory.
| Suppliers |
Inputs |
Process |
Outputs |
Customers |
Community
Human Resources Department
Vendors |
Patient
Front desk staff
Medical assistants
Providers (i.e., physicians)
E-clinical works (electronic medical record system)
Computers
Medical supplies |
1. Patients checks-in
2. Front desk staff obtain/check patient information
3. Medical assistant checks patient’s vital signs
4. Show patient to medical room
5. Additional medical assistant checks patient’s medical history
6. Provider goes to patient’s room
7. Examines patient
8. Sends patient to internal/external health services (i.e., lab, etc.)
9. Patient checks-out
10. Provider closes patient’s chart |
Completed medical visit
Updated patient’s chart (in ECW)
Prescription report
Payment (for uninsured patients only) |
Patients
Providers
Medical assistants
Billing Department |
Table 1: High-level patient visit process at Central Care.
To establish a baseline measurement, data were collected from e-clinical works (ECW), i.e., Central Care’s electronic medical record system, regarding patient cycle time for October 2016– February 2017. Of the 809 patient visits during this time, 12% did not have the check-in and/or check-out times recorded in ECW. In addition, 35% of these data ranged from one to nine minutes. Given their knowledge about this process, the project team knew it was not realistic for a patient visit to last less than 10 minutes. To simply obtain an estimate of patient cycle time, all measurements greater than zero were considered for the baseline. These data consisted of 710 patient visits in which the patient cycle time ranged from 1-335 minutes, with an average of 29.97 minutes and a standard deviation of 35.88 minutes.
Choice of Solution and Implementation
To determine the cause(s) of measurement error, a process audit was conducted. This included observing the check-in and check-out steps, recording the time patients checked-in and checked-out, and comparing this to the times stored in ECW. While check-in times were recorded accurately, many check-out times observed during the audit were not recorded in ECW. Upon further investigation, it was determined that the task of checking patients out was not assigned to a specific staff member. The CMO immediately rectified this by assigning this task to medical assistants.
Because all medical assistants did not fully understand how to correctly enter the patient check-out times in ECW, they were trained on how to do this at their monthly meeting. An additional audit was conducted to verify that check-in and check-out times were recorded correctly in ECW in which data were collected for a two week period (October 16-31, 2017). Of the 534 patient visits during this time, 27% did not have the check-in and/or check-out times recorded in ECW. Additional training was provided for medical assistants to improve their adherence to recording patient check-out times in ECW.
During the initial process audit described previously, the time patients spent at each step in the process and notes were recorded about waiting/delays. This audit identified that patients spent an excessive amount of time waiting for 1) the second medical assistant to collect their medical history and 2) the provider to conduct their exam. As a result, the patient visit process was further revised such that one medical assistant now takes both the patient’s vitals and their medical history. Furthermore, three additional medical assistants and two providers were hired to reduce patient waiting time/process delays.
The improved patient visit process was documented by updating the process map created previously, as illustrated Figure 1, and this diagram is now included as part of Central Care’s medical services procedures. To ensure medical assistants adhere to the improved process, Central Care’s medical services manager now audits the patient check-in and check-out process steps to ensure these times are recorded by medical assistants in ECW. In addition, each month the medical services manager now reviews data regarding patient cycle time using a run chart, as shown in Figure 2 [11].
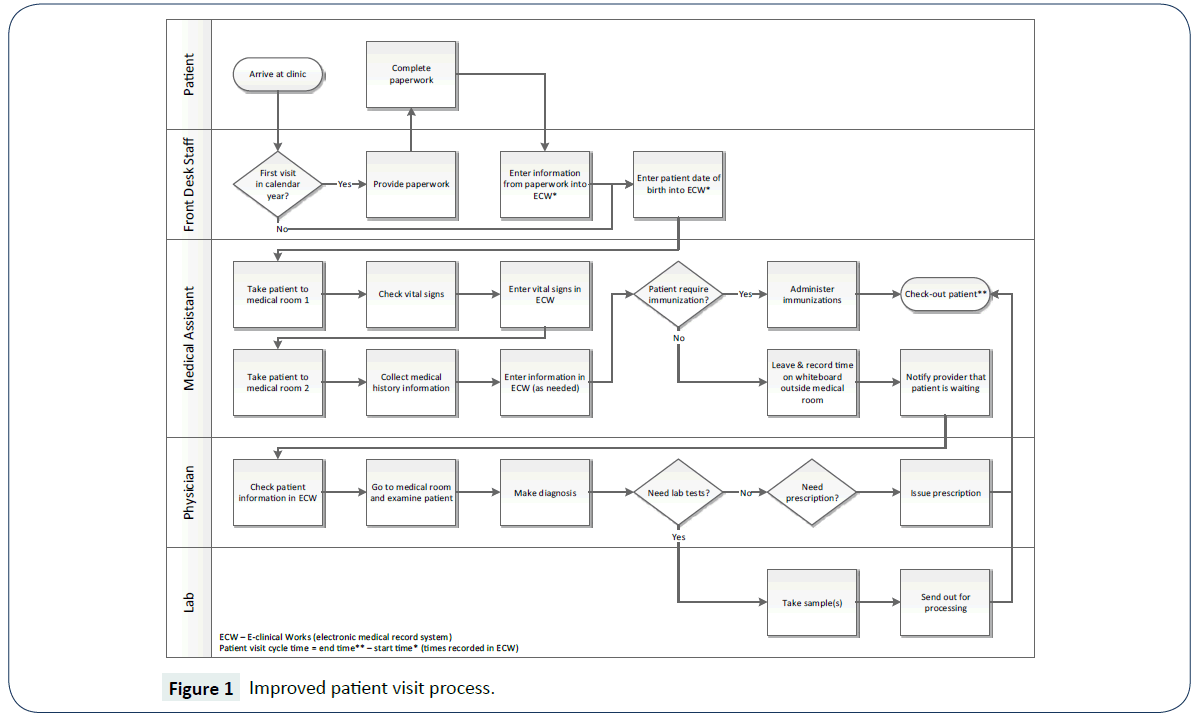
Figure 1: Improved patient visit process.
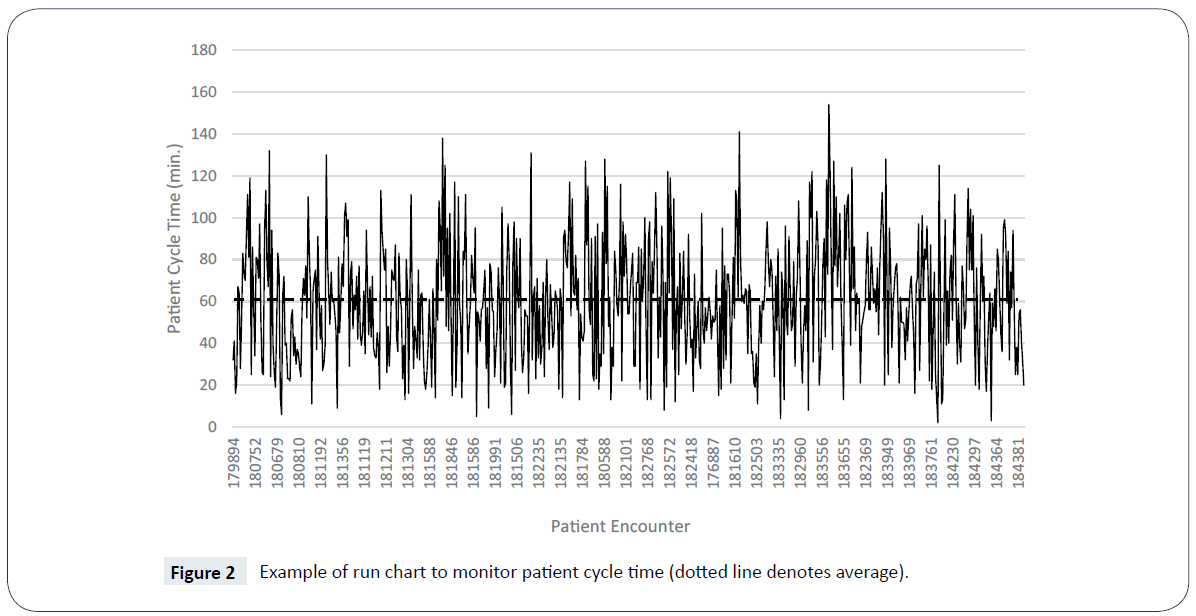
Figure 2: Example of run chart to monitor patient cycle time (dotted line denotes average).
Evaluation
At the end of this process improvement project, an audit was conducted in which data were collected for one month (November 1-30, 2017) to verify that check-in/check-out times were recorded by medical assistants in ECW. Of the 855 patient visits during this time, 24% did not have check-in and/or check-out times recorded in ECW; however, only 1% of these data ranged from one to nine minutes, which represents a 34% improvement over the baseline measurement for patient cycle times less than 10 minutes. Improving the accuracy and reliability of the measurement system, changing the process such that one medical assistant takes both the patient’s vitals and their medical history, and hiring three additional medical assistants and two providers led to a patient cycle time of 60.14 minutes, on average, that ranged from 2-154 minutes with a standard deviation of 28.34 minutes for 654 patient visits. While it appears that the average patient cycle time increased compared to the baseline measurement, it is important to note that the baseline for this project was merely an estimate. Much of the work performed in this project focused on improving the accuracy and reliability of the measurement system, the effect of which is evident given the reduction in the variation, i.e., standard deviation, for the improved process (28.34 minutes) compared to the baseline estimate (35.88 minutes).
Lessons Learned
This case study provides an example from which others can learn regarding the importance of measurement system accuracy and reliability with respect to process improvement efforts. Through process mapping and measurement activities, project team members obtained a collective understanding regarding the inner workings of their process and identified problems with their measurement system. Through a series of process audits, they determined that measurement errors were due to not having a specific staff member assigned to check-out patients; later, they found this was due to medical assistants not fully understanding how to enter patient check-out times in ECW. While the initial project to reduce patient cycle time was impeded by a poor measurement system, the FQHC where this study was conducted is now armed with more accurate and reliable data to support their future improvement efforts.
References
- Taner MT, Sezen B, Antony J (2007) An overview of Six Sigma applications in healthcare industry. Int J Health Care Qual Assur 20: 329-340.
- IOM (2001) Crossing the quality chasm: A new health system for the 21st century. Washington, D.C.: National Academy Press.
- Grieger DL, Cohen SH, Krusch DA (2007) A pilot study to document the return on investment for implementing an ambulatory electronic health record at an academic medical center. J Am Coll Surg 205: 89-96.
- Jiang L, Giachetti RE (2008) A queueing network model to analyze the impact of parallelization of care on patient cycle time. Health Care Manag Sci 11: 248-261.
- Franco-Santos M, Kennerley M, Micheli P, Martinez V, Mason S, et al. (2007) Towards a definition of a business performance measurement system. International Journal of Operations & Production Management 27: 784-801.
- Black J (2009) Transforming the patient care environment with Lean Six Sigma and realistic evaluation. J Healthc Qual 31: 29-35.
- Carboneau C, Benge E, Jaco MT, Robinson M (2010) A Lean Six Sigma team increases hand hygiene compliance and reduces hospitalâ€ÂÂÂÂacquired MRSA infections by 51%. J Healthc Qual 32: 61-70.
- Schroeder RG, Linderman K, Liedtke C, Choo AS (2008) Six Sigma: Definition and underlying theory. Journal of Operations Management 26: 536-554.
- Trzeciak S, Mercincavage M, Angelini C, Cogliano W, Damuth E, et al. (2016) Lean Six Sigma to reduce Intensive Care Unit length of stay and costs in prolonged mechanical ventilation. J Healthc Qual 38: 408-419.
- Tague NR (2005) The quality toolbox. 2nd Ed. Milwaukee, WI: ASQ Quality Press.
- Evans JR, Lindsay WM (2010) The management and control of quality. 8th ed. Cincinnati, Ohio: South-Western College Publishing.