Introduction
Water is essential for life, and maintaining hydration is important for physical and mental performance. The human
body is largely made of water. Body water content declines with age, from about 75% in babies to 60% in adults.
Although we can live for up to 50 days without food, without water we will survive only a few days, even in a cool
climate [1]. Testing of wastewaters for genotoxicity may become a routine requirement for some industrial
wastewater discharge permits, not unlike the more common requirement for routine aquatic toxicity tests [2].
Drinking water quality has a heavy impact on human health. A recent assessment of major health risk factors
attributed over two million deaths to unsafe water, which represents the leading environmental risk factor on a
global scale [3]. Recent statements on water requirements have been based on retrospective recall of water intake
from food and beverages among healthy non-institutionalized individuals. We provide examples of water intake
assessment in populations to clarify the need for experimental studies. Beyond these circumstances of dehydration,
we do not truly understand how hydration affects health and well-being, even the impact of water intakes on chronic
diseases [4]. Pollution of water bodies is one of the areas of major concern to environmentalists. Water quality is an
index of health and well being of a society. Industrialisation, urbanisation and modern agriculture Practices have
direct impact on water resources. These factors influence the water resources quantitatively and qualitatively [5].
Materials and Methods
Collection of sample
The chemically disordered samples were collected from the near by well of a chemical factory in Malappuram
district of Kerala. The disorder was confirmed using the following methods.
Estimation of Chlorides in Water
Materials
• Burette
• Conical flask
• Potassium chromate
• Silver nitrate
• Sodium Chloride
Reagents
a) 5% Potassium Chromate: Dissolve 50g of potassium chromate in little amount of distilled water, add silver
nitrate solution until definite red precipitate is formed, stand for 12 hours, filter and dilute to 1L with distilled water
b) 0.0141N silver nitrate: Dissolve 2,395g of AgNO3 (MW – 169.87) in 1000ml of chloride free distilled water
(1ml=500μg of chloride)
c) Standard NaCl Solution (0.0141N): Dissolve 824mg of NaCl dried at 140°C in distilled water and make up the
volume to 1000ml (1ml=500μg of chloride)
Standardization of 0.0141N silver nitrate: Standardize against standard NaCl solution using 1-2ml of 5%
potassium chromate as indicator. The end point is appearance of pinkish yellow color. Use the value as reagent
blank (Vb).
Procedure
• Take 100ml of water in conical flask (Adjust the PH between 7-10 with sulphuric acid or sodium hydroxide)
• Add 1 ml of 5% potassium chromate
• Titrate with 0.0141N silver nitrate (Va)
• End point is appearance of pinkish yellow color
• Establish reagent blank value by titration (Vb)
Calculation
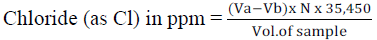
Specification: Should be less than 50 ppm.
Determination of Iron in Water [7]
Preparation of standards
Dissolve 0.7022 grams of ferrous ammonium sulfate, hexahydrate in distilled water. Dilute to 1.00 L. This solution
is 100 mg/L Fe+2 (same as 100 ppm).Prepare standard solutions of 0.0, 2.0, 4.0, 6.0, and 8.0 ppm by respectively
diluting 0.0, 2.0, 4.0, 6.0, and 8.0 mL of the 100 ppm stock solution into five separate 100.0 mL volumetric flasks.
To each flask add 5 mL of a 0.25% ortho-phenanthroline solution. Dilute with deionized water to 100.0 mL. Clean
and dry a set of cuvette. Label the cuvettes 0ppm (or blank), 2.0ppm, 4.0ppm, 6.0ppm, 8.0ppm. Fill each cuvette
with the appropriate solution.
Preparation of the water Sample
Obtain an unknown sample from the instructor or prepare your own unknown using a collected water sample. If
using a collected water sample, add 5 mL of the 0.25% ortho-phenanthroline solution to a 100.00 mL volumetric
flask. Dilute to mark with collected water sample.
Forming the standard curve [8]
Turn on the spectrophotometer. Press the A/T/C button on the Spec 20 Genesys to select absorbance. Adjust the
wavelength to 510 nm by pressing the nm arrow up or down. Insert the blank (0ppm) into the cell holder and close
the door. Position the cell so that the light passes through clear walls. *Remember to wipe off the cuvette with a
Kimwipe before inserting it into the instrument. Press 0 ABS/100% T to set the blank to 0 absorbance. Record the
absorbance of the 0ppm solution. Obtain absorbance readings for each of the other standard solutions. If using a
collected water sample as an unknown, use collected water without the 0.25% ortho- phenanthroline solution as the
blank and re-zero the absorbance. If not, proceed to the next step. Obtain an absorbance reading for the unknown sample. Make a graph of Concentration (x-axis) vs. absorbance (y-axis).From the standard curve, determine the
concentration of iron in this unknown sample.
MTT Assay (Liver-Cell Lines) [9]
For the Liver cells, remove the medium and replace it with 100 μL of fresh culture medium. For non-adherent cells,
centrifuge the microplate, pellet the cells, carefully remove as much medium as possible and replace it with 100 μL
of fresh medium. Add 10 μL of the 12 mM MTT stock solution (prepared in step 1.1) to each well. Include a
negative control of 10 μL of the MTT stock solution added to 100 μL of medium alone. Incubate at 37°C for 4
hours. At high cell densities (>100,000 cells per well) the incubation time can be shortened to 2 hours. Add 100 μL
of the SDS-HCl solution (prepared in step 1.2) to each well and mix thoroughly using the pipette. Incubate the
microplate at 37°C for 4– hours in a humidified chamber. Longer incubations will decrease the sensitivity of the
assay. Mix each sample again using a pipette and read absorbance at 570 nm.
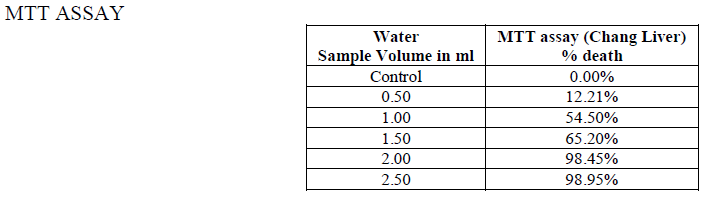
Results
Conclusion
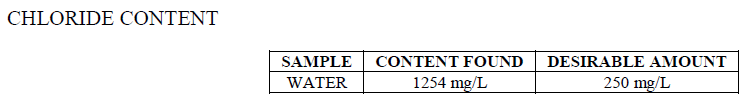
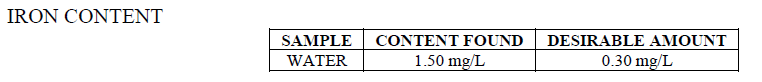
From the above investigation we found that the chemically disordered water is a major reason for the liver damage
in human beings. The water which we collected from a source was very bad in terms of chlorides and iron. The
content was around 10 times the desirable limits. This water samples was used for the MTT assay for the
identification of the hepato-destructive activity. The results were significant as in the 2.5 ml of the water samples are
capable of killing the liver cells around 98%. Thus we conclude that the quality of the water should be maintained
for the better health.
References
- Barry M. Popkin, Kristen E. D’Anci, and Irwin H. Rosenberg, Nutr Rev. 2010 Aug; 68(8): 439–458.
- Ralph G. Stahl Jr. Ecotoxicology and Environmental Safety, Volume 22, Issue 1, August 1991, Pages 94–125
- World Health Organization. Global health risks. Mortality and burden of disease attributable to selected major risks Geneva: WHO; 2009.
- Barry M. Popkin, Kristen E. D’Anci, and Irwin H. Rosenberg. Water, Hydration and Health, Nutr Rev. Author manuscript; available in PMC 2011 Aug 1.
- Yadav S.S. and Kumar Rajesh, Advances in Applied Science Research, 2011, 2 (2): 197-201.
- Rapid colorimetric assay for cellular growth and survival: application to proliferation and cytotoxicity assays. J Immunol Methods 16;65(1-2):55-63.
- UwinAnalytical Methods, Vol3(2),2010
- UwinAnalytical Methods, Vol3(6),2010
- UwinAnalytical Methods, Vol2(15),2010