Keywords
Lead exposure; Margin of exposure; Probabilistic risk; Frequently
consumed foods
List of Abbreviations
AT: Averaging Time; BMDL: Benchmark Dose Lower Bound; BW:
Body Weight; C: Concentration of Pb; CDI: Chronic Daily Intake;
ED: Exposure Duration; EDI: Estimated Daily Intake; EF: Exposure
Frequency; GFAAS: Graphite Furnace Atomic Absorption
Spectroscopy; ILTCR: Incremental Lifetime Cancer Risk; MF: Mass
of Food Consumed; MoE: Margin of Exposure; PF: Potency Factor
Introduction
Lead (Pb) exposure is ranked as the 26th highest risk factor to
the disease burden in Western Sub-Saharan Africa [1]. Globally,
exposure to Pb is estimated to have caused 1,050,000 deaths in
2017 alone [2]. The majority of Pb exposure in humans occurs
through food consumption [3]. Though Pb is not added to food
intentionally, it remains a serious contaminant of food, either
through deposition from the air or uptake from soil and leadedagrochemicals
during growth [4]. The use of Pb-contaminated
water in food processing and possible leaching into food from food
contact materials have also been suggested as another exposure pathway [5]. Though Pb has been determined in several foods in
Ghana [6-8], risk assessment is hardly monitored by regulatory
authorities. There seems to be weak national intervention
programmes for the management and or communication of the
risk of Pb. This raises a public health concern since Pb has many
adverse health effects.
In characterizing the risk of adverse health effects posed by
Pb, health-based guidance thresholds provided by regulatory
authorities are matched to prevailing Pb exposure levels. Two
approaches that have been used are; the methods of margin
of exposure (MoE) and incremental lifetime cancer risk (ILTCR).
The MoE approach makes use of a benchmark dose, which is
the threshold above which a specified level of adverse response
occurs [9,10]. Calculated MoE values are then matched with
the recommended thresholds to determine whether risk has
occurred or not. The European Food Safety Authority (EFSA)
has defined MoE values greater than or equal to 10 as of no
appreciable risk [11]. On the other hand, MoE values between 1
and 9 imply a low risk whereas values below 1 imply a significant
risk. The incremental lifetime cancer risk (ILTCR) is determined as a product of the exposure and the potency factor (slope factor)
of Pb [12]. Risk estimates lower than 1 × 10⁻⁶ (1 out of 1 million
persons) are regarded as acceptable; whereas estimates greater
than this de minimis imply significant risk [12].
The toxicity of Pb has been attributed to its ability to bind to
several important biomolecules. Perhaps, the most known
disease endpoint of Pb is its neurotoxicity. Studies have shown
that the mechanism underlying Pb neurotoxicity involves a noncompetitive
inhibition of the N-methyl-D-aspartate receptor [13].
This receptor is critical for memory and learning processes, thus its
inhibition results in reduced cognition functions. The neurotoxic
effects of Pb include decreased perception of sound and sight,
antisocial tendencies, reduced attention span and a decreased
learning ability shown as reduced intelligence quotient (IQ)
scores [14,15]. Again, Pb causes damage to glomerulus leading to
a reduction in the glomerular filtration rate and ultimately chronic
kidney disease [3]. Toxicity to kidney usually occurs at relatively
high levels of blood(B)-Pb (>60 μg/dL) [3] though other studies
suggest adverse effect at 10 μg/dL [16]. It has also been reported
that a 15.5 μg/g increase in bone (tibia) Pb content, is said to be
associated with a 19% increase in the risk of hypertension [17].
The mechanism of Pb-induced hypertension has been described
as involving impairment of the nitric oxide pathway, leading
to a downregulation of soluble guanylate cyclase (nitric oxide
receptor) [18]. This leads to increased total peripheral resistance,
increased arterial pressure and subsequently, hypertension.
The International Agency for Research on Cancer (IARC) has
classified inorganic Pb as “probably carcinogenic” to humans
(Group 2A) [19]. This was based on “sufficient evidence of
carcinogenicity” in animals, but “inadequate evidence of
carcinogenicity” in humans. However, organic Pb is “not
classifiable to carcinogenicity” (Group 3) because of “inadequate
evidence of carcinogenicity” in humans as well as animals [19].
The mechanism of Pb carcinogenesis involves the ability of Pb
to inhibit DNA repair and induce oxidative stress in cells. This
in turn adversely impacts the tumor suppressor proteins [20].
Increased lung cancer deaths following Pb exposure has been reported [21]. On the contrary, other studies suggest that there
could be other unknown factors involved [22,23]. It appears that
the status of Pb as a carcinogen is inconclusive because of the
absence of clear biomarkers of Pb exposure [24].
Exposure assessment to Pb is largely based on the concentration
of Pb in foods and the frequency of consumption of these foods.
Though several approaches for exposure assessment exist, it is
necessary that these approaches are able to accurately estimate
levels of exposure. The total diet study (TDS) approach, which
involves sampling of frequently consumed foods, homogenizing
and analyzing them for toxic chemicals is commonly used [25].
This approach provides the most accurate estimate of the
concentration of Pb and other chemicals ingested through food
[26]. Assessment of exposure to Pb has also been achieved using
biomarkers such as bone-Pb, blood-Pb and δ-aminolevulinic
acid (δ-ALA). Exposure to Pb results in the inhibition of
δ-aminolevulinic acid dehydratase (δ-ALAD) activity and a
consequent increase in δ-ALA excretion [27]. Bioaccumulated bone-Pb, as measured by non-invasive x-ray fluorescence, has
also been used as a biomarker of long-term exposure since Pb is
deposited in the bone [28]. Therefore, the use of biomarkers in
exposure assessment allows for the determination of the total
body burden of Pb since the route of contamination is of no
interest.
The presence of Pb in foods and its exposure is not a contemporary
issue, because many studies have reported Pb in foods [6-8].
However, public health concerns still persist since Pb has many
adverse health effects. The problem is that though tools exist
for the determination of the burden of risk of contamination in
foods, there is paucity of information relating to Pb intake risks
in many communities. It is therefore necessary to evaluate the
extent of risk periodically in order to inform food safety policies.
This study therefore sought to determine the exposure of Pb
through the consumption of ‘frequently consumed foods’ and
also determine the associated risks.
Materials and Methods
Materials
All reagents used in the study were of analytical grade. HNO3 was
obtained from Surechem Products (England). H2O2 was obtained
from BDH Chemical Ltd. (UK). Pb standard was obtained from
Merck (Darmstadt, Germany).
Study area
The area for this study was the Kumasi metropolis. Eleven
locations in the study area; Asafo, Atonsu, Bantama, Kaase, Kotei,
Kronom, Santaase, Suame, Tafo, Tanoso and Tech Junction, were
selected as sampling sites.
Sampling of foods and sample preparation
The most frequently consumed foods in the Kumasi metropolis
have been determined in a total diet study to be rice, banku, fufu and kenkey [29]. These foods together with their accompaniments
were randomly sampled from selected locations in the study area
for a period of 1 week. Sampled foods were homogenized using a
Crompton blender (Taura TD71, India), packaged into Ziploc bags
and stored at -16°C pending further analyses.
Digestion of foods
The wet acid method was used to digest a mass of 0.5 g of the
homogenized food sample weighed into a digestion tube [30]. A
volume of 3 mL HNO3 (65%) and 1 mL H2O2 (30%) was then added
to the sample in the digestion tube and heated in a Tecator
Digester System 20 (1015, US) at 120°C for 3 h. The digestate was
then transferred into a 20 mL volumetric flask and topped to the
mark using deionized water.
Instrumentation
Measurements were performed using an Analytik Jena GF
AAS (novAA® 400P, Germany) equipped with a transversely
heated graphite atomizer. A hollow cathode lamp operating at
a wavelength of 283.3 nm, current of 10 mA and a slit width of 0.7 nm was employed. A deuterium (D2) lamp was used to
achieve background correction. Argon was used as the carrier gas
at a flow rate of 20 mL/min and an integration of 3 s used for
measurements. Pb standard solutions of concentrations 5, 10, 20,
30 and 50 μg/L were used to calibrate the GF AAS system before
the analysis. A linear calibration curve (r2=0.998) was achieved.
Limit of detection and limit of quantification were established as
0.05 μg/L and 0.10 μg/L respectively.
Quality assurance
All glassware used in the study were soaked (3 h) in 20% HNO3 followed by thorough rinsing with deionized water. Five food
samples were spiked (1 mg/L Pb standard) and digested following
the same procedure for unspiked samples. A mean recovery of
90% was obtained, indicating accuracy of the method employed.
Data analysis
Food consumption data used in this study was obtained from
a previous study [29], where the elements of consumption;
mass of food consumed per day (MF), exposure frequency (EF),
exposure duration (ED) and body weight (BW) were taken.
Distributions were then fitted for these elements as well as the Pb
concentration (C) using the Palisade @Risk software. In estimating
CDI, averaging times (AT) of 70 years and 30 years were used for
carcinogenic and non-carcinogenic risks respectively [12].
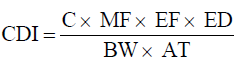 (1)
(1)
The MoE approach, which was employed to characterize non–
cancer risks was based on Equation 2 [31]. The BMDL for the
various disease endpoints used in the determinations of the
MoEs were; BMDL01 of 0.50 μg/kg bw-day for developmental
neurotoxicity; BMDL01 of 1.50 μg/kg bw-day for effects of systolic blood pressure (cardiovascular toxicity) and a BMDL10 of 0.63 μg/
kg bw-day for chronic kidney disease (nephrotoxicity) [11].
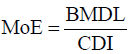 (2)
(2)
The cancer risk (ILTCR) was also determined using Equation 3 [12]
based on lead’s oral potency factor (PF) value of 0.0085 (mg/kg
bw-day)-1 [32].
ILTCR = CDI×PF (3)
All calculations were performed at 100,000 iterations in a Monte
Carlo simulation using the Palisade @Risk software.
Results and Discussion
Concentration of lead
Presented in Table 1 are the concentrations of Pb found in the
samples collected from the study area of which detectable levels
of Pb was found in 53% of sampled rice. Relative to what was
obtained in this study, other studies in Iran had reported higher
Pb content of 10.3 μg/g in cooked rice dishes [33]. In fact, a
rather lower value of 0.03 μg/g had even been reported in South
Korea [34]. The Pb level in rice-based meals sampled across
Europe has also been reported to be 12 μg/kg [35] which is more than 400 times lower than the mean Pb level for rice (5.41
μg/g) obtained in the present study. Apart from handling the raw
food materials, the observed differences in Pb content in foods
samples from the other reported studies, may be attributed to
the rice cultivars and the soil content of Pb [36]. Indeed, it has
been reported that different rice cultivars have different rates of
uptake and bioaccumulation of Pb and other heavy metals [37].
| Food |
Number of samples (Pb%) |
Pb concentration (µg/g) |
| Mean ± Standard deviation |
Min-Max |
| Banku |
26 (58) |
7.50 ± 9.54 |
0.00-28.05 |
| Fufu |
24 (54) |
4.78 ± 6.89 |
0.00-25.35 |
| Kenkey |
26 (73) |
9.55 ± 10.74 |
0.00-30.83 |
| Rice |
30 (53) |
5.41 ± 7.99 |
0.00-20.80 |
Pb%: Percentage of samples that Pb was detected in. Pb concentrations below LOD were taken as zero.
Table 1: Concentration of lead in frequently consumed foods.
For fufu, Pb was detected in 54% of samples analyzed, though
with a modal concentration of 0 μg/g, but levels up to 25.35
μg/g were recorded. Again, though Pb was not detected in most kenkey and banku samples Pb levels, as high as 30.83 μg/g and
28.05 μg/g were recorded for kenkey and banku respectively.
The possible use of Pb alloys in the manufacture of mill plates
and cooking pots and their subsequent wearing into foods during
processing may also account for the high Pb levels in the present
study [38]. The inappropriate use of Pb containing pesticides and
fertilizers may also have contributed to their high levels [4,39].
Presented in Table 2 is the statistical distribution and central
tendency metrics of the concentration of Pb in all the 106 foods
analyzed. Pb was detected in 59% of the food samples collected
from the study area. The concentration of Pb was distributed as
“Expon” (6.7972, -0.064124) ranging from safe areas where no Pb
was found in foods, to 30.83 μg/g. Though a modal concentration
of 0 μg/g was recorded in the study area, indicating safe levels
of Pb in frequently consumed foods, the uncertainty is that there
could be concentrations ranging from 0.2 μg/g (5th percentile) to
as high as 20.3 μg/g (95th percentile) (Table 2).
| Age group |
Variable |
Statistical distribution |
Min |
Max |
Central tendency metrics |
Percentiles |
| Mean |
Mode |
Median |
5th |
95th |
| |
C (µg/g) |
Expon (6.7972, -0.064124) |
0.0 |
30.83 |
6.8 |
0.0 |
2.4 |
0.3 |
20.3 |
| 5 – 19 |
MF (g/day) |
Kumaraswamy (0.65047,1.8164,77.038,1046.96) |
77 |
997 |
309 |
104 |
231 |
81 |
776 |
| EF (day/year) |
Uniform (48.494, 367.51) |
52 |
364 |
213 |
52 |
156 |
64 |
352 |
| ED (year) |
Triang (1,1,20.083) |
1 |
18 |
8 |
1 |
7 |
1 |
16 |
| BW (kg) |
Kumaraswamy (1.3579,1.7725,18.637,65.884) |
19 |
65 |
40 |
24 |
39 |
22 |
59 |
| 20–39 |
MF (g/day) |
Triang (95.251,199.47,979.01) |
104 |
939 |
405 |
166 |
347 |
163 |
793 |
| EF (day/year) |
Uniform (50.340,365.66) |
52 |
364 |
230 |
52 |
208 |
53 |
350 |
| ED (year) |
Triang (1,1,38.880) |
1 |
38 |
12 |
1 |
9 |
2 |
30 |
| BW (kg) |
LogLogistic (-8.5909,75.010,11.663) |
37 |
100 |
67 |
53 |
67 |
50 |
88 |
| 40 and above |
MF (g/day) |
Triang (54.804,138.89,1067.5) |
66 |
1032 |
418 |
139 |
384 |
120 |
851 |
| EF (day/year) |
Uniform (48.241,367.76) |
52 |
364 |
202 |
52 |
156 |
64 |
352 |
| ED (year) |
Expon (20.917,0.75099) |
1 |
73 |
22 |
1 |
20 |
2 |
63 |
| BW (kg) |
ExtValue (67.484,11.254) |
49 |
120 |
74 |
66 |
72 |
55 |
101 |
Table 2: Statistical distribution and metrics of the elements of exposure.
Relative to the mean Pb level found in this study (6.80 μg/g),
other studies have recorded much lower levels of 36 μg/kg
across Europe [35]. Relatively, levels such as 0.128 and 1.095
μg/g in China [40] and Iran [41] respectively, have been reported.
Though the mean Pb level (6.80 μg/g) of foods in the present
study is higher than what has been reported in other studies, it
is consistent with findings in Ghana where relatively high levels
have been reported [6,8].
Chronic exposures to lead
The exposure to Pb, as measured by the chronic daily intake,
showed a wide variation (Table 3). The non-detection of Pb in
about 41% of the food samples analyzed resulted in no chronic
exposures to some consumers across the various age groups.
| Age group |
Min |
Max |
Central tendency metrics |
Percentiles |
| Mean |
Mode |
Median |
5th |
95th |
| |
Non-carcinogenic exposures |
| 5 - 19 |
0 |
776.21 |
8.10 |
0.03 |
2.67 |
0.09 |
33.30 |
| 20 - 39 |
0 |
725.33 |
11.32 |
0.06 |
4.32 |
0.15 |
45.88 |
| 40 and above |
0 |
1,712.12 |
16.20 |
0.02 |
4.74 |
0.13 |
68.87 |
| |
Carcinogenic exposures |
| 5 - 19 |
0 |
332.66 |
3.47 |
0.01 |
1.14 |
0.04 |
14.27 |
| 20 - 39 |
0 |
310.85 |
4.85 |
0.02 |
1.85 |
0.06 |
19.66 |
| 40 and above |
0 |
733.77 |
6.94 |
0.01 |
2.03 |
0.06 |
29.52 |
Table 3: Chronic exposures to lead (μg/kg bw-day).
A maximum non-cancer exposure of 1,712.12 μg/kg bw-day was
observed among adults (40 and above), followed by exposures of 776.21 and 725.33 μg/kg bw-day in children and adolescents (5-
19) and young adults (20-39) respectively. Though these maxima
exposures were observed, the 95th percentiles ranged between
33.30 and 68.87 μg/kg bw-day across the three consumer groups.
The trend of exposure for carcinogenic endpoints was similar
to that for the non-cancer endpoints. The modal exposures
observed in this study were very low across all age groups (0.01-
0.06 μg/kg bw-day) however, there is still cause for concern,
since there is no safe level of Pb exposure, especially in children
[15]. The median exposures of 1.14-4.74 μg/kg bw-day across the
consumer groups present a grave outlook.
From Table 3, relatively higher chronic mean exposures (3.47-
16.20 μg/kg bw-day) and 95th percentile exposures (14.27-29.52
μg/kg bw-day) across the consumer groups were obtained in
the current studies relative to some studies reported in China.
Indeed, lower mean exposures (1.601- 2.104 μg/kg bw-day) and
95th percentile exposures (2.473-3.250 μg/kg bw-day) have been
reported [40]. In fact, exposures in the present study are high
relative to lower chronic exposures in children (1.03 μg/kg bwday),
adolescents (0.55 μg/kg bw-day) and adults (0.50 μg/kg bwday)
that have been reported [35]. Relative to the findings of the
present study, where the highest exposure occurred in adults,
the EFSA study recorded the highest exposures among infants
and the lowest among adults [35]. Differences in the elements of exposure; mass of food consumed, exposure frequency and
duration and the concentration of Pb in foods, may be responsible
for the differences in findings [42]. However, there could be
differences in age limits used in classification of the age groups
relative to the EFSA study [35]. In spite of the EFSA study, another
study reported a high daily exposure to Pb (1.46 μg/kg-bw day)
among male adults (>65 years) relative to the lowest exposures
(1.11 μg/kg-bw day) among female adolescents (10-19 years)
[43]. Though these findings are relatively lower compared to the
exposures in the present study, the trend of higher intake among
adults was also observed in the present study.
Margin of exposure
Based on the prevalence of these disease endpoints among specific
age groups [11,44], the risks of developmental neurotoxicity
was characterized for children and adolescents only (age 5-19).
On the other hand, the risks of chronic kidney disease and
systolic blood pressure were characterized among young adults
(age 20-39) and adults (age 40 and above). According to EFSA
[11], the MoE for developmental neurotoxicity, which ranged
from a minimum of 0.0 (<1), imply a worst case risk, whereas
a maximum MoE of 53,951(>10) obtained in this study indicate
no appreciable risk (Table 4). Thus, MoEs greater than 10 are
deemed safe for children. Though the maximum MoE (53,951) presents a safe situation, the value might be an outlier relative
to the simulated 95th percentile value of 4.40 (<10). Thus, there is
still public health concern.
| Age group |
Min |
Max |
Central tendency metrics |
Percentiles |
| Mean |
Mode |
Median |
5th |
95th |
| 5–191 |
0.00 |
53,951 |
1.10 |
0.02 |
0.18 |
0.01 |
4.40 |
| 20–392 |
0.00 |
207,568 |
4.37 |
0.05 |
0.33 |
0.03 |
7.90 |
| 40 and above2 |
0.00 |
41,509 |
2.33 |
0.02 |
0.30 |
0.02 |
9.17 |
| 20–393 |
0.00 |
87,178 |
1.84 |
0.02 |
0.14 |
0.01 |
3.32 |
| 40 and above3 |
0.00 |
17,434 |
0.98 |
0.009 |
0.13 |
0.008 |
3.85 |
1MoEs for developmental neurotoxicity;
2MoEs for systolic blood pressure;
3MoEs for chronic kidney disease.
Table 4: Distribution metrics of MoE across consumer groups.
According to EFSA, MoEs of between 1 and 10 present a low risk
of adverse health effects to consumers, but they do not have
to be totally dismissed as of no concern [11]. Compared to the
evaluation of the present median MoE (0.18), a relatively higher
median MoE (0.57-0.66) has been reported in the Netherlands
[45]. The disparities probably arising from differences in Pb
exposures in the populations [42]. A mean MoE of 1.10 was
recorded in this study, indicating low risks, relatively, a higher
mean MoE of between 3 and 13 was reported in a study in
Ireland [44]. Similar to what was recorded in this study, the
second French total diet study recorded a mean MoE of 0.9 for
children aged between 3 and 17 [46], meaning Pb exposure is of
global concern.
The reference point (BMDL of 0.50 μg/kg bw-day) used in
computing the MoE for neurotoxicity correspond to a benchmark
response of 1% (1-point) reduction in intelligence quotient (IQ)
[11]. The high exposures recorded in this study (Table 3) indicate
possibly lower IQ scores in children in the study area. The low
modal MoE (0.02) recorded in the study area is worrying because
it is well below the recommended MoE of 10 [11]. It has been
estimated that a 1% decrease in IQ results in a 2% decrease in
worker productivity later in life [47], thus, such high exposures
are not acceptable. Again, the high level of exposures in children
may result in developmental neurotoxicity which is linked to
criminal behavior in adult life [48]. In fact, the Institute for Health
Metrics and Evaluation (IHME) has reported that 63.8% of the
global burden of idiopathic developmental intellectual disability is attributable to Pb exposure [49]. It must be a matter of grave
concern that there is high exposure to Pb among children in the
study area. Since this level of exposures could lead to increased
risks of developmental neurotoxicity in children, every effort
must not be spared to effectively manage this problem.
Also presented in Table 4 are the MoEs for cardiovascular
(systolic blood pressure) effects. A median MoE of 0.33 was
obtained for consumers aged between 20 and 39 and a median
of 0.30 for consumers aged 40 and above. A higher median MoE
of 3.7 (meaning lower risk) has been reported in other studies
[45], indicating that the findings in the present study was not
acceptable. A 95th percentile MoE of 7.90 (age 20-39) and 9.17
(age 40 and above) was obtained in this study. This is similar to
findings from a study in France where the 95th percentile MoE of
8.0 was obtained for consumers aged between 18 and 79 [46].
On the basis of the 95th percentile, exposures in the present
study are safer relative to what has been reported in Canada
(0.81) [50]. However, a worrying trend of MoEs was consistently
observed in the adult population relative to the younger
population. For instance, the most frequent (modal) MoE (0.05)
was recorded among consumers aged between 20 and 39 and
an even lower modal MoE (0.02) among consumers aged 40 and
above. These MoEs are lower than 1 and present significantly
unacceptable risks of cardiovascular toxicity which is manifested
as an increase in systolic blood pressure [11]. Such increases have
been linked to the occurrence of cardiovascular disorders such
as stroke, heart attack and coronary artery disease [18]. In fact,
the IHME estimates that 3.1% and 3% of the global burden of
stroke and coronary artery disease respectively, is attributable to
Pb exposure [49].
The effects of increasing systolic blood pressure have also been
linked to increased incidences of chronic kidney disease. In this
study, the risk of chronic kidney disease has been characterized
and the MoEs presented in Table 4. MoEs of 3.32 and 3.85 (95th percentiles) were obtained for consumers between 20 to 39
years and consumers above 40 years respectively. This indicate
very low risks (MoE between 1 and 10) among the low exposed
groups of consumers in these age groups. Relative to the 95th percentile MoE of 0.90 obtained in Netherlands [45], the present
study presented relatively safer outcome(3.32-3.85). Relatively
lower risks also prevailed in Ireland, where a median MoE ranging
between 5 and 16 was reported compared to what was obtained
in this study (Table 4) [44]. Variations that are common among
the findings of this study and other studies could be attributable
to different population characteristics and concentration of
Pb found in their diets [42]. Though a modal MoE of 0.02 was
recorded for the age group 20-39, in the current study, an even
lower modal MoE of 0.009 was obtained for consumers aged
40 and above. The implication of these findings is that most of
the consumers are likely to be at risk (MoE<1) of chronic kidney
disease.
Lifetime cancer risk
From Table 5, the risk of carcinogenesis ranged from cases of
acceptable risk (0), observed across all groups of consumers, to
a highest of 6.24 × 10⁻³ (6 out of 1000 persons at risk) which was
observed among consumers aged 40 and above.
| Age group |
Min |
Max
×10-3 |
Central tendency metrics |
Percentiles |
Mean
×10-5 |
Mode
×10-7 |
Median
×10-5 |
5th
×10-7 |
95th
×10-4 |
| 5 - 19 |
0 |
2.83 |
2.95 |
1.22 |
0.97 |
3.32 |
1.21 |
| 20 - 39 |
0 |
2.64 |
4.13 |
2.06 |
1.57 |
5.52 |
1.67 |
| 40 and above |
0 |
6.24 |
5.90 |
0.60 |
1.73 |
4.72 |
2.51 |
Table 5: Lifetime cancer risk of consumer groups.
The modal risks obtained in the present study is relatively lower
compared to the risk range of 1.3 × 10⁻⁴ and 2.4 × 10⁻⁴ reported
in Malaysia [51]. The differences between this current study and
the study in Malaysia could be arising from the approaches of the
two studies since their study used a deterministic approach. It has
been reported that deterministic approaches are conservative
and do not account for variability in elements of exposure due
to the use of single estimates [52]. From Table 5, lower cancer risks were obtained for consumers between the ages of 5 and
19, relative to consumers in age groups: (20-39) and those aged
40 and above. The trend reported in this study is in contrast with
findings from another study where higher risks were observed
in children [53]. The differences might be resulting from the
approach of the study. While the lifetime exposure method
(Equation 1) was used in this study, the other study [53] used the
average daily intake or estimate daily intake (EDI) method.
Cancer risks have a de minimis (acceptable risk) of 1 × 10⁻⁶,
therefore risk estimates lower than the de minimis present
acceptable risks to consumer populations [12]. Since a risk
value (median) of 9.7 × 10⁻⁶ (10 out of 1 million) was observed
in consumers aged between 5 and 19, it implies the risk is
unacceptable (Table 5). While the modal ILTCR was acceptable
among all the age groups (<10-6), the 50th percentiles presented cautiously acceptable risks (2 × 10⁻⁵) of ‘2
out of 100 thousand’ consumers for the two adult consumers
groups. Again, this must be interpreted carefully since the 95th percentiles across all three consumer groups show unacceptable
risk (<10-4), below the risk management threshold (1 × 10⁻⁴ ) set
by US EPA [54].
The regression analysis of the risk descriptors as presented in Table 6 shows the highest standardized regression (β) coefficients across all the three consumer groups to be concentration of Pb (C). This means the highest impact on the risk were all from the concentration of Pb in the foods analyzed.
| Age group |
C |
MF |
EF |
ED |
BW |
| 5 - 19 |
0.47 |
0.34 |
0.21 |
0.28 |
-0.14 |
| 20 - 39 |
0.55 |
0.26 |
0.24 |
0.36 |
-0.09 |
| 40 and above |
0.44 |
0.24 |
0.20 |
0.42 |
-0.07 |
Table 6: Standardized regression coefficients (β) of risk factors.
There is paucity of information regarding the impact (standardized
regression coefficient) of elements of exposure on risk estimates.
However, a study on some hazards [29], in the same study area,
showed that the concentration of hazard had the highest impact
on risk, similar to what was observed in the present study. For the
young adults age group (20-39), the exposure duration (β=0.36)
and mass of food consumed (β=0.26), had the next higher impacts.
The reverse was observed in children and teenagers (5-19) where
the mass of food consumed had a bigger impact (β=0.34) on
cancer risk relative to the exposure duration (β=0.28). The body
weights of all three consumer groups had negative regression
coefficients. This implies that higher body weight of consumers
had a negative impact on the cancer risk. This observation does
not suggest that in managing the risk of cancer in this study area,
increased body weight should be recommended. It simply means
that there is an inverse relationship between risk and body
weight. Risk management efforts of Pb must rather focus on the
reduction of the concentration of Pb in the diets of consumers.
Conclusion
This study showed the presence of Pb in 59% of the ‘frequently
consumed foods’ analyzed, with a median concentration of 2.4
μg/g. A trend of lower chronic exposures was observed in children
and adolescents (5-19) as compared to the exposures in young
adults and adults (≥ 40). Though low modal non-carcinogenic
exposures of 0.01-0.06 μg/kg bw-day were found in the study
area, the high 95th percentile exposures (33.30-68.87 μg/kg bwday)
suggest significant consumers might be at risk. This fact
was further buttressed by the findings from the carcinogenic
exposures. Very low modal MoEs (0.009-0.05) were recorded
for all consumers in the study area, indicating that most children
in the study area were at risk of developmental neurotoxicity.
Adults, on the other hand, were at risk of chronic kidney disease
and increased systolic blood pressure. Though the modal cancer
risks (1.22 × 10⁻⁷ - 6.0 × 10⁻⁸) were below de minimis (1×10⁻⁶),
the 95th percentile risks (1.21 ×10⁻⁴ - 2.51 × 10⁻⁴) across the three
consumer groups were above the threshold (1 × 10⁻⁴) required
for management action. Thus, findings from this study indicate
that there is the need for sustained or regular risk assessment to
inform risk management actions.
Acknowledgements
We acknowledge the services of Mr. Ebenezer Asante Donkor of
the Central Laboratories, Kwame Nkrumah University of Science
and Technology, Kumasi.
Funding
This research received no grant from any funding agency in the
public, commercial, private, or not-for-profit sectors.
Declaration of Competing Financial
Interests
The authors declare they have no actual or potential competing
financial interests.
Contribution of Authors
Edmund O. Benefo, collected and processed the data and also
drafted the initial manuscript; Gloria M. Ankar-Brewoo and
Herman E. Lutterodt, made critical suggestions to the initial
manuscript while correcting certain portions; Michelle Oppong
Siaw collected and processed parts of the data for this manuscript.
Isaac W. Ofosu, designed the study and made significant
corrections of the draft manuscript prior to submission.
References
- Lim SS, Vos T, Flaxman AD, Danaei G, Shibuya K, et al. (2012) A comparative risk assessment of burden of disease and injury attributable to 67 risk factors and risk factor clusters in 21 regions, 1990-2010: a systematic analysis for the Global Burden of Disease Study 2010. Lancet 380: 2224-2260.
- Stanaway JD, Afshin A, Gakidou E, Lim SS, Abate D, et al. (2018) Global, regional, and national comparative risk assessment of 84 behavioural, environmental and occupational, and metabolic risks or clusters of risks for 195 countries and territories, 1990–2017: a systematic analysis for the Global Burden of Disease Study 2017. Lancet 392: 1923-1994.
- Flora G, Gupta D, Tiwari A (2012) Toxicity of lead : a review with recent updates. Interdiscip Toxicol 5: 47-58.
- Alam MGM, Snow ET, Tanaka A (2003) Arsenic and heavy metal contamination of rice, pulses and vegetables grown in Samta village, Bangladesh. Sci Total Environ 308: 83-96.
- UNEP (United Nations Environment Programme). Final review of scientific information on lead. 2010. UNEP Chemical Branch, DTIE.
- Adei E, Forson-Adaboh K (2008) Toxic (pb, cd, hg) and essential (fe, cu, zn, mn) metal content of liver tissue of some domestic and bush animals in ghana. Food Addit Contam Part B Surveill 1: 100-105.
- Boadi N, Mensah J, Twumasi S, Badu M, Osei I (2012) Levels of selected heavy metals in canned tomato paste sold in Ghana. Food Addit Contam Part B Surveill 5: 50-54.
- Ofosu IW, Akomea-Frimpong S, Owusu-Ansah ED-GJ, Darko G (2018) Exposure and risk assessment of selected chemical hazards in cabbage and lettuce. J Toxicol Risk Assess 4: 1-10.
- EFSA (European Food Safety Authority). (2006) EFSA/WHO international conference with support of ILSI Europe on risk assessment of compounds that are both genotoxic and carcinogenic., Brussels, Belgium.
- Hardy A, Benford D, Halldorsson T, Jeger MJ, Knutsen KH, et al. (2017) Update: use of the benchmark dose approach in risk assessment. EFSA J 15: 4658.
- EFSA (European Food Safety Authority).(2010) Scientific opinion on lead in food. EFSA J 8: 1570.
- Gerba CP (2004) Risk assessment and environmental regulations. Environ Monit Charact Amsterdam: Elsevier, Pp: 377-392.
- Neal AP, Guilarte TR (2013) Mechanisms of lead and manganese neurotoxicity. Toxicol Res (Camb) 2: 99-114.
- Lanphear BP, Hornung R, Khoury J, Yolton K, Baghurst P, et al. (2005) Low-level environmental lead exposure and children’s intellectual function: an international pooled analysis. Environ Health Perspect 113: 894-899.
- Bellinger DC (2008) Very low lead exposures and children’s neurodevelopment. Curr Opin Pediatr 20: 172-177.
- Zhang J, Cao H, Zhang Y, Zhang Y, Ma J, et al. (2013) Nephroprotective effect of calcium channel blockers against toxicity of lead exposure in mice. Toxicol Lett 218: 273-280.
- Zheutlin AR, Hu H, Weisskopf MG, Sparrow D, Vokonas PS, et al. (2018) Low‐level cumulative lead and resistant hypertension: a prospective study of men participating in the veterans affairs normative aging study. J Am Heart Assoc 7: e010014.
- Vaziri ND (2008) Mechanisms of lead-induced hypertension and cardiovascular disease. Am J Physiol Circ Physiol 295: H454-465.
- IARC (2006) Inorganic and organic lead compounds. IARC monographs on the evaluation of carcinogenic risks to humans. International Agency for Research on Cancer Vol 87.
- Silbergeld EK (2003) Facilitative mechanisms of lead as a carcinogen. Mutat Res 533: 121-133.
- Lundström NG, Englyst V, Gerhardsson L, Jin T, Nordberg G (2006) Lung cancer development in primary smelter workers: a nested case-referent study. J Occup Environ Med 48: 376-380.
- Menke A, Muntner P, Batuman V, Silbergeld EK, Guallar E (2006) Blood lead below 0.48 μmol/L (10 μg/dL) and mortality among US adults. Circulation 114: 1388-1394.
- Khalil N, Wilson JW, Talbott EO, Morrow LA, Hochberg MC, et al. (2009) Association of blood lead concentrations with mortality in older women: a prospective cohort study. Environ Heal 8: 15.
- Mushak P (2011) Lead and public health: science, risk and regulation. London: Elsevier.
- Moy GG (2013) Total diet studies-total diet studies-what they are and why they are important. In: Moy GG, Vannoort RW, editors. Total Diet Stud., New York: Springer, Pp: 3-10.
- Kim C, Lee J, Kwon S, Yoon H (2015) Total diet study : for a closer-to-real estimate of dietary exposure to chemical substances 31: 227-240.
- Wang L, Wang H, Hu M, Cao J, Chen D, et al. (2009) Oxidative stress and apoptotic changes in primary cultures of rat proximal tubular cells exposed to lead. Arch Toxicol 83: 417-427.
- Specht AJ, Lin Y, Weisskopf M, Yan C, Hu H, et al. (2016) XRF-measured bone lead ( Pb ) as a biomarker for Pb exposure and toxicity among children diagnosed with Pb poisoning XRF-measured bone lead (Pb) as a biomarker for Pb exposure and toxicity among children diagnosed with Pb poisoning. Biomarkers 21: 347-352.
- Oppong Siaw M, Ofosu IW, Lutterodt HE, Ankar-Brewoo GM (2018) Acrylamide exposure and risks in most frequently consumed foods in a total diet study. Am J Food Sci Technol 6: 123-137.
- Altundag H, Tuzen M (2011) Comparison of dry, wet and microwave digestion methods for the multi element determination in some dried fruit samples by ICP-OES. Food Chem Toxicol 49: 2800–2807.
- JECFA (Joint FAO/WHO Expert Committee on Food Additives) (2005) Sixty-fourth meeting of the Joint FAO/WHO expert committee on food additives. No. JECFA/64/C.
- OEHHA (Office of Environmental Health Hazard Assessment) (2009) Appendix A : Hot Spots Unit Risk and Cancer Potency Values A-1 Appendix A : Hot Spots Unit Risk and Cancer Potency Values A-2. pp: 1-89. California Environmental Protection Agency, Sacramento, CA.
- Zazouli MA, Bandpei AM, Ebrahimi M, Izanloo H (2010) Investigation of cadmium and lead contents in iranian rice cultivated in babol region. Asian J Chem 22: 1369-1376.
- Lee HS, Cho YH, Park SO, Kye SH, Kim BH, et al. (2006) Dietary exposure of the Korean population to arsenic, cadmium, lead and mercury. J Food Compos Anal 19: S31-37.
- EFSA (European Food Safety Authority) (2012) Lead dietary exposure in the European population. EFSA J 10: 2831.
- Norton GJ, Williams PN, Adomako EE, Price AH, Zhu Y, et al. (2014) Lead in rice: analysis of baseline lead levels in market and field collected rice grains. Sci Total Environ 485: 428-434.
- Clemens S, Ma JF (2016) Toxic heavy metal and metalloid accumulation in crop plants and foods. Annu Rev Plant Biol 67: 489-512.
- Kwofie S, Andrews A, Mensah E (2011) The quality of locally-manufactured corn- mill grinding plates. J Sci Technol 31: 152-159.
- Kwakye MO, Mengistie B, Ofosu-Anim J, Nuer ATK, Van den Brink PJ (2018) Pesticide registration, distribution and use practices. Environ Dev Sustain 2018: 1-25.
- Jin Y, Liu P, Sun J, Wang C, Min J, et al. (2014) Dietary exposure and risk assessment to lead of the population of Jiangsu province, China. Food Addit Contam - Part A Chem Anal Control Expo Risk Assess 31: 1187-1195.
- Ghasemidehkordi B, Malekirad AA, Nazem H, Fazilati M, Salavati H, et al. (2018) Concentration of lead and mercury in collected vegetables and herbs from Markazi province, Iran: a non-carcinogenic risk assessment. Food Chem Toxicol 113: 204-210.
- WHO (World Health Organisation) (2014) Dietary exposure assessment of chemicals in food. Environ Heal Criteria 240 Princ. methods risk Assess Chem food.
- Martorell I, Perelló G, Martí-Cid R, Llobet JM, Castell V, et al. (2011) Human exposure to arsenic, cadmium, mercury and lead from foods in catalonia, spain: temporal trend. Biol Trace Elem Res 142: 309-322.
- FSAI (Food Safety Authority of Ireland). Report on a total diet study carried out by the food safety authority of ireland in the period 2012-2014. 2016. Dublin, Ireland.
- NIPHE (National Institute for Public Health and the Environment). Dietary exposure to lead in the Netherlands. Bilthoven: 2017.
- Arnich N, Sirot V, Rivière G, Jean J, Noël L, et al. (2012) Dietary exposure to trace elements and health risk assessment in the 2nd French Total Diet Study. Food Chem Toxicol 50: 2432-2449.
- Grosse SD, Matte TD, Schwartz J, Jackson RJ (2002) Economic gains resulting from the reduction in children’s exposure to lead in the United States. Environ Health Perspect 110: 563-569.
- Fergusson DM, Boden JM, Horwood LJ (2008) Dentine lead levels in childhood and criminal behaviour in late adolescence and early adulthood. J Epidemiol Community Health 62: 1045-1050.
- IHME (Institute for Health Metrics and Evaluation). New Microsoft Word Document (2). Glob Burd Dis 2018.
- Juric AK, Batal M, David W, Sharp D, Schwartz H, et al. (2018) Risk assessment of dietary lead exposure among First Nations people living on-reserve in Ontario, Canada using a total diet study and a probabilistic approach. J Hazard Mater 344: 55-63.
- Praveena SM, Omar NA (2017) Heavy metal exposure from cooked rice grain ingestion and its potential health risks to humans from total and bioavailable forms analysis. Food Chem 235: 203-211.
- Lambe J (2002) The use of food consumption data in assessments of exposure to food chemicals including the application of probabilistic modelling. Proc Nutr Soc 61: 11-18.
- Islam MS, Ahmed MK, Habibullah-Al-Mamun M, Raknuzzaman M (2015) The concentration, source and potential human health risk of heavy metals in the commonly consumed foods in Bangladesh. Ecotoxicol Environ Saf 122: 462-469.
- US EPA (United States Environmental Protection Agency). US E. Reg Remov Manag Levels Chem 2018.