Ryan D. Francis1,2, Perceval S. Bahado-Singh1,2, Ann Marie Smith1,2, Andrew O. Wheatley2 and Helen N. Asemota2,3*
1Scientific Research Council, University of the West Indies Mona, Jamica
2The Biotechnology Centre, University of the West Indies Mona, Jamica
3Department of Basic Medical Sciences, University of the West Indies Mona, Jamica
Corresponding Author:
Helen N. Asemota
Department of Basic Medical Sciences
University of the West Indies Mona, Jamiaca
Tel: +86-10-82106381
E-mail: helen.asemota@uwimona.edu.jm
Received Date: April 28, 2018; Accepted Date: May 18, 2018; Published Date: May 28, 2018
Citation: Francis RD, Bahado-Singh PS, Smith AN, Wheatley AO, Asemota HN, et al. (2018) Glycemic Index in the Development of Functional Beverage. Eur Exp Biol Vol. 8 No. 3:15. doi:10.21767/2248-9215.100056
Copyright: © 2018 Francis RD, et al. This is an open-access article distributed under the terms of the Creative Commons Attribution License, which permits unrestricted use, distribution, and reproduction in any medium, provided the original author and source are credited.
Keywords
Glycemic index; Glycemic load; Diabetes; Glucose
Introduction
Diabetes mellitus (DM) is one of the leading causes of death in many countries; therefore, an effective method of management is of absolute importance. This metabolic disorder is characterized by high blood glucose level and abnormalities in carbohydrate, protein and fat metabolism [1]. Due to the limitations of current therapies for DM, there remains interest in alternative treatments. It is often reported that increased consumption of dietary fiber may lead to better control and management of diabetes mellitus, cancer and cardiovascular diseases.
The physical and chemical profiles of dietary fiber, such as, fibrous structure and viscosity have a major role in the digestion and absorption of nutrients, despite the amount of available carbohydrate [2]. The effect a carbohydrate has on post-prandial blood glucose concentration is best described by its glycemic indices (GI). The GI can be defined as a relative ranking of carbohydrate in foods on a scale of 0 to 100, based on the extent to which they increase blood glucose levels after consumption [3-6]. Carbohydrates that are rapidly digested and release glucose quickly into the bloodstream are referred to as high GI. Those that take a relatively longer time to break down and release glucose moderately into the bloodstream have a low glycemic index [5,7-10].
Both the amount and the quality of carbohydrate may affect blood glucose response; this is documented as the glycemic load [5,6]. Glycemic load (GL) investigates the total impact of the dietary carbohydrate on blood glucose level after meal. The GL of a serving of food is the mathematical product of the amount of available carbohydrate (g) in that serving and the glycemic index of the food divided by 100 [3,11-13]. The higher the GL of the food, the greater the rise of blood glucose and insulin levels. Long-term consumption of a high GL diet has been linked with increased risk of type 2 diabetes and related complications [4,8,12,14-17] Research has shown that consuming low GI foods is a possible inexpensive dietary alternative in the management of diabetes [3,6,18-20].
The nutritional benefits of fruits and vegetables make them a good choice for weight and health management [21]. Therefore, it is important that the GI of our fruits and vegetables be determined to better guide the choices of the consumer. It was reported that the GI values of the same type of fruits cultivated in different geographical location may vary and could be due to the environmental conditions or difference in sugar composition, fiber content, stage of ripening, acid content, presence of anti nutrients, method of storage and harvesting or it could be the methods used to determine the GI of the test foods [22-25]. This study investigated the glycemic index (GI) of commonly available and consumed fruits and vegetables in Jamaica.
Materials and Methods
Food samples
Freshly harvested, Pineapple (Ananas comosus), Otaheite apple (Syzygium malaccense), June plum (Spondias dulcis) and Cucumber (Cucumis sativus) were sourced from a local market in Kingston, Jamaica.
Methods
Adult Jamaican subjects between the ages of 25 to 45 years were recruited among the students and staffs of the University of the West Indies (Mona Campus). Ten healthy subjects, with an active lifestyle, not using any prescribed medication and without any diagnosed diseases were selected for study. Exclusion criteria were as follows: Smokers, overweight, obese, diabetic individuals and pregnant or lactating women.
Proximate analysis for carbohydrate, fat, crude protein, moisture, dietary fiber content and ash were determined using the AOAC (2002) standard. Total carbohydrate was done by difference according to FAO/WHO Expert Consultation protocol (Food and Agriculture Organization & World Health Organization, 1998).
Proportion of fruits equivalent to 50 (or 25) grams of available carbohydrate was fed to subjects after an overnight fast and their serum glucose levels were determined at 0, 15, 30, 45, 60, 90 and 120 minutes. The incremental areas under the curve (IAUC) were calculated accordingly [26]. A cup of glucose, 25 g in 250 mL was used as a standard, which was assigned a GI of 100. Glucose was tested on three separate occasions, and the test foods once.
The GI rating (%) for each food, was calculated for each subject by expressing the IAUC of the test food as a percentage of the average IAUC of the glucose standard consumed by that volunteer [27,28]. The protocol was approved by the Ethics Committee of the University Hospital of the West Indies and the Faculty of Medical Sciences at the University of the West Indies Mona Campus, Kingston, Jamaica (Ethical approval number: AN 14, 12/13).
Statistical analysis
Data obtained from the experiments are expressed as mean ± SE. Differences between the control and the treatments in the experiments were analyzed using ANOVA and Duncan’s multiple range test, while values of P ≤ 0.05 were considered significant.
Results
The 10 Jamaican subjects, comprising five (5) males and five (5) females were between ages 25 and 45 years with a mean age of 30 ± 2 years and BMI 25 ± 1 kg/m2. (Table 1) represents the proximate compositions of the foods studied. Cucumber was found to have the highest crude protein content (0.49 %), while Otaheite apple had the lowest (0.05 %).
| Samples |
(%) Crude Protein |
(%) Ash |
(%) Moisture |
(%) Total Sugars |
(%) Crude Fiber |
(%) Carbohydrate |
| Otaheite Apple |
0.05 |
0.19 |
90.9 |
6.53 |
4.01 |
8.86 |
| Pineapple |
ND |
40.2 |
104 |
14.1 |
0.03 |
17.88 |
| June Plum |
0.33 |
NA |
NA |
7.69 |
1.15 |
14.87 |
| Cucumber |
0.49 |
0.44 |
95.4 |
2.7 |
0.54 |
4.15 |
ND – None Detected
NA – Not Applicable
Table 1. Proximate composition of eight food samples (100 g) studied.
Percentage ash was highest in pineapple (40.2) and lowest in Otaheite apple (0.19). The moisture content of the foods was highest in pineapple (104 %) and lowest in Otaheite apple (90.9 %). Similarly, Pineapple was found to have the highest total sugars (14.1 %) and cucumber the lowest (2.7 %). Crude fiber content was highest in Otaheite apple (4.01 %), while pineapple had the lowest fiber content of (0.03 %). The carbohydrate content was highest in pineapple (17.88 %) and lowest in cucumber (4.15 %).
(Table 2) shows the GI values of the food samples determ ined relative to the reference food (glucose GI = 100) and categorized as high (70 to 100), intermediate/medium (55 to 69), or low (<55). The GI of the test food samples ranged from 13 ± 5 to 80 ± 20. June plum was observed to have the lowest of 13 ± 5; this was followed by cucumber (26 ± 6) and Otaheite apple (64 ± 15). The highest GI was observed in pineapple (80 ± 20). Otaheite apple showed the highest incremental area under the glucose response curve (IAUC) of 122 ± 29 and June plum the lowest with 23 ± 6. The GL (High ≥ 20, Medium 11-19 and low ≤ 10) of June plum, cucumber, Otaheite apple and pineapple were 1.3, 1.5, 6.4 and 8, respectively, (Figure 1) illustrates the mean glucose responses of the four food samples studied. The blood glucose response to the food samples increased with time, reaching their peak at 15 minutes, after which a decline in the response with increasing time was observed.
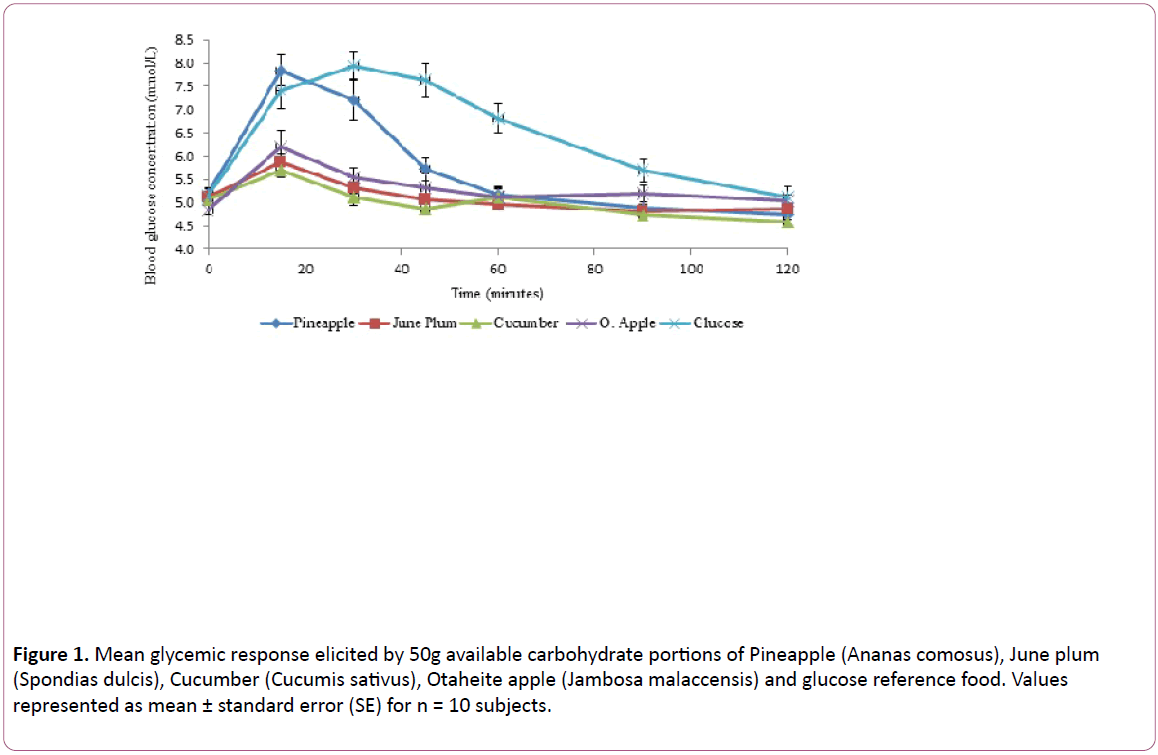
Figure 1: Mean glycemic response elicited by 50g available carbohydrate portions of Pineapple (Ananas comosus), June plum (Spondias dulcis), Cucumber (Cucumis sativus), Otaheite apple (Jambosa malaccensis) and glucose reference food. Values represented as mean ± standard error (SE) for n = 10 subjects.
Discussion
It has long been recognized that “not all carbohydrates are created equal” with regard to their effects on glucose metabolism and insulin action [29]. Also it is understood that different complex carbohydrates could have different physiological effects. Foods with high GI are reported to have a deleterious effect on health and therefore should be avoided [1,23].
This study was done to determine the glycemic indices and glycemic load of fruits and vegetables that are frequently consumed in the Caribbean, thus contributing to the Caribbean Glycemic Index Database. The glycemic indices of the selected fruits and vegetables ranged from 13 to 80 (Table 2). The results showed that at fixed quantities of available carbohydrate, there were distinct variations in the glucose response. This supports the knowledge that equal carbohydrate portions of different foods can display different glycemic response on human subjects. To give good dietary guidance, it is important to know the glycemic index of the food consumed in different ethnic groups. In this study the GI of pineapple was determined to be high (80 ± 20). Similar result was reported in Malaysia, where researchers reported high GI of pineapple (82 ± 4). However, in the Philippines the GI of pineapple was determined to be medium (59 ± 8). Similarly, Otaheite apple GI was determined to be medium (64 ± 15), while apples in Denmark (28) and Canada (34) were reported as low GI using type 2 diabetic subjects compared with glucose reference food [22,30].
| Food |
GI |
GI ranking |
GL |
GL ranking |
IAUC |
Glucose standard |
| June plum |
13 ± 5a |
Low |
1.3 |
Low |
23 ± 6a |
205 ± 26 |
| Cucumber |
21 ± 6a |
Low |
1.5 |
Low |
40 ± 14a |
191 ± 33 |
| Othaeite Apple |
64 ± 15b |
Medium |
6.4 |
Low |
122 ± 29b |
207 ± 26 |
| Pineapple |
80 ± 20b |
High |
8 |
Low |
96 ± 15b |
154 ± 34 |
Subscripts with different letters are significantly different (P < 0.05)
Values are mean ± SE for n = 10 subjects
Glycemic index (GI) for each sample was calculated by expressing the IAUC as a percentage of the mean response area of glucose as outlined [26]
Table 2. Glycemic indices and incremental areas under the glucose response curve (IAUC) for eight food samples studied.
GI variability in the same type of fruit grown in different locations may be due to growing conditions or differences in sugar composition of the fruits. During the process of fruit ripening, the nutritional composition of the fruit changes. In addition, the time of harvesting, duration and method of storage may also influence the nutrient composition [25]. The GI of June plum and cucumber were observed to be low (13 ± 5 and 21 ± 6, respectively). Similar results were documented by researchers in Bangladesh when healthy subjects consumed raw plums using glucose as reference food [30]. The low GI could be due to the fiber content of the raw plum. The dietary fiber could alter the digestion and adsorption of the carbohydrate present and thereby influence blood glucose response. The presence of fat and acidity may also alter blood glucose response indirectly by slowing down gastric emptying, resulting in slower rate of digestion with subsequent reduction in glucose absorption [9,31,32].
In this study we also determined the GL values of the test foods (Table 2). This assesses the glycemic effect of the serving sizes of different foods. The GL of the test fruits and vegetables were determined to be low GL foods based on the Jamaican serving sizes [33]. The glycemic index of the June plum, cucumber and Otaheite apple suggests that they may have beneficial health effects since June plum and cucumber had low GI and Otaheite apple had medium GI. In addition, the GL for all the fruits and vegetables assessed were low. However, only foods with low GI and GL should be recommended when promoting health and disease prevention [34,35]. Due to the quality (GI) and amount (GL) of carbohydrates in the June plum and cucumber, these foods may be beneficial when consumed as part of a healthy or diabetic diet.
The IAUC and GI (Table 2) of June plum and cucumber were significantly lower than pineapple and Otaheite apple. (Figure 1) indicated that the test foods showed an initial peak at approximately 15 minutes, followed by a gradual decrease in blood glucose. The initial peak for pineapple was significantly higher than all the other fruits with a value (7.9 mmol/L) similar to that observed with the glucose standard (8.0 mmol/L). Fiber rich foods with low postprandial blood glucose are often considered precious. High fiber is reported to be able to reduce blood glucose response and therefore lower GI value. Fruits and vegetables are generally recommended to be a part of a healthy diet because of their high nutritional values. The low glucose peak displayed by June plum and cucumber may lead to low demand for insulin secretion from pancreatic Beta-cells. These are promising results in terms of their recommendation to patients with diabetes as well as healthy subjects [3,6,19,20].
Conclusion
From the present study, the glycemic index of June plum (13 ± 5), Cucumber (21 ± 6), were shown to have low glycemic index values, whereas Otaheite apple (64 ± 15) was intermediate and Pineapple (80 ± 20) high. It is reported that reduced consumption of high GI foods and increased intake of low and intermediate GI may lead to better management of diabetes, coronary heart disease and obesity [8,19]. Therefore, it is important that low and intermediate GI foods be identified and their consumption recommended.
Acknowledgement
It is our pleasure to express profound gratitude to the Faculty of Medical Sciences (UWI), Biotechnology Centre (UWI), Scientific Research Council (SRC), National Health Fund (NHF) and UWI Yam Group for their contributions to this study.
References
- Adebayo BC, Oboh G, Akindahunsi AA (2015) Estimated glycemic indices and inhibitory action of some yam (Dioscorea sp.) products on key enzymes linked with type 2 diabetes. Futa J Res Sci 11: 25-35.
- Fatema K, Sumi N, Rahman F, Kobura K, Ali L (2011) Glycemic index determination of vegetables and fruits in health Bangladwshi subjects. Malay J Nutri 17: 393-399.
- Bhupathiraju SN, Tobias DK, Malik VS, Pan A, Hruby A, et al. (2014) Glycemic index, glycemic load, and risk of type 2 diabetes: results from 3 large US cohorts and an updated meta-analysis. Amer J Clin Nutri 2014: 1-15.
- Foster-Powell K, Holt SH, Brand-Miller JC (2002) International table of glycemic index and glycemic load values: 2002. Amer J Clin Nutri 76: 5-56.
- Jenkins DJ, Wolever TM, Taylor RH, Barker H, Fielden H, et al. (1981) Glycemic index of foods: a physiological basis for carbohydrate exchange. Amer J Clin Nutri 34: 362-366.
- Ludwig DS (2002) The glycemic index: physiological mechanisms relating to obesity, diabetes, and cardiovascular disease. Jama 287: 2414-2423.
- Atayoglu AT, Soylu M, Silici S, Inanc N (2016) Glycemic index values of monofloral Turkish honeys and the effect oftheir consumption on glucose metabolism. Turk J Med Sci 46: 483-488.
- Augustin LS, Kendall CW, Jenkins DJ, Willett WC, Astrup A, et al. (2015) Glycemic index, glycemic load and glycemic response: an International Scientific Consensus Summit from the International Carbohydrate Quality Consortium (ICQC). Nutri Metab Cardiovas Dis 25: 795-815.
- Brand-Miller JC, Foster-Powell K, Atkinson F (2014) The low GI shopper’s guide to GI values 2014: the authoritative source of glycemic index values for more than 1.200 foods. Da Capo Press, Philadelphia.
- Raheli? D, Jenkins A, Božikov V, Pavi? E, Juri? K, et al. (2011) Glycemic index in diabetes. Collegium Antropologicum 35: 1363-1368.
- Barclay AW, Petocz P, McMillan-Price J, Flood VM, Prvan T, et al. (2008) Glycemic index, glycemic load, and chronic disease risk- a meta-analysis of observational studies. Amer J Clin Nutri 87: 627-637.
- Esfahani A, Wong JM, Mirrahimi A, Srichaikul K, Jenkins DJ, et al. (2009) The glycemic index: physiological significance. J Amer Coll Nutri 28: 439-445.
- Sluijs I, Beulens JW, van der Schouw YT, Buckland G, Kuijsten A, at al. (2013) Dietary glycemic index, glycemic load, and digestible carbohydrate intake are not associated with risk of type 2 diabetes in eight European countries. J Nutri 143: 93-99.
- Miller JC (1994) Importance of glycemic index in diabetes. Amer J Clin Nutri 59: 747-752.
- Schulze MB, Liu S, Rimm EB, Manson JE, Willett WC, et al. (2004) Glycemic index, glycemic load, and dietary fiber intake and incidence of type 2 diabetes in younger and middle-aged women. Amer J Clin Nutri 80: 348-356.
- Schwingshackl L, Hoffmann G (2013) Long-term effects of low glycemic index/load vs. high glycemic index/load diets on parameters of obesity and obesity-associated risks: a systematic review and meta-analysis. Nutri Metab Cardiovas Dis 23: 699-706.
- Willett W, Manson J, Liu S (2002) Glycemic index, glycemic load, and risk of type 2 diabetes. Amer J Clin Nutri 76: 274-280.
- Bahado-Singh PS, Wheatley AO, Ahmad MH, Morrison EY, Asemota HA (2006) Food processing methods influence the glycemic indices of some commonly eaten West Indies carbohydrate-rich foods. British J Nutri 96: 476-481.
- Brand-Miller J, Holt S, Pawlak D, McMillan J (2002) Glycemic Index and Obesity. Amer J Clin Nutri 76: 281-285.
- Sun L, Lee DEM, Tan WJK, Ranawana DV, Quek YCR, et al. (2015) Glycaemic index and glycaemic load of selected popular foods consumed in Southeast Asia. British J Nutri 113: 843-848.
- Fatema K, Rahman F, Sumi N, Kobura K, Afroz A, et al. (2011) Glycemic and insulinemic responses to pumpkin and unripe papaya in type 2 diabetic subjects. Int J Nutri Metab 3: 1-6.
- Robert SD, Ismail AAS, Winn T, Wolever TM (2008) Glycemic index of common Malaysian fruits. Asia Pac J Clin Nutri 17: 35-39.
- Passos TU, Sampaio HADC, Sabry MOD, Melo MLPD, Coelho MAM, et al (2015) Glycemic index and glycemic load of tropical fruits and the potential risk for chronic diseases. Food Sci Tech (Campinas) 35: 66-73.
- Premanath M, Gowdappa HM, Mahesh M, Babu MS (2011) A study of glycemic index of ten Indian fruits by an alternate approach. E-Int Sci Res J 3: 11-18.
- Ha MA, Mann JI, Melton LD, Lewis-Barned NJ (1992) Relationship between the glycaemic index and sugar content of fruits. Diab Nutri Metab 5: 199-203.
- Brouns F, Bjorck I, Frayn KN, Gibbs AL, Lang V, et al. (2005) Glycemic Index Methodology. Nutri Res Rev 18: 145-171.
- FAO, WHO (1998). Carbohydrates in human nutrition. Geneva.
- Karthik D, Ravikumar S (2011) A Study on the Protective Effect of Cynodon dactylon Leaves Extract in Diabetic Rats. Biomed Env Sci 24: 190-199.
- Bahado-Singh PS, Riley CK, Wheatley AO, Lowe HI (2011) Relationship between processing method and the glycemic indices of ten sweet potato (Ipomoea batatas) cultivars commonly consumed in Jamaica. J Nutri Metab 2011: 1-6.
- Atkinson FS, Foster-Powell K, Brand-Miller JC (2008) International tables of glycemic index and glycemic load values: 2008. Diab Care, 31: 2281-2283.
- Truswell AS (1992) Glycemic index of foods. Euro J Clin Nutri 46: 91-101.
- Chang KT, Lampe JW, Schwarz Y, Breymeyer KL, Noar KA, et al. (2012) Low glycemic load experimental diet more satiating than high glycemic load diet. Nutri Can 64: 666-673.
- Zephirin M, Hagley K (1994) Meal planning for diabetes. Kingston. The Caribbean Food and Nutrition Institute.
- Egan N, Read A, Riley P, Atiomo W (2011) Evaluating compliance to a low glycaemic index (GI) diet in women with polycystic ovary syndrome (PCOS). BMC Research notes 4: 53.
- Salehi M, Yousefinejad A, Pishdad G (2012) The effect of a diet education with six iso-caloric meals on the body weight and blood glucose of diabetes type 2 patients. Food Sci Tech 32: 329-333.