Keywords
Geospatial analysis; Buruli ulcer; Prevalence; Anambra North; Local Government Areas (LGAs); Hotspot of BU; Trends of BU; Factors of BU
Introduction
An emerging infectious disease for which there exists a great amount of uncertainty and for which spatial epidemiological studies may yield important clues regarding its spread is Buruli ulcer (BU) disease [1]. The disease is one of the 17 emerging Neglected Tropical Diseases (NTDs) prioritized by the World Health Organization. It is also known as Bairnsdale, Daintree, Mossman and Searl ulcers in Burundi [2].
BU is a chronic, devastating and necrotizing skin disease caused by a toxin-producing bacterium known as Mycobacterium ulcerans (M. Ulcerans) [1,3-5]. It is one of the most neglected but treatable tropical diseases mostly found in rural areas located near wetlands or rivers [6]. The disease generally begins as a painless subcutaneous nodule (oedema) usually on the limbs (legs and arms) and faces which over a period of 1-9 months breaks down to form a necrotic ulcer with great pains, though other parts of the body can be affected [7]. BU infection can lead to extensive destruction of skin and soft tissues with the formation of large ulcers usually on the legs or arms. Patients who are not treated early often suffer long-term functional disability such as restriction of joint movement [7]. However, fever is uncommon with BU disease [8].
Though the mode of transmission of M. Ulcerans is not yet known, the spread of the disease has been suggested to be influenced by local environmental factors such as the presence of rivers, lakes and swampy areas, and through exposed wounds [5,6]. It also survives and thrives in temperature range between 28-34°C [6]. M. Ulcerans has also been detected in some water bugs and recently in some adult mosquitoes in Australia [5].
Statement of the Research Problem
There continues to be an increase in the number of people and communities affected by BU in Anambra North. The reasons for this continuous spread of BU particularly in this study area are not yet understood. Despite the vulnerable nature of this study area to BU and the potentials of BU to maim its victims, it is of great concern that only a single study [9] was carried out on BU in the study area prior to this current study, and this previous study was based on detecting BU cases using the Ziehl Neelson technique. It was also carried out at small spatial and temporal scales which made it unable to assess spatial patterns in the spread of the disease.
However, with the introduction of Remote Sensing (RS) and Geographic Information System (GIS), data is now available for effective and efficient research especially for mapping of hotspots of BU in the study area. Remote sensing is defined as the art and science of acquiring data about an object without making physical contact with the object [10]. While GIS is a computer based information system that sources, stores, retrieves at will, manipulates, analyzes and displays geographically referenced data [11]. Geospatial studies in other parts of the world have identified patterns in the occurrence of BU and have suggested the influence of local environmental factors in the occurrence of the disease. However, apart from the study by Akingbogun in Ogun State, western part of Nigeria, which is far from this study area, no other study has adopted GIS and remote sensing technique to study the distribution of BU cases neither in Nigeria nor in this study area in particular [8]. This study therefore examined the spatial distribution of BU cases, trends in BU occurrence, and the environmental and sociocultural factors responsible for the continuous spread of the disease in the study area.
Literature Survey
A number of previous studies have been done on BU in other parts of the world but only a few have been done in Nigeria including Akingbogun [8], Nwodo [9] and Chukwukezie et al. [12]. Notable among studies on BU disease is Hayman who studied the epidemiology of Mycobacterium ulcerans infection in Australia using field survey method [13]. The study revealed that M. Ulcerans enters the surface waters through deforestation, erosion and run-off contamination, suggesting that M. Ulcerans is washed into aquatic habitats where environmental conditions facilitate their growth and proliferation.
Ablordey et al. studied BU cases from Ashanti region of Ghana [14]. The study used questionnaire administration and GIS techniques. The results of the study revealed no spatial clustering (endemic region) of the disease at village level, but suggested the presence of multiple genotypes of M. Ulcerans in the area. Saunderson also worked on the spatial distribution of elephantiasis, leprosy and BU in Accra, Ghana, using geospatial techniques [15]. The study revealed that about 70% of the cases found along water bodies within the central part of the study area. Similarly, Simpson studied the spatial distribution of BU, leprosy and elephantiasis in Ghana using GIS and remote sensing techniques [16]. The study found a positive relationship between BU disease cases and the presence of streams in the study area.
However in Nigeria as noted earlier, not much has been done with regards to BU studies. Chukwukezie et al. examined patients affected by BU in the South-south and South-eastern part of Nigeria using fine-needle aspiration technique [12]. The study discovered varying degrees of BU cases within the study area. Similarly, Nwodo examined the rate and knowledge of Buruli Ulcer in four communities of Ayamelum Local Government Area (LGA) of Anambra State, Nigeria, using Ziehl Neelson microscopy technique and questionnaire administration [9]. The study identified the existence of BU cases in four communities of the LGA. Also, Akingbogun studied the spatiotemporal pattern of BU disease in Ogun State using GIS and questionnaire administration [8]. The study revealed clusters of the disease in the western part of the area.
Getis-Ord Gi* statistics
Hotspot is defined as a frequency of occurrence indicating some form of clustering in a spatial distribution [17]. This leads to the use of Getis-Ord Gi* (d), which can separate clusters of high values from clusters of low values [18,19]. The hotspot analytical tool calculates the Getis-Ord Gi* statistic in ArcGIS 10.1 software for each feature in a dataset. The resultant zscores and p-values are measures of statistical significance of where features with either high or low values cluster spatially. This tool works by looking at each feature within the context of neighbouring features and then calculates a standard deviation (SD) as a measure of degree of clustering. A feature with a high SD is interesting but may not be a statistically significant hotspot. To be a statistically significant hotspot, a feature will have a high SD and be surrounded by other features with high SDs as well. The local sum for a feature and its neighbours is compared proportionally to the sum of all features; when the local sum is very different from the expected local sum, and that difference is too large to be the result of random chance, a statistically significant Z-score results [20]. The Getis-Ord Gi* statistic is calculated as shown in Figure 1.

Figure 1: Calculation of Getis-Ord Gi*.
Interpretation of Gi* statistics
The Gi* statistic usually returns a z-score for each feature in the dataset. For statistically significant positive z-scores, the larger the z-score is, the more intense the clustering of high values (hotspot). For statistically significant negative z-scores, the smaller the z-score is, the more intense the clustering of low values (cold spot). Determination of significant clusters in a distribution is simplified by ESRI as shown in Table 1 [21].
| z-score (Standard Deviations) |
p-value (Probability) |
Confidence level |
| < -1.65 or > +1.65 |
< 0.10 |
90% |
| < -1.96 or > +1.96 |
< 0.05 |
95% |
| < -2.58 or > +2.58 |
< 0.01 |
99% |
Table 1: Z-scores for test of statistical significance of a distribution.
The Gi* function creates a new feature class that duplicates the input feature class, and then adds new results columns for the Gi z-score and p-values. Whereas the z-scores are measures of standard deviations, the p-values are probability levels that tell whether to accept a cluster of not. A probability level of 95% (0.05) is the minimum acceptable for a statistically significant cluster. A high z-score and low p-value for a feature indicates that its neighbours have high attribute values, while a low zscore and lower p-value indicates that a feature is surrounded by low values. A z-score near zero indicates no apparent concentration of features (neighbours have a range of values). In order to determine if the z-score is statistically significant, each value is compared to the range of values for a particular confidence level. For instance, at a significance level of 0.05 (95%) confidence level, a z-score would have to be less than -1.96 or greater than 1.96 to be statistically significant [18].
Methodology
Types and sources of data
The types of data utilized in this work include: record of BU cases, coordinates of affected settlements and communities, population data at community level, topographic map (Scale: 1:250,000), Digital Elevation Model (DEM), and a satellite imagery of the study area. These data were obtained through both primary and secondary sources.
Sampling technique and sample size
A multistage sampling technique was adopted in this study. Firstly, three LGAs were selected from Anambra north based on reported BU cases. Secondly, a total of fifteen communities were selected purposively from the three LGAs based on recorded BU cases. Similarly, the 1991 population of the communities was projected to 2016 using the Exponential formula for population growth given as: P(t)=P0 er*t. A sample size of 400 was determined using the Yamane formula for sampling size selection.
Thus, a total of 400 copies of questionnaire were administered to the respondents within the study area. The target groups for the questionnaire were people suffering from BU and other members of the affected communities who have lived within the community for a minimum of 5 months before the time of this study. Disease Surveillance and Notification Officers (DNSOs) and BU focal persons were employed as research assistants in this work. The BU Questionnaire was used to source information on the factors influencing the occurrence of the disease in the study area.
Data Analysis
The coordinates of the yearly cases of BU recorded in each settlement were imported into ArcGIS 10.1 software to examine the frequency and intensity of distribution of the disease. The Getis-Ord Gi* statistical tool was then used to map the hotspots of BU cases in the study area based on the standard deviations of aggregate BU cases in each community. Also, the number of BU cases, month and year of infection was processed in Microsoft Excel 2010 using time series technique to examine monthly variations in BU occurrence. The significance of the seasonality in BU occurrence was tested using a One-Way Analysis of Variance (One-Way ANOVA).
Furthermore, the factors influencing BU occurrence in the study area were examined using the satellite imagery, DEM and questionnaire. The responses from the questionnaire were presented in a table and analyzed using a bivariate factor analysis known as risk ratio.
Results
Trend of BU in Anambra North
As the result in Figure 2 above shows, the highest number (17.2%) of BU cases for the period of 2012-2015 was recorded in February, while 15.6% of the cases were recorded in May. No case of BU was recorded in the months of September and October within the period of this study, making them the cold spot months for BU occurrence in the study area. There was a negative trend in BU occurrence within the period which was highest around the beginning of the year but decreases towards the end of the year.
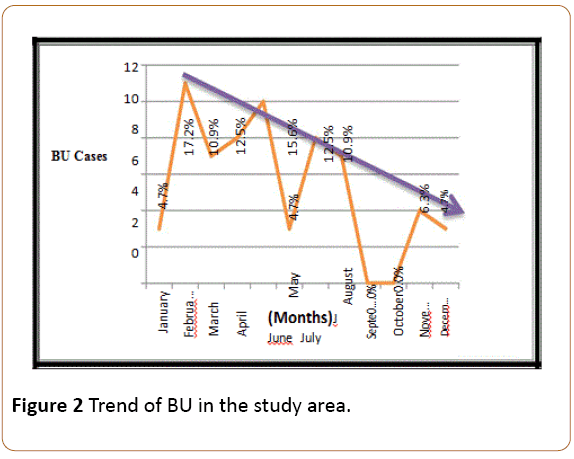
Figure 2: Trend of BU in the study area.
In order to examine if these monthly variations in BU occurrence in Anambra North was significant or a mere random occurrence, a One-Way Analysis of Variance (One-Way ANOVA) test was performed. The result of the ANOVA test showed that the variation in monthly BU occurrence in Anambra North for the period of 2012-2015 was significant at 95% confidence level. Thus, BU occurrence in the study area has a negative trend in which the number of BU cases decreases towards the end of the year and increases around the beginning of the year and the highest numbers of BU cases in the study area are recorded in the months of February and May.
Hotspots of BU in Anambra North
In order to examine the significance of observed clusters of BU in the study area, a hotspot analysis tool known as Getis-Ord Gi* statistics was used in ArcGIS 10.1 to map the hotspots of BU in the study area. The Getis-Ord Gi* hotspot tool was chosen for this work because it gives results that are nearest to reality in hotpots of point data compared to other hotspot tools especially in disease studies [21]. A 95% confidence level was chosen as the minimum margin for the acceptance of the results of the hotspots/cold spots of BU in the area. A hotspot area implies a significant endemic region while a cold spot area means a significant non-endemic region. The z-scores and p-values are measures of statistical significance of either a cold spot (nonendemic region) or a hotspot (endemic region) of BU disease. They tell whether to accept or reject an observed BU cluster.
The Getis-Ord Gi* tool identified varying degrees of clusters of BU cases in the study area. However, based on established ranges for the significance of a cluster and the z-values of Getis- Ord Gi* statistics calculated from aggregate BU cases in the study area (Table 2), five significant clusters (hotspots) of BU cases were identified in the study area at 95% confidence level. The endemic areas of BU occurrence in the study area are Omor, Anaku, Igbakwu, Umumbo and Umuerum communities based on their z and p values and their proximity to one another. Other clusters of BU in the study area were not significant based on the z-scores and p-values as shown in Figure 3.
| Community |
BU Cases |
Gi Z-Score |
Gi P-Value |
Latitudes (North) |
Longitudes (East) |
| Umueje |
1 |
-0.076079 |
0.939357 |
6.951636 |
6.692984 |
| Ifite-Ogwari |
7 |
1.302951 |
0.192591 |
6.943464 |
6.605132 |
| Umumbo |
4 |
2.51413 |
0.011933 |
6.998626 |
6.531582 |
| Igbakwu |
3 |
2.51413 |
0.011933 |
6.945507 |
6.545884 |
| Umuerum |
4 |
2.331597 |
0.019722 |
7.004756 |
6.472334 |
| Omor |
19 |
2.51413 |
0.011933 |
6.953679 |
6.513195 |
| Anaku |
14 |
2.331597 |
0.019722 |
6.933249 |
6.468248 |
| Mmiata |
1 |
-1.213504 |
0.224937 |
6.786148 |
6.413085 |
| Umuenwelum |
1 |
-0.945571 |
0.344367 |
6.694211 |
5.88189 |
| Oroma-Etiti |
2 |
-1.213504 |
0.224937 |
6.74733 |
6.331363 |
| Umueze |
2 |
-1.213504 |
0.224937 |
6.829053 |
6.335449 |
| Iyiowa |
1 |
-0.931964 |
0.351355 |
6.765718 |
6.112756 |
| Akili-Ozizor |
1 |
-1.213504 |
0.224937 |
6.737115 |
5.992215 |
| Ogbakuba |
3 |
-0.945571 |
0.344367 |
6.712598 |
5.924794 |
| Umunankwo |
1 |
-1.213504 |
0.224937 |
6.75346 |
6.355879 |
Table 2: Getis-Ord Gi* z-values for Buruli Ulcer cases in the study area, *observed general G: 0.272037, Z-score: 2.884745 and P-value: 0.003917.
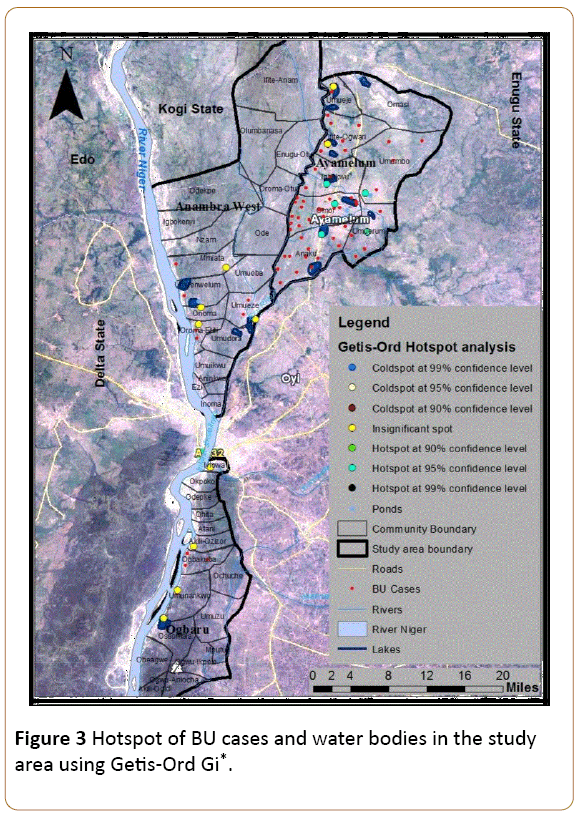
Figure 3: Hotspot of BU cases and water bodies in the study area using Getis-Ord Gi*.
Given an average z-score of 2.884745 and p-value of 0.003917, there is less than 5% likelihood that the high clustered pattern of BU around these five communities could be the result of random chance. So this result is acceptable at 95% confidence level. The reason for this high clustered pattern of BU in these communities with a mean BU center located in Anaku was further examined under the factors influencing BU occurrence in the study area below.
Factors influencing BU occurrence in Anambra North
The occurrence of BU in an area has been attributed to different factors such as closeness to water bodies, not wearing protective wears, and so on. In addition to these above factors, this current study went further to examine the association between BU cases and elevation (differences in altitude), agricultural activities and sociocultural practices in this study area.
This study area is dotted with pockets of ox-bow lakes due to its topography. The areas with the highest number of BU cases in the study area are areas around the Mamu and Ezu Rivers and are dominated with ponds and lakes from the nearby rivers (Figure 3). For instance, most of the communities in Ayamelum LGA where the hotspots of BU lie are surrounded by pockets of lakes. Even those BU patients who do not reside close to the water bodies make use of water from the water bodies especially during dry seasons. Thus, the number of BU cases recorded in the study area has a positive association with the water bodies particularly the Mamu and Ezu Rivers as well as the lakes and ponds. These water bodies are used for swimming and domestic purposes by a great part of the population.
Furthermore, this study area is relatively a low lying area. A DEM of the study area showed high frequency of occurrence of the disease in lower elevations. For instance, affected communities in Ayamelum LGA lie on a minimum elevation of less than 32 m which coincidentally is the lowest altitude amongst the (BU) communities in this study area (Figure 4). As such, communities lying on lowlands are more exposed to the risk of BU than those at higher elevations.
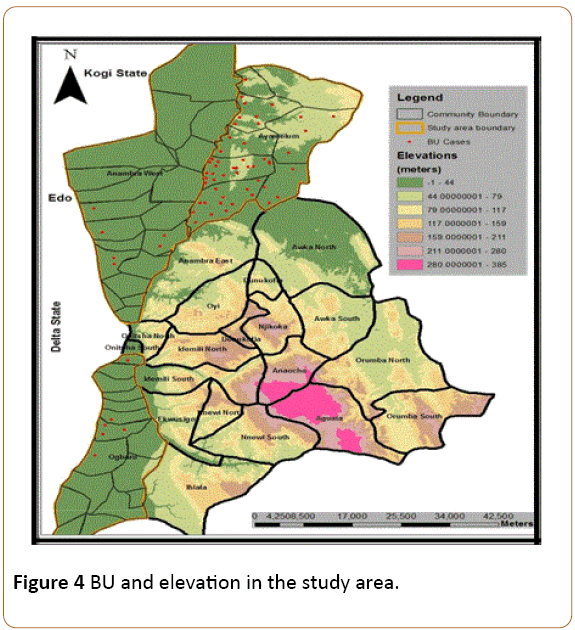
Figure 4: BU and elevation in the study area.
More so, this study area is predominantly a rice farming area. The rice farming mainly practiced here is the wetland type which is done around swampy areas formed by slow-moving bodies of water. Since there are numerous rice farms in this study area which were inaccessible during this study period, this research concentrated on the location of the major rice farms in the study area and the rice farming practices adopted by the people. Figure 5 shows the rice farms within this study area.
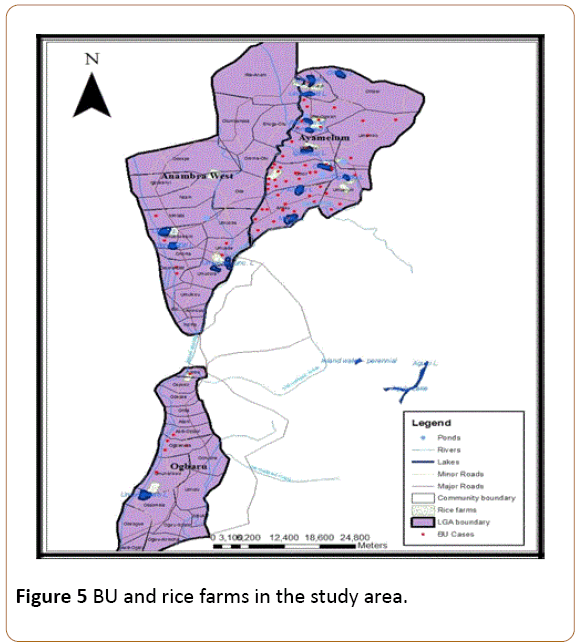
Figure 5: BU and rice farms in the study area.
As the result in Figure 4 above shows, most of the BU cases were recorded around areas where rice farms are located. These rice farming activities are mostly found in the Fadama (swampy) areas where the presence of the lakes supports medium scale rice production and fishing activities. Indeed, the largest rice farms in this study area are located in communities within Ayamelum LGA and situated around the ox-bow lakes which support rice production (Appendix I). Hence, there is a positive association between BU and rice farming activities in this study area, especially as the farming activities are supported by the presence of the water bodies.
The sociocultural factors influencing BU occurrence in the study area were examined through responses from the questionnaires. These factors were analyzed using risk ratio statistics (Table 3) because they were not evident from the maps.
| Factors |
|
BU Positive |
RR |
95% Cl |
| Yes |
No |
| Settlement close to river |
Yes |
56 |
280 |
1.33 |
0.67-2.66 |
| No |
8 |
56 |
| Swimming |
Yes |
45 |
180 |
1.84 |
1.12-3.03* |
| No |
19 |
156 |
| Swimming with wound |
Yes |
2 |
40 |
0.28 |
0.07-1.08 |
| No |
62 |
296 |
| Domestic use of stream water |
Yes |
61 |
318 |
1.13 |
0.39-3.29 |
| No |
3 |
18 |
| Cultural practices |
Yes |
59 |
163 |
9.46 |
3.88-23.07* |
| No |
5 |
173 |
| Farming on Swampy land/Fishing |
Yes |
49 |
134 |
3.87 |
2.25-6.67* |
| No |
15 |
202 |
| Wearing protective gadgets |
Yes |
6 |
40 |
0.8 |
0.36-1.74 |
| No |
58 |
296 |
Table 3: Bivariate analysis of factors associated with Buruli Ulcer in the study area using risk ratio, significant at 95% confidence interval.
The result of the bivariate analysis of BU factors as presented in Table 2 above shows that people who are engaged in cultural practices are 846 times more likely to contract BU than those not engaged in cultural practices. Some of the cultural practices in this study area include bathing in reserved stagnant bodies of water for spiritual cleansing purpose, idol worshiping in reserved forest areas, and so on. However, majority of the people are engaged in the spiritual cleansing exercise. As such, cultural practices around reserved bodies of water pose the highest risk of BU occurrence in this study area.
Similarly, farming on swampy land and fishing increases the chances of contracting BU by 287%. Whereas swimming with a wound does not increase the risk of getting BU, swimming in the lakes generally increases the risk of being infected with BU by 84%.
Discussion
In order to increase the accuracy of findings, this study focused on recorded cases of BU for the period of 2012-2015. Although the study was not able to determine the actual factors responsible for higher number of BU cases in the months of February and May, it is suggested that rainfall regime plays a role in this regard. This study area experiences its last month of dryness in February. The absence of rainfall in this area during the month of February suggests that there would be more patronage of the available water in the streams by the inhabitants within this period. It is also possible that the streams in this study area flow at a slower rate during the dry month of February due to the absence of rainfall. Since BU has been associated with slow moving water bodies [6,22], activities within this slow-moving bodies of water in the month of February may give clues to the actual causes of higher number of BU cases in the month of February. Similarly, rice farming activities in this study area usually starts with the onset of rainfall around the months of April-May in Anambra North. The rice farming activities are such that the farmer works on a swampy land while dipping his hands and legs into the swampy soil. This explains why most of the BU lesions are found on the limbs. This practice which is mostly done during the period of May also gives a suggestion towards the possible reasons for the high number of BU cases recorded in May in Anambra North.
The Getis-Ord Gi* tool used in this study identified five significant BU hotspots at 95% confidence level (within Omor, Anaku, Umuerum, Umumbo and Igbakwu) in Ayamelum LGA which are areas surrounded by the Ezu and Mamu Rivers, as well as ox-bow lakes. Although this tool has not been used in BU studies in Nigeria before now, it has however been used to determine significant TB hotspots in Kebbi State Nigeria by Ibrahim et al. [21].
This current result agrees with the findings of Bratschi et al. in Cameroon where BU hotspots were identified around the Mbam River [4]. This study also found that the local BU endemic areas are larger than previously described by Chukwukezie et al. [12] and Nwodo [9], though some the hotspots were not significant at 95%.
Also, all the areas where BU was recorded have water bodies in the form of rivers, lakes or ponds. However, one major difference here is that the BU hotspot communities are areas dotted with more slow-moving/stagnant ox-bow lakes and ponds. These Lakes may support the presence of M. Ulcerans as the bacterium has been found to dwell more in slow-moving bodies of water. This result is in line with the other findings in Australia [13], Ghana [6], Cameroon [4], and Ogun State, Nigeria [8]. The presence of these lakes supports rice production and fishing activities in Anambra North. Indeed, the largest rice farms in this study area are located in communities within Ayamelum LGA and situated around the ox-bow lakes.
Rice farming activities in this study area are done in a crude way on wetlands watered by the lakes. The farmers cultivate their rice on water-logged lands without putting on protective wears. Indeed, most (91%) of the farmers and fishermen with BU who were interviewed in this research do not put on protective wears to farm or during fishing. Thus, farming/fishing without putting on protective wears contribute to the high number of BU cases recorded in the study area. This result supports the findings by Nwodo [9]. It may be argued that the ponds are not necessary here since the people do not make use of the pond waters. However, observations from this study area show that children play in these ponds on their way back from school, while the adults also dip their legs in these ponds during rainy days. Although no previous study has supported this view, it is possible that the disease is also transmitted to people through infected ponds.
Hence, rice farming activities on swampy land, activities around the water bodies (Ezu and Mamu Rivers, as well as lakes and ponds) such as swimming, fishing as well as cultural practice of cleansing in reserved bodies of water and not wearing protective gadgets while farming on swampy land or fishing are the major factors influencing BU occurrence in communities within Anambra North. Furthermore, people who live in lower altitudes have more risk of the disease than those living in higher altitudes. This is possible since the lower altitudes support the presence of more slow-moving water bodies which could encourage the growth of BU bacteria. This finding however has not been reported in previous literatures. On the contrary, the type of food eaten does not influence BU occurrence since both the BU patients and those without the disease eat similar types of food. Also, close interaction with an infected person does not expose one to BU disease since the BU patients live with their family and friends who do not have the disease. This particular finding is in line with all other literatures on BU studies. Similarly, swimming with an exposed wound does not increase the risk of contracting BU infection. This finding is however contrary to the findings in Cameroon [4,23]. There was no evidence suggesting that the BU patients had wounds before contracting the disease.
Conclusion
Although the true burden of BU is not yet well known in Nigeria, the disease has become a great problem in public health discourse in the country. The pattern of distribution of BU varied in the study area with significant hotspots (endemic areas) of the disease in five communities within Ayamelum LGA. The disease was discovered to exhibit a seasonal pattern of occurrence in this study area with the months of February and May being the most prevalent months of BU occurrence whereas no cases of the disease are recorded in the months of September and October. This suggests that people get more infected with BU during the end of dry season and the beginning of rainy season. Other factors influencing BU occurrence in this area include rice farming activities, swimming and fishing activities, not wearing protective wears during farming on swampy lands, and cultural practice of ritual cleansing in reserved water bodies. This study which analyzed the prevalence of BU in Anambra North has therefore made significant contribution to the global estimates of BU burden in Nigeria. The study therefore makes the following recommendations:
The Local Government authorities responsible for the provision of water supply should as a matter of urgency intervene in the provision of good sources of water supply in these communities so as to reduce the patronage of water from the lakes for domestic purposes.
To the Local and International Organizations, funding of more studies and constant mapping of BU using high resolution satellite imageries should be encouraged in this study area, especially around the BU hotspot communities and other areas not covered in this exercise. Such studies should be carried out during the dry season as some of the areas may be inaccessible during the rainy season.
Limitations of the Study
This study could not establish the real factors responsible for the significant monthly variation in BU occurrence. Thus, additional researches are needed in this regard which will further serve as a guide in mitigating the occurrence of the disease in this study area in particular and in the State in general.
References
- Johnson PD, Stinear TP, Hayman JA (1999) Mycobacterium ulcerans-A mini-review. J Med Microbiol 48: 511-513.
- World health organization (2015a) Buruli ulcer (Mycobacterium ulcerans infection). Fact sheet N°199.
- World health organization (2015b) Programme: Buruli ulcer.
- Bratschi M, Bolz M, Minyem J, Grize L, Wantong F, et al. (2013) Geographic distribution, age pattern and sites of lesions in a cohort of buruli ulcer patients from the Mapé Basin of Cameroon. PLO Negl Trop Dis 7.
- Walsh D, Portaels F, Meyers W (2011) Buruli ulcer: Advances in understanding Mycobacterium ulcerans infection. Dermatol Clin 29: 1-8.
- Merritt RW, Walker ED, Small PL, Wallace JR, Johnson PD, et al. (2010) Ecology and transmission of Buruli ulcer disease: A systematic review. PLoS Negl Trop Dis 4: e911.
- Meka AO (2016) Buruli ulcer disease. 2016 Conference on buruli ulcer (pp. 1-60). Anambra State: Department of community medicine, Nnamdi azikiwe teaching hospital, Neni campus.
- Akingbogun A (2014) Modelling of spatial pattern of buruli ulcer disease. African geospatial forum, Ogun: POINTMILE Geotech.
- Nwodo C (2014) Prevalence and factors associated with buruli ulcer in Ayamelum L.G.A of Anambra State, Nigeria. Kaduana State, Nigeria: An M.Sc thesis submitted to the department of community medicine, Ahmadu bello university, Zaria.
- Smith L, Pavelsky T (2009) Remote sensing of volumetric storage changes in Lakes, Earth surface processes and landforms. 34: 1353-1358.
- Burrough P (1986) Principles of geographic information system. New York: Oxford university press.
- Chukwuekezie O, Ampadu E, Sopoh G, Dossou A, Tiendrebeogo A, et al. (2007) Buruli ulcer, Nigeria. Emerg Infect Dis 13: 782-783.
- Hayman J (1991) Postulated epidemiology of Mycobacterium ulcerans infection. Int J Epidemiol 20: 1093-1098.
- Ablordey A, Vandelannoote K, Frimpong I, Ahortor E, Amissah N, et al. (2015) Whole genome comparisons suggest random distribution of Mycobacterium ulcerans genotypes in a buruli ulcer endemic region of Ghana. PLOS Negl Trop Dis 9: e0003681.
- Saunderson P (2016) Mapping IDM NTDs, with a focus on mapping morbidity. Addis Ababa conference on NTDs/IDMs. Addis Ababa, Ethiopia: American leprosy missions.
- Simpson H (2016) Map-making. Addis Ababa conference on NTDs/IDMs. Addis Ababa, Ethiopia: American leprosy missions.
- Osei FB, Duker AA (2008) Spatial and demographic patterns of cholera in Ashanti region-Ghana. Int J Health Geogr 7: 44.
- Mitchell A (2005) The ESRI guide to GIS analysis, Volume 2. Redlands, CA: ESRI press.
- Getis A, Ord J (1992) The analysis of spatial association by use of distance statistics. Geogr Anal 24: 189-206.
- Environmental systems and research institute (2012) How hotspot analysis (Getis-Ord Gi*) works. ESRI.
- Ibrahim S, Hamisu I, Lawal U (2015) Spatial pattern of tuberclosis prevalence in Nigeria: A comparative analysis of spatial autocorrelation. American Journal of Geographic Information System 4: 87-94.
- Wagner T, Benbow M, Brenden T, Qi J, Johnson R (2008) Buruli ulcer disease prevalence in Benin, West Africa: Associations with Landuse/cover and the identification of disease clusters. Int J Health Geogr 7: 25.
- Landier J, Boisier P, Fotso P, Noumen-Djeunga B, Simé J, et al. (2011) Adequate wound care and use of bed nets as protective factors against buruli ulcer: Results from a case control study in Cameroon. PloS Negl Trop Dis 5: e1392.