Keywords
Surveillance; Health care associated infection; Intensive care unit; Central line catheterization
Introduction
In critically-ill patients, central lines (CL) are widely and increasingly used. Hence, it is important to note that centralline- associated bloodstream infection (CLABSI) is a leading cause of preventable healthcare-associated infections (HAIs), which result in increases in the length of hospital stays and higher costs. Numerous studies showed that patients admitted to the Intensive Care Units (ICUs) and medical or surgical units are at huge risk of acquiring HAIs because of the severity of illness and the use of medical and invasive devices [1-3]. At the present time, the condition of patients with blood stream infections in ICUs has improved after the implementation of a central line bundle [4].
The Care Bundle Model was initiated by the Institute of Healthcare Improvement (IHI), and is recognized as improving patient safety outcomes by preventing the possibility of infections and therefore reducing mortality and morbidity because of CLABSI among ICU patients. The CL bundle is a group of evidence-based interventions applied for patients with CLs which has shown sustained improvements over time. These interventions are documented to lead to better outcomes when they are implemented together than when they are implemented individually. The components of the CL bundle are: 1) hand hygiene, 2) maximal barrier precautions, 3) chlorhexidine skin antisepsis, 4) optimal catheter site selection, and finally, 5) daily review of the necessity for the CL [5].
Data about the CLABSI rate in Saudi Arabia is limited to a single center for a limited period. There is a lack of studies on CL bundle effectiveness from the Gulf region and Saudi Arabia in particular. However, a number of international studies showed the effectiveness of the insertion and maintenance of these CL bundles on the CLABSI rate in ICUs [3].
The aim of this study is to estimate the rate of CLABSI and the compliance rate with the CL bundle in MICU and SICU in a large tertiary teaching hospital in Saudi Arabia and to examine the association between CL bundle implementation and rate of BSI in these ICUs.
Methods
Setting
This study was conducted in an adult Medical Intensive Care Unit (MICU) and a Surgical Intensive Care Unit (SICU), makes a total of a 35 bed capacity, at King Abdul-Aziz University Hospital (KAUH). KAUH is an approximately 845 bed tertiary facility that provides health care services to the general public.
Study population
All patients who were admitted to adult MICU or SICU from January 2011 to December 2016 and required the insertion of a CL for any medical indication were included in this study. Patients with a CL that was inserted in this hospital and which remained in place for more than 48 h after admission were included in this study while those patients with CL for less than 48 h were excluded from the study.
Study design
This is a retrospective cohort study. The data were collected based on prospective targeted surveillance, which was conducted to estimate the rate of CLABSI in MICU and SICU during the study period (2011-2016).
Surveillance definitions
The definition of CLABSI used here was based on National Health Services Network (NHSN) criteria that remained essentially unchanged during the data collection (surveillance) period covered [6]. CLABSI was defined as a laboratoryconfirmed blood stream infection that was not secondary to an infection at another body site in patients who have a CL catheter in place at the time of, or within 48 hours before, the onset of the event. Also considered here is the time for a positive result between blood cultures sent from a peripheral line (PL) and central line (CL), in addition to infection signs and symptoms.
Data collection
CLABSI data were collected using the same methodology implemented by U.S.A NHSN. These included numerator data (patient demographic, CL information and diagnosis of CLABSI event) and denominator data (the daily number of patients with CL catheter) [7]. Data analysis took place using Statistical Package for the Social Sciences (SPSS) program version 22.
Statistical Analysis
The incidence of CLABSI was expressed as episodes per 1000 central-line days; categorical variables were compared using a chi-square test; continuous variables were described by the mean standard deviation (± SD) and were compared using the student t test, or were described as the median and range, and were compared with the Wilcoxon rank-sum test if the distribution was not normal. Factors associated with acquiring CLABSI were identified using univariate analysis. The 95% confidence intervals (CI) were computed. All tests were two tailed and p ≤ 0.05 was considered statistically significant. The CLABSI rate was calculated by dividing the number of CLABSI events by the number of device days in a given time (e.g. per month).
Results
Table 1 presents data from January 2011 to December 2016. Out of 36,469 central lines, a total of 85 were identified with CLABSI, of which 67 were identified among MICU patients with 24,759 central line days. The CLABSI rate was 3.2 per 1,000 central line days over six years of surveillance. The mean rate of CLABSI in MICU was 2.7 per 1,000 central line days with a sharp decrease in the rate from 6 per 1,000 central line days (year 2011) to 0.3 per 1,000 central line days (year 2016) in MICU over six years. The rate in SICU was 3.3 per 1,000 central line days (year 2011) to 0.3 per 1,000 central line days (year 2016) and these differences are statistically significant (p ≤ 0.05) (Table 1).
| ICUs |
Surveillance years |
| 2011 |
2012 |
2013 |
2014 |
2015 |
2016 |
Total |
| MICU |
|
| No. of CVC-Days |
4,444 |
3,999 |
4,534 |
3,362 |
4,587 |
3,833 |
24,759 |
| No. of patient days |
5,100 |
2,659 |
3,802 |
4,320 |
3,826 |
5,206 |
24,913 |
| No. of infections |
26 |
17 |
10 |
6 |
7 |
1 |
67 |
| CLABSI rate/catheter days |
6 |
4.3 |
2.2 |
1.7 |
1.5 |
0.3 |
2.7 |
| (Mean rate) |
| Device utilization ratio |
0.87 |
1.5 |
1.2 |
0.78 |
1.2 |
0.74 |
1.04 |
| (Mean rate) |
| SICU |
| No. of CVC-Days |
2,090 |
1,855 |
1,831 |
2,144 |
2,034 |
1,756 |
11,710 |
| No. of patient days |
2,611 |
1,351 |
1,230 |
1,750 |
1,442 |
2,814 |
11,198 |
| No. of infection |
7 |
5 |
1 |
3 |
1 |
1 |
18 |
| CLABSI rate/catheter days |
3.3 |
3 |
5.4 |
1.4 |
0.5 |
0.3 |
2.3 |
| (Mean rate) |
| Device utilization ratio |
0.8 |
1.3 |
1.5 |
1.2 |
1.1 |
0.62 |
1.08 |
| (Mean rate) |
| Differences statistically significant (p ≤ 0.05) |
Table 1: Central line-associated blood stream infection (CLABSI) in two ICUs (medical and surgical).
All 85 cases included in the study met the CLABSI criteria as presented in Table 2 [8], the demographic baseline data for the patients. Out of 85 patients, 74% were male with a mean age of 55 years (SD ± 19 years).
| |
MICU |
SICU |
95% CI |
p value |
| |
No. (%) |
No. (%) |
| |
67 (79) |
18 (21) |
| Age/Years (± SD) |
|
|
|
|
| Male |
55 (± 19) |
45 (± 20) |
1.20-3.52 |
0.01 |
| Female |
59 (± 22) |
41 (± 19) |
|
|
| Gender |
|
|
|
|
| Male n=50 |
37 (74) |
13 (26) |
0.15-1.48 |
0.16 |
| Female n=35 |
30 (86) |
5 (14) |
|
|
| Major diagnosis on ICU admission |
|
|
|
|
| Cardiovascular disease, n=23 |
18 (78) |
5 (22) |
|
|
| Neurological diseases, n=8 |
6 (75) |
2 (25) |
|
|
| Respiratory diseases, n=12 |
11 (92) |
1 (8) |
- |
0.02 |
| Gastrointestinal diseases, n=15 |
9 (60) |
6 (40) |
|
|
| Nephrology diseases, n=11 |
9 (82) |
2 (18) |
|
|
| Obstetric diseases, n=2 |
2 (100) |
0 (0) |
|
|
| Malignancy, n=8 |
7 (88) |
1 (13) |
|
|
| Trauma, n=4 |
4 (100) |
0 (0) |
|
|
| Co-morbidity |
|
|
|
|
| HTN, n=50 |
39 (78) |
11 (22) |
0.31 -2.57 |
0.52 |
| DM, n=46 |
36 (78) |
10 (22) |
0.33-2.64 |
0.55 |
| ARF, n=19 |
18 (95) |
1 (5) |
1.70-50.3 |
0.04 |
| IHD, n=10 |
9 (69) |
1 (5) |
0.14-2.02 |
0.28 |
| CVA, n=4 |
3 (75) |
1 (25) |
0.18-8.15 |
0.62 |
| COPD, n=2 |
1 (50) |
1 (50) |
0.01-4.33 |
0.38 |
| Place of Insertion CL |
|
|
|
|
| ICU, n=81 |
64 (96) |
17 (94) |
0.12-12.84 |
0.62 |
| Non-ICU, n=4 |
3 (4) |
1(6) |
|
|
| Insertion status |
|
|
|
|
| Emergency insertion, n=44 |
32 (73) |
12 (27) |
0.15-1.36 |
0.12 |
| Temporary CL, n=84 |
66 (79) |
18 (22) |
0.95-1.01 |
0.78 |
| Clinical sepsis, n=5 |
5 (100) |
0 (0) |
0.86-1.10 |
0.29 |
| Laboratory positive culture, n=67 |
67 (79) |
0 (0) |
- |
- |
| Poly microorganism, n=20 |
18 (90) |
2 (10) |
0.61-14.1 |
0.13 |
| Signs and symptoms |
|
|
|
|
| Fever, n=72 |
57 (79) |
15(21) |
0.27-4.67 |
0.55 |
| Hypotension, n=55 |
42 (76) |
13(24) |
0.20-2.03 |
0.32 |
| Chills, n=3 |
1 (33) |
2 (67) |
0.10-1.42 |
0.11 |
| Invasive procedures |
|
|
|
|
| CVC, n=83 |
65 (78) |
18 (22) |
0.93-1.01 |
0.61 |
| AL, n=38 |
34 (90) |
4 (10) |
1.15-12.13 |
0.27 |
| MV, n=46 |
35 (76) |
11 (24) |
0.24-2.01 |
0.34 |
| TT, n=30 |
22 (73) |
8 (27) |
0.21-1.76 |
0.26 |
| FC, n=74 |
59 (80) |
15 (20) |
0.35-6.24 |
0.42 |
| NGT, n=54 |
43 (80) |
11 (20) |
0.39-3.32 |
0.51 |
| TPN, n=74 |
59 (80) |
15 (20) |
0.18-14.85 |
0.52 |
| Type of central line |
|
|
|
|
| Inter-jugular, n=57 |
46 (81) |
11 (19) |
0.47-4.10 |
0.36 |
| Femoral, n=16 |
12 (75) |
4 (25) |
0.21-2.73 |
0.49 |
| Subclavian, n=12 |
9 (75) |
3 (25) |
0.18-2.73 |
0.45 |
Table 2: Comparison of patients with a central line in two intensive care units.
The major cause of admission in MICU was cardiovascular diseases 18/23 (78%), followed by respiratory problems, 11/12 (92%) while in SICU it was gastroenterology problems 6/15 (40%) followed by 5/23 (22%) cardiovascular diseases.
Patients admitted with a co-morbidity of acute renal failure had significantly developed CLABSI because of femoral line access. These differences were statistically significant (p=0.02). Patients with renal failure had the highest CLABSI in MICU 18/19 (95%) compared to SICU 1/19 (5%). These differences are statistically significant (p=0.04).
Before the full implementation of the CLABSI bundle, we saw a significant infection rate of CLABSI in ICUs (Table 1). The MICU rate was 6 per 1,000 central line days in 2011. The CLABSIs rate then reduced to 4.3 per 1,000 central line days in 2012. The result of the full implementation of the CL bundle was 95% net reduction from pre-implementation of the CL bundle to full implementation in 2014 when the CLABSI rate was 1.7/1,000 central line days and the reduction was sustained. The rate had fallen to 0.3 per 1,000 central line days by 2016.
These data are shown in Figures 1 and 2 as yearly figures. They also show the CLABSI rate for the period 2014-2016. Rates were below the NHSN Benchmark (3.2 per 1,000 central line days) for both periods before and after implementation of CL bundles. We also trended these rates as an improvement aiming for zero rates in both ICUs (Medical & Surgical).
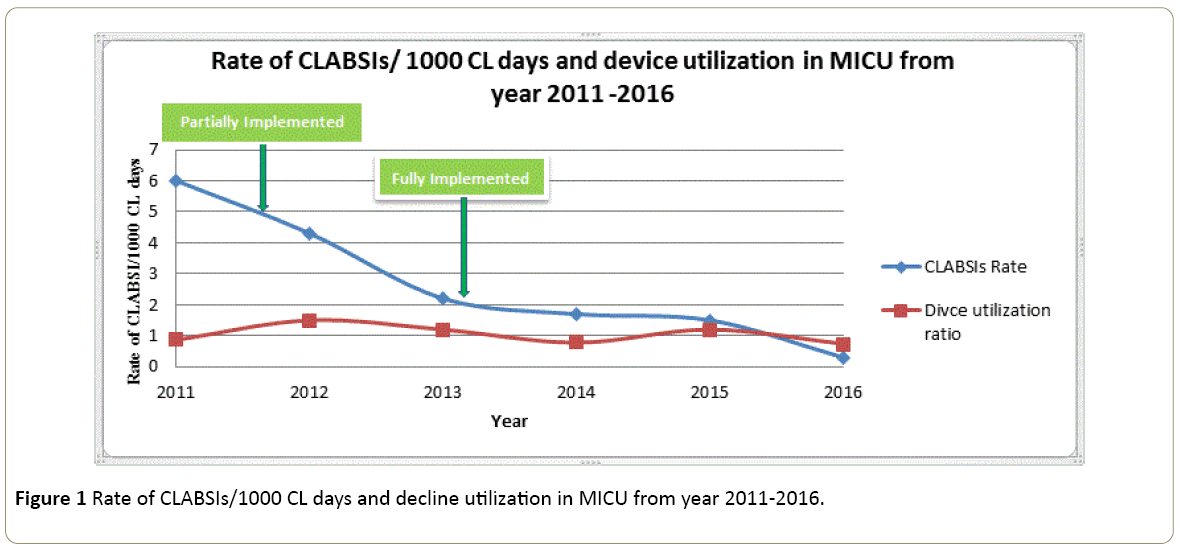
Figure 1: Rate of CLABSIs/1000 CL days and decline utilization in MICU from year 2011-2016.
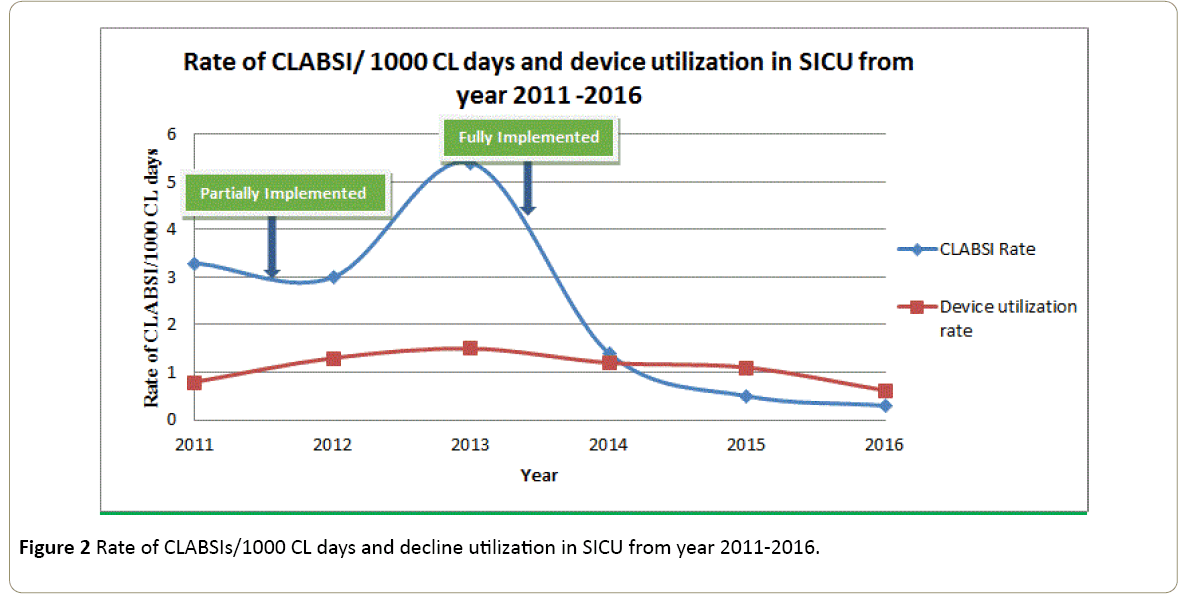
Figure 2: Rate of CLABSIs/1000 CL days and decline utilization in SICU from year 2011-2016.
Table 2 shows the age of patients in MICU & SICU, those admitted in MICU were older than those in SICU. These differences are statistically significant; however, there is no gender difference between the ICUs.
Emergency insertion was highest in MICU 32/44 (73%) while SICU had 12/44 (27%). However, this is not significant (P=0.12). The temporary central lines in MICU 66/84 (79%) were higher than SICU 18/84 (22%).
There is no significant difference between the place of insertion of CL in both ICUs and non-ICU such as in the emergency department. Also, there is no difference between insertion status, emergency or elective (73%-27%), respectively. Most of the cases had CL at the interjugular vein, MICU 46/57 (81%) compared to SICU 11/57 (19%) (P=0.36).
Table 3 shows the micro-organisms that caused the blood stream infection was Pseudomonas aeruginosa in MICU 7 (10%). Table 3 shows 7 (10%) followed by Candida albicans 10 (15%). The poly-microorganism cases were: MICU 18/20 (90%) and SICU 2/20 (10%). Fever was the most common diagnosis in MICU (79%) compared to SICU (21%).
| Microorganisms |
MICU |
SICU |
Total (n=85) |
| No. (%) |
No. (%) |
No. (%) |
| 67 (79) |
18 (21) |
|
| Stenotrophomonas maltophilia |
4 (6) |
0 (0) |
4 (5.9) |
| ESBL Klebsiella pneumoniae |
7(10) |
1(5.6) |
8(9.4) |
| Candida albicans |
10 (15) |
2 (11) |
12 (14) |
| Pseudomonas aeruginosa |
7(10) |
3(17) |
13 (15.3) |
| Klebsiella pneumoniae |
3(4.5) |
0 (0) |
3 (4) |
| Acinetobacter baumannii |
4 (6) |
2 (11) |
6 (7) |
| Staph.aureus |
2 (3) |
0 (0) |
2 (2.4) |
| ESBL E. coli |
3 (4.5) |
1 (5.6) |
4 (5) |
| Enterococcus faecium |
8 (12) |
1(5.6) |
9(11) |
| Staph haemolyticus |
3 (4.5) |
0 (0) |
3 (4) |
| MRSA |
3 (4.5) |
2 (11) |
5 (6) |
| Proteus mirabilis |
1(1.5) |
0 (0) |
1(1.2) |
| Staph epidermidis |
0 (0) |
1 (5.6) |
1(1.2) |
| Coagulase negative staphylococcus |
1 (1.5) |
2 (11) |
3 (3.5) |
| Enterobacter cloacae |
3 (4.5) |
0 (0) |
3 (3.5) |
| Candida tropicalis |
6 (9) |
3 (17) |
9 (11) |
| Carbapenamase-Resistant Klebsiella pneumoniae |
2 (3) |
0 (0) |
2 (2.4) |
Table 3: Microorganisms causing CLABSI in the period 2011-2016.
Discussion
The CLABSI surveillance and prevention program focusing on patient safety had a significant impact on CLABSI rates. During this study, a total of 1574 patients were admitted to MICU and 835 to SICU. Out of these, 85 patients developed CLABSIs.
The insertion bundle recommended by IHI comprises the following items: Hand hygiene, wearing personal protective equipment (PPE) for health care workers during insertion of a line, using chlorhexidine (2% with 70% alcohol) for skin antisepsis upon insertion of a central line, and fully covering the patient with a sterile drape exposing only the insertion site [4].
To our knowledge, there have been few surveillance studies from the Gulf region [9-11], however; the present study is the first to have considered outcomes of surveillance over 6 years from 2011 to 2016 in a tertiary teaching hospital with a total bed capacity of 845 with 35 adult ICU beds.
This retrospective study of CLABSI in adult ICUs in a Saudi Arabia hospital was carried out from 2011 to 2016. The study aimed to evaluate the effectiveness of implementing a central line bundle. After implementation of Central Line bundles of care, the rate of CLABSI infection showed a significant reduction (p ≤ 0.005) over the period of observation.
CLABSI is primarily a problem in ICUs patients. Our CLABSI results from year 2011 to 2013 are higher than those reported by the NHSN 2011 report [12]. A possible reason for this high rate of infection was due to not implementing the full CL bundle in 2011. The items of the bundle at that time included hand hygiene, placement of CL, the wearing of personal protective equipment (PPE) by health care workers during insertion of a line, and the use of iodine as a skin disinfectant.
The bundle started to be fully implemented in the year 2013 and aimed for central line patient outcomes of zero CLABSIs. This study emphasizes the efforts that were made to secure improvements to the prevention strategies and reducing CLABSI. The CL bundle implemented in 2013 involved the availability of skin antisepsis using chlorhexidine (2% with 70% alcohol) upon insertion of a central line and reminding physicians on a daily basis about the possibility of CL removal. The improvements secured can be attributed to the great commitment of the staff in following the daily bundle checklists and removing lines as early as possible and the effort of the infection control preventionist (ICP) during their daily rounds by double checking the maintenance bundle of ICU patients. The daily hand hygiene audit played a big role in reducing the risk of cross-infection among patients in the ICUs.
Conclusion
Despite the emergence of predominantly gram negative organisms, we believe that it is possible to achieve a zero CLABSI rate in Saudi Arabia. The NHSN data is accessible and an excellent benchmarking tool that may be used widely by various hospitals outside the United States. To achieve the desired outcomes, additional strategies such as alcohol-impregnated port protectors may be used; this will help increase the bundle’s success.
References
- Rosenthal VD, Maki DG, Rodrigues C, Alvarez-Moreno C, Leblebicioglu H, et al. (2010) Impact of International Nosocomial Infection Control Consortium (INICC) strategy on central line-associated bloodstream infection rates in the intensive care units of 15 developing countries. Infect Control Hosp Epidemiol 31: 1264-1272.
- Crnich CJ (2010) Estimating excess length of stay due to central line-associated bloodstream infection: Separating the wheat from the chaff. Infect Control Hosp Epidemiol 31: 1115-1117.
- Barnett AG, Graves N, Rosenthal VD, Salomao R, Rangel-Frausto MS, et al. (2010) Excess length of stay due to central line-associated bloodstream infection in intensive care units in Argentina, Brazil and Mexico. Infect Control Hosp Epidemiol 31: 1106-1114.
- Advani S, Reich NG, Sengupta A, Gosey L, Milstone AM, et al. (2011) Central line-associated bloodstream infection in hospitalized children with peripherally inserted central venous catheters: Extending risk analyses outside the intensive care unit. Clin Infect Dis 52: 1108-1115.
- Marra AR, Cal RG, Durão MS, Correa L, Guastelli LR, et al. (2010) Impact of a program to prevent central line-associated bloodstream infection in the zero tolerance era. Am J Infect Control 38: 434-439.
- Cynthia C, Chernecky RN, Macklin D, Jarvis WR, Joshua TV (2014) Retraction notice to: Comparison of central line-associated bloodstream infection rates when changing to a zero fluid displacement intravenous needleless connector in acute care settings. Am J Infect Control 42: 200-202.
- Greenhall AM, House Bat Management (1982) Northern Prairie Wildlife Research Center Online: Jamestown, ND.
- Talbot TR, Johnson JG, Anders T, Hayes RM (2015) Comparison of NHSN-defined central venous catheter day counts with a method that accounts for concurrent catheters. Infect Control Hosp Epidemiol 36: 107-109.
- Khalid I, Al Salmi H, Qushmaq I, Al Hroub M, Kadri M, et al. (2013) Itemizing the bundle: achieving and maintaining "zero" central line-associated bloodstream infection for over a year in a tertiary care hospital in Saudi Arabia. Am J Infect Control 41: 1209-1213.
- Hassan N, Alhubai R (2015) Erratum to: Effect of insertion route on risk of central line-associated bloodstream infection in critically ill patients. Crit Care 19: 315.
- Balkhy HH, El-Saed A, Al-Abri SS, Alsalman J, Alansari H, et al. (2017) Rates of central line-associated bloodstream infection in tertiary care hospitals in 3 Arabian gulf countries: 6 year surveillance study. Am J Infect Control 45: 49-51.
- Dudeck MA, Horan TC, Peterson KD, Allen-Bridson K, Morrell G, et al. (2011) National Healthcare Safety Network (NHSN) report, data summary for 2010, device-associated module. Am J Infect Control 39: 798-816.