Keywords
Body Mass Index; Interleukin; Psoriasis Area; Severity Index
Abbreviations
BMI: Body Mass Index; IL: Interleukin; PASI: Psoriasis Area and Severity Index
Introduction
Objectives
To assess the impact of a dietary intervention combined with physical exercise for on improving plaque psoriasis in children.
Methods
This study included 30 children with chronic plaque psoriasis who did not achieve clearance after 3 weeks of continuous topical treatment. They were randomized to receive either a 12- week quantitative and qualitative dietary plan associated with physical exercise and aerobic training or simple informative counseling at baseline about the utility of healthy diet and increasing physical fitness for clinical control of psoriatic disease. The main outcome was any reduction of the Psoriasis Area and Severity Index (PASI) from baseline to week 12.
Data analysis and statistical design
The data were collected and analyzed through two types of statistics by using Minitab program version 16 as follows:
Descriptive statistics: The mean and standard deviation of each group were calculated for each parameter.
• Mean (X)=summation of x / number of x.
• Standard deviation (SD)=root square of variance.
Inferential statistics
• Comparing mean values between pre and post of each parameter within each group was done by paired t-test.
• Comparing mean values of each parameter between the two groups before and after three months of treatment program was done by unpaired t- test.
• The probability in this study was 0.05%.
Patients and Methods
Thirty children of both sexes diagnosed with plaque psoriasis were selected from Banha fever hospital (BFH), they were assigned randomly into two groups of equal numbers (15 for each group).
Participants
Children with plaque psoriasis age range from 11 to 18 years old both sexes with pasi above 10 and they are not under any systematic or topical treatment for 3 month before they were classified into two groups:
A: Control group: Children of this group received a specially designed diet therapy regime.
B: Study group: Patients in this group received exercise in addition to diet program in a form of aerobic exercise+ resistance exercise for 8 weeks 3 times per week for one hour, they were treated within (65%-95%) from maximums heart rate.
Instrumentation
1. For assessment: (Psoriasis severity index): The severity of psoriasis can be defined by the percentage of body surface area involved. In mild cases, the lesions cover less than 10% of the body surface, in moderate cases 10-20% and in the severe cases the lesions affect more than 20% of skin surface [1].
2. Aerobic Treatment Tool
• Treadmill which has Black 500W Portable Folding Electric Motorized Treadmill Running Machine with microcontroller heart rate monitors.
• Seated raw machine
• Lateral pull device
• Cauf raise device
• Leg press device
Assessment for motor performance: The six minute walk test is an excellent procedure for measuring functional capacity for exercises in children from age 3 Individual walk without physical assistance for 6 minutes and the distance is measured [2].
Intervinsion
All the patients had the same diet.
The food schedule based on types not the quantities or calories.
Food regime in schedule:
Day 1
Breakfast: Beans with bread made from corn.
Lunch: Adass with the same bread.
Dinner: Tuna with Cucumber and carrots green salad and in fruits, green apple.
Day 2
Breakfast: Chickpeas with bread made from corn.
Lunch: Grilled chicken.
Dinner: Tuna and Salad with meals are lettuce and cucumber and fruits, pineapple.
Day 3
Breakfast: Adass with corn bread.
Lunch: Sauté vegetables.
Dinner: Tuna and salad with the 3 meals include cucumber carrots, and lettuce.
Day 4
Breakfast launch and dinner are the same sauté vegetables except the forbidined list.
Day 5
Breakfast: Beans with non-gluten bread.
Lunch: Grilled chicken.
Dinner: Honey with corn bread and salad cucumber and carrots and fruits, dates.
Day 6
Breakfast: Adass with corn bread.
Lunch: sauté vegetables.
Dinner: Tuna and salad cucumber and carrots and fruits, green apple and pomegranate.
Day 7
The breakfast lunch and dinner are the same beans with corn bread along with salad, cucumber and carrots and fruits dates.
Drinks in the 7 day were same:
• 1cup of ginger
• 1cup of green tea
• Add honey instead of sugar
3 liters of water add less than 10 g of bicarbonate to a cup of water and let the child drink it once a day.
The regime was followed for both groups; for the study group addition of ex, programme was given including:
Exercises
The patient is asked to walk 65% to 95% of Maximus heart rate on the treadmill for one hour detecting hear rate by a pulse measured device attachment to the treadmill and doing both lateral pull down on the specific device for that exercise, pecks exercise on pectoral is seated raw also both calf raise and leg press repetition for 50% of body weight.
Procedure: One patient walks on treadmill for 15 minutes and 5 minutes rest with a speed of 3.5 m/h. This study was conducted to investigate the effect of diet and exercise on improvement of plaque psoriasis in children.
The present study was performed on 30 children with plaque psoriasis. They were selected from both sexes with age ranged from 11 to 18. The children were divided into two group of equal number (fifteen children each) represented control group:
• Control group who received diet regime only and study group.
• The one who received diet and exercise by using watt's system.
Evaluation of both groups was done pre and post treatment course which continued for 3 successive months by using psoriasis severity assessment scale, weight and 6 minute walk test.
Evaluation of both groups was done pre and post treatment course which continued for 3 successive months by using psoriasis severity assessment scale, weight and 6 minute walk test.
Here are photographs of patients before and after treatment approach from group b for 12 weeks on children from 11 to 18 years old (Figures 1 and 2).
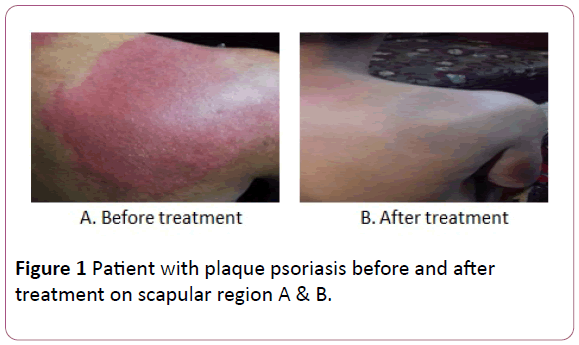
Figure 1: Patient with plaque psoriasis before and after treatment on scapular region A & B.
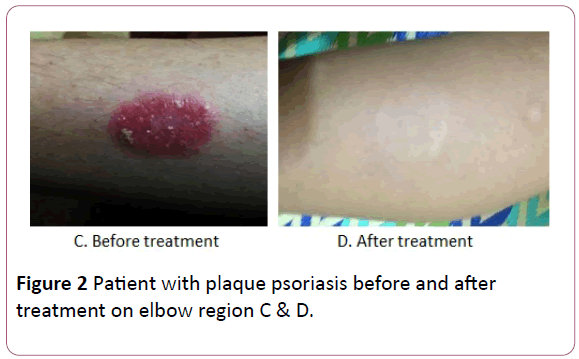
Figure 2: Patient with plaque psoriasis before and after treatment on elbow region C & D.
Our results of demographic data revealed no significant differences when comparing the pretest mean value in both groups (A) and (B). This indicated the homogeneity of the children sample selected.
Evaluation of both groups was done pre and post treatment course which continued for 3 successive months by using psoriasis severity assessment scale, BMI and 6 minute walk test.
There is no significant differences when comparing the pretest mean value in both groups (A) and (B) indicated the homogeneity of the children sample selected.
In this study pasi scale was uses for evaluation of psoriasis severity in group A and B and 6 minute walk test for evaluation of effectiveness of exercise just in group (B).
The Psoriasis Area and Severity Index (PASI) is a score used by doctors and nurses to record psoriasis severity. It is widely used to assess the progress of people receiving treatment for psoriasis, particularly in research trials. PASI has become the most widely used measure of psoriasis severity internationally. It does not examine arthritis for which other scores are available Using pasi score was confirmed with its objectivity and accuracy by Naldi [1].
Evaluation of psoriasis in pre-treatment groups show increased severity of psoriasis in both groups and increasing the pasi score in those children showed that they have high severity of the disease [3].
We also found decreasing in the numbers of meters measured in 6 minutes show low level of fitness, endurance and functional capacity in both groups by using numerical 6 minute walk test in both groups [4].
We also recorded the weight of the patient aiming to find a connection between weight, chronic inflammation and psoriasis aiming to confirm previous study done by Naldi [5], reported the positive effect of using a healthy diet on inflammatory mediators in the human body and the reduction of calories intake aim to subside inflammation of chronic disease like psoriasis.
Improvement in group A who received a diet therapy aiming to prove the effectiveness of food on psoriasis matching [6] as he linked between general inflammation of the skin caused by psoriasis and types of food they eat. During the fasting state, a reduction in the activation of TCD4cells and an increase in the number and/or function of the anti-inflammatory cytokine interleukin 4 have been observed; Calorie restriction leads to a reduction in oxidative stress [7].
We found decreasing in pasi score both the manually and computerized data this indicate improvement of the children receiving diet therapy alone in the control group so psoriasis had good prognosis in those children.
Decreasing in weight in them after 3 month re-assessment matching [8] who proves the connection of BMI and psoriasis as his study on patient with high BMI shows increasing in their psoriasis severity index as increasing their desquamation redness and their affection sits.
But with pointing to 6 minute walk test in group A significant differences was found between both pre and post assessment and this was not predicted as group A did not receive an exercise programme affecting their endurance or functional capacity but this was matching [9] as reducing the weight in group A that was noticed had an effect on improving energy transfer and the oxidative phospholration theory that was proved to be the dependent energy equation in this kind of competitive test.
In group (B) the study groups was found a decrease in pasi score changing from severe to moderate and from moderate to mild and also from severe to complete disappearance of psoriasis and so on as this group show magnificent results comparing to group A coping with [10] words about that as exercise improve psoriasis as healthy diet and physical activity maintain the anti-inflammatory phenotype of adipose tissue, which is marked by small adipocyte size and the presence of anti-inflammatory immune cells, such as M2-type macrophages and CD4+ regulatory T (TReg) cells. A positive energy balance and physical inactivity lead to an accumulation of visceral fat and adipose tissue infiltration by pro-inflammatory macrophages and T cells. The pro-inflammatory M1 macrophage phenotype predominates and inflamed adipose tissue releases proinflammatory adipocytes, such as tumor necrosis factor (TNF), which causes a state of persistent low-grade systemic inflammation. This may promote the development of insulin resistance, tumor growth, neurodegeneration and atherosclerosis. Atherosclerosis is exacerbated by the deleterious changes in the blood lipid profile that are associated with a lack of physical activity. LDL: Low-density lipoprotein; IL-6: interleukin-6; TLR: Toll-like receptor [11].
Also Weight decreased documenting the effect of weight reduction on psoriasis prognosis as A case report of a patient with psoriasis and metabolic syndrome suggests that the treatment program designed by nutritionists and endocrinologists through the modification of diet and treatment of comorbidities provided an improvement in blood glucose, cholesterol and BMI, along with a clinical improvement in psoriasis [12].
6 minute walk test was improved in group B and this was predicted matching about engaging in an exercise program raise recorded numbers of meter walked in 6 minutes as this group received an exercise program and this also connect to the fact that improving in functional and endurance capacity has positive effect on psoriasis prognosis [11] when comparing results between group A and B improving in post assessment it was found that group B has positive higher value than group B this is because the added effect of exercise on improving psoriasis prognosis as both groups received diet therapy and got their benefits while group be got the added effect of exercise in the study he opened a window on exercise and relation of decreasing inflammation. This may be mediated not only via a reduction in visceral fat mass with a subsequent decreased production and release of pro-inflammatory adipocytes) but also by induction of an anti-inflammatory environment with each bout of exercise [13].
The BMI of the two groups was non-significant results and this was predicted as the exercised group B received an exercise regime which has no effect on BMI according to Gutlin [14].
Comparing the post results of the two groups 6 minute walk test was not changed between the two groups this rejected gutlin studies about the effect of his protocol on functional capacity as it is supposed that group B had higher 6 minutes’ walk test value than other group.
These results based on the main factors first decreasing weight and calorie restriction also consuming good rich in fibers and also the reduction in AA intake and HDL give a good key to demonstrate the effect of vegetarian diet on improving the psoriasis in children matching [15].
Also consuming food rich in anti-inflammatory precursors like omega 3 found in tuna that both group had it in their diet regime has (EPA) [16].
Secondly adding exercise regime to group B give it higher value of improving in those patients who participated as one of their members cause of hormonal responses usually precede the rise in circulating concentrations of cytokines, and the magnitude of the elevations in plasma cortisol so reducing inflammation is a marker for the function of their hormones [17].
The present randomized study showed that an intervention combining diet restriction and promotion of physical exercise with the aim of reducing children with active psoriasis affected psoriasis severity beyond the effect of the diet treatment administered over a 12 week period.
Even with only a slight mean reduction in weight, the active intervention group exhibited significantly reduced disease severity.
This matched study included 303 overweight or obese patients with moderate-to-severe chronic plaque psoriasis who did not achieve clearance after 4 weeks of continuous systemic treatment.
They were randomized to receive either a 20-week quantitative and qualitative dietary plan associated with physical exercise for weight loss or simple informative counseling at baseline about the utility of weight loss for clinical control of psoriatic disease. The main outcome was any reduction of the Psoriasis Area and Severity Index (PASI) from baseline to week 20 [18].
Exercise offers other health benefits as well, says Yamauchi. By helping you manage your weight, regular exercise may also decrease cardiac risks. Those heart risks are higher in people with psoriasis. It may also make psoriasis medication work better. Treatment tends to not work as well in overweight people [12].
These results also are supported by Smith [19] as he proved the effectiveness of changing style of food in healthy way and avoiding eating high fatty meals also noticed worsen of itching and psoriasis symptoms.
Giving these results a hand was done by Rucevic [20] as he said that fasting and reducing food rich in complex sugar made the psoriasis speeded in un predicted way in contract to food which had low calories.
Relation between food and psoriasis and metabolic syndrome was investigated proving our idea about food and an auto immune disease like psoriasis [21-28].
Results
Results and statistical analysis of the patient's demographic data among control group and study group
Age (years): The patients participated in this study were classified into two groups of equal number.
Control group: Include 15 children with age ranged from 11 to 18 years with the mean ± SD value was (14.3 ± 2.39) as shown in (Table 1) and figures.
| Variable |
Groups |
Mean ± SD |
Range |
t-value |
p-value |
| Age (years) |
Control group |
14.3 ± 2.39 |
11 – 18 |
1.53 |
0.137 |
| Study group |
12.93 ± 2.49 |
|
|
NS |
SD: Standard Deviation; NS: Non-Significant.
Table 1: The mean values of the age (years) within the two groups.
Comparing the mean values of PASI using manual technique among the two groups: The results of control group revealed that, pretreatment mean ± SD value was 30.73 ± 12.93, while that of post treatment was 23.91 ± 13.91. According to paired ttest; the significant difference was revealed (p=0.004) when comparing between pre and post treatment mean values (MD=6.82) as shown in (Table 2) and figures and % of improvement is 11.09%.
| Pasi using manual technique |
Control group |
Study group |
| |
Pre treatment |
Post treatment |
Pre treatment |
Post treatment |
| Mean ± SD |
30.73 ± 12.93 |
23.91 ± 13.91 |
21.92 ± 10.98 |
7.98 ± 7.07 |
| MD |
6.82 |
13.94 |
| % of improvement |
11.09% |
31.79% |
| t-value |
3.39 |
8.59 |
| p-value |
0.004 |
0 |
| Level of Significant |
S |
S |
Pre: Before application of treatment; Post: After eight weeks of treatment; SD: Standard Deviation; MD: Mean Difference; % of improvement: Percentage of improvement;t-value: Paired and Un-paired t- test value;p-value: Probability value;S: Significant.
Table 2: Comparing the mean values of pasi using manual technique among the two groups.
The results of study group revealed that, pretreatment mean ± SD value was 21.92 ± 10.98, while that of post treatment was 7.98 ± 7.07. According to paired t-test; the significant difference was revealed (p=0.000) when comparing between pre and post treatment mean values (MD=13.94) as shown in Table 2, figures and % of improvement is 31.79%.
Comparing the mean values of PASI using manual technique between the two groups: According to unpaired t-test as presented in (Table 3) and illustrated in figures, when comparing the two groups (control and study) before treatment, the mean ± SD values were 30.73 ± 12.93 and 21.92 ± 10.98 respectively which indicated no significant difference (p=0.054), while comparing the two groups after eight weeks of treatment, the mean ± SD values were 23.91 ± 13.91 and 7.98 ± 7.07 respectively which indicated a significant difference (p=0.001) in favor of study group (MD=15.93) and % of improvement was 33.31%.
| Two Groups |
Pasi using manual technique |
| Pre- treatment |
Post- treatment |
| Control group |
Study group |
Control group |
Study group |
| Mean ± SD |
30.73 ± 12.93 |
21.92 ± 10.98 |
23.91 ± 13.91 |
7.98 ± 7.07 |
| MD |
8.81 |
|
15.93 |
|
| t-value |
2.01 |
|
3.95 |
|
| p-value |
0.054 |
|
0.001 |
|
| Level of Significant |
NS |
|
S |
|
Pre: Before application of treatment;Post: After eight weeks of treatment; SD: Standard Deviation; MD: Mean Difference; % of improvement: Percentage of improvement; t-value: Paired and Un-paired t- test value;P-value: Probability value; S: Significant; NS: Non-Significant.
Table 3: Comparing between pre and post treatment mean values of PASI using manual technique between the two groups.
Results and statistical analysis of 6 minute walk test among control group and study group
Comparing the mean values of 6 minute walk test among the two groups: The results of control group revealed that, pretreatment mean ± SD value was 70.31 ± 6.75, while that of post treatment was 73.45 ± 7.57. According to paired t-test; the significant difference was revealed (p=0.000) when comparing between pre and post treatment mean values (MD = 3.14) as shown in (Table 4) and figures and % of improvement=4.47%.
| 6 minute walk test |
Control group |
Study group |
| Pre treatment |
Post treatment |
Pre treatment |
Post treatment |
| Mean ± SD |
70.31 ± 6.75 |
73.45 ± 7.57 |
67.06 ± 6.48 |
70.14 ± 6.66 |
| MD |
3.14 |
3.08 |
| % of improvement |
4.47% |
4.59% |
| t-value |
5.29 |
4.94 |
| p-value |
0.001 |
0 |
| Level of Significant |
S |
S |
Pre: Before application of treatment; Post: After eight weeks of treatment; SD: Standard Deviation; MD: Mean Difference; % of improvement: Percentage of improvement; t-value: Paired and Un-paired t- test value; p-value: Probability value; S: Significant.
Table 4: Comparing the mean values of 6 minute walk test among the two groups.
The results of study group revealed that, pretreatment mean ± SD value was 67.06 ± 6.48, while that of post treatment was 70.14 ± 6.66. According to paired t-test; the significant difference was revealed (p=0.000) when comparing between pre and post treatment mean values (MD=3.08) as shown in Table 4, Figures and % of improvement=4.59%.
Comparing the mean values of 6 minute walk test between the two groups: According to unpaired t-test as presented in (Table 5) and illustrated in figures, when comparing the two groups (control and study) before treatment, the mean ± SD values were 70.31 ± 6.75 and 67.06 ± 6.48 respectively which indicated no significant difference (p=0.189), while comparing the two groups after eight weeks of treatment, the mean ± SD values were 73.45 ± 7.57 and 70.14 ± 6.66 respectively which indicated a non-significant difference (p=0.215) between two groups (MD=3.31).
| Two Groups |
6 minute walk test |
| Pre- treatment |
Post- treatment |
| Control group |
Study group |
Control group |
Study group |
| Mean ± SD |
70.31 ± 6.75 |
67.06 ± 6.48 |
73.45 ± 7.57 |
70.14 ± 6.66 |
| MD |
3.25 |
3.31 |
| t-value |
1.35 |
1.27 |
| p-value |
0.189 |
0.215 |
| Level of Significant |
NS |
S |
Pre: Before application of treatment; Post: After eight weeks of treatment; SD: Standard Deviation; MD: Mean Difference; % of improvement: Percentage of improvement; t-value: Paired and Un-paired t- test value; p-value: Probability value; S: Significant; NS: Non-Significant.
Table 5: Comparing between pre and post treatment mean values of 6 minute walk test between the two groups.
Body mass index (BMI)
Comparing the mean values of Body mass index (BMI) among the two groups: The results of control group revealed that, pretreatment mean ± SD value was 25.96 ± 7.04, while that of post treatment was 23.74 ± 6.55.
According to paired t-test; the significant difference was revealed (p=0.000) when comparing between pre and post treatment mean values (MD=2.22) as shown in (Table 6), figures and % of improvement=8.55%.
| Body Mass Index (BMI) |
Control group |
Study group |
| Pre treatment |
Post treatment |
Pre treatment |
Post treatment |
| Mean ± SD |
25.96 ± 7.04 |
23.74 ± 6.55 |
26.8 ± 5.49 |
23.62 ± 4.93 |
| MD |
2.22 |
3.18 |
| % of improvement |
8.55% |
11.86% |
| t-value |
5.63 |
5.56 |
| p-value |
0 |
0 |
| Level of Significant |
S |
S |
Pre: Before application of treatment Post: After eight weeks of treatment; SD: Standard Deviation; MD: Mean Difference;% of improvement: Percentage of improvement; t-value: Paired and Un-paired t- test value; p-value: Probability value; S: Significant.
Table 6: Comparing the mean values of (BMI) among the two groups.
The results of study group revealed that, pretreatment mean ± SD value was 26.8 ± 5.49, while that of post treatment was 23.62 ± 4.93. According to paired t-test; the significant difference was revealed (p=0.000) when comparing between pre and post treatment mean values (MD=3.18) as shown in (Table 6), figures and % of improvement is 11.86%.
Comparing the mean values of body mass index (BMI) between the two groups: According to unpaired t-test as presented in (Table 7) and illustrated in figures, when comparing the two groups (control and study) before treatment, the mean ± SD values were 25.96 ± 7.04 and 26.8 ± 5.49 respectively which indicated no significant difference (p=0.719), while comparing the two groups after eight weeks of treatment, the mean ± SD values were 23.74 ± 6.55 and 23.62 ± 4.93 respectively which indicated a non-significant difference (p=0.955) between two groups (MD=0.12).
| Two Groups |
Body Mass Index (BMI) |
| Pre- treatment |
Post- treatment |
| Control group |
Study group |
Control group |
Study group |
| Mean ± SD |
25.96 ± 7.04 |
26.8 ± 5.49 |
23.74 ± 6.55 |
23.62 ± 4.93 |
| MD |
0.84 |
0.12 |
| t-value |
0.36 |
0.06 |
| p-value |
0.719 |
0.955 |
| Level of Significant |
NS |
NS |
Pre: Before application of treatment; Post: After eight weeks of treatment; SD: Standard Deviation; MD: Mean Difference; % of improvement: Percentage of improvement; t-value: Paired and Un-paired t- test value; p-value: Probability value; NS: Non-Significant.
Table 7: Comparing between pre and post treatment mean values of Body Mass Index (BMI) between the two groups.
Conclusion
Scientists say there's little evidence at the moment to support the notion that diet can have a major impact on the disease. But many people with psoriasis swear they've found relief by changing what they eat. Dropping surplus weight and improving your cholesterol and blood sugar is empowering—even if these changes do little for your skin or joints.
Patients following a healthful diet, people should keep their doctors informed about the changes they are making—and be careful not to do anything that might actually cause harm. "The downside [of changing the way you eat] is the time, cost and energy to follow a diet you may not enjoy, and that won't have proven benefits for your health."
Few studies had reject that and also are not giving absolute rejected data such as mechanisms that have been discussed, the direct cause of these positive effects on the symptoms of psoriasis remains unknown [7].
Acknowledgement
We wish to thank Cairo university faculty of physical therapy department of pediatric, who assisted us with developing the treatment plan.
References
- Naldi L, Gambini D (2007) The clinical spectrum of psoriasis. Clin Dermatol 25: 510-518.
- Geiger R, Strasak A, Treml B, Gasser K, Kleinsasser A, et al. (2007) Six-minute walk test in children and adolescents. J Pediatr. 2007150: 395-9, 399.e1-2.
- Kirby B, Fortune DG, Bhushan M, Chalmers RJ, Griffiths CE (2000) The Salford Psoriasis Index: A holistic measure of psoriasis severity. Br J Dermatol 142: 728-732.
- Hamilton DM, Haennel RG (2000) Validity and Reliability of the 6-Minute Walk Test in a Cardiac Rehabilitation Population J Cardiopulm Rehabil 20: 156-164.
- Naldi L, Parazzini F, Peli L, Chatenoud L, Cainelli T (1996) Dietary Factors and the risk of psoriasis. Results of an Italian case-control study. Br J Dermatol 134: 1365-2133.
- Muller H, De Toledo FW, Resch KL (2001) Fasting followed by vegetarian diet in patients with rheumatoid arthritis: a systematic review. Scandinavian Journal of Rheumatology 30: 1-10.
- Wolters M (2005) Diet and psoriasis - experimental clinical and evidence. Br J Dermatol 153: 706-714.
- Farías MM, Serrano V, De La Cruz C (2011). Psoriasis y obesidad: revision recomendaciones prácticas. Actas Dermo-Sifiliográficas 102: 1-7.
- Jakicic JM, Clarke K, Coleman E, Donnelly JE, Foreyt J, et al. (2001) Appropriate intervention strategies for weight loss and prevention of weight regain for adults. Med Sci Sports Exerc 33: 2145-2156.
- Mathis D, Shoelson S (2011) Immuno metabolism: an emerging frontier. Nature Rev Immunol 11: 81-93.
- Gleeson M, Bishop NC, Stensel DJ, Lindley MR, Mastana SS, et al. (2011) The anti-inflammatory effects of exercise: mechanisms and implications for the prevention and treatment of disease. Nat Rev Immunol 11: 607-615.
- Saraceno R, Ruzzetti M, De Martino MU, Di Renzo L, Cianci R, et al. (2008) Does metabolic syndrome influence psoriasis? Eur Rev Med Pharmacol 12: 339-341.
- Petersen AM, Pedersen BK (2005) The anti-inflammatory effect of exercise. J Appl Physiol 98: 1154-1162.
- Gutin B, Barbeau P, Owens S, Lemmon CR, Bauman M, et al. (2002) Effects of exercise intensity on cardiovascular fitness, total body composition, and visceral adiposity of obese aldoscent children. Am J Clin Nutr 75: 818-826.
- Dutra-de-Oliveira JE (2000) Lipids. IN: Nutritional Sciences, Sarvier, São Paulo, Brazil.
- Guida B, Napoleone A, Trio R, Nastasi A, Balato N, et al. (2014) Energy-restricted, n-3 polyunsaturated fatty acids-rich diet improves the clinical response to immuno-modulating drugs in obese patients with plaque-type psoriasis: a randomized control clinical trial. Clin Nutr 33: 399-405.
- Bergmann M, Gornikiewicz A, Sautner T, Waldmann E, Weber T, et al. (1999) Attenuation of catecholamine-induced immune suppression in whole blood from patients with sepsis. Shock 12: 421-427 .
- Naldi L, Conti A, Cazzaniga S, Patrizi A, Pazzaglia M, et al. (2014) Diet and physical exercise in psoriasis: a randomized controlled trial. Br J Dermatol 170: 634-642.
- Smith N, Weymann A, Tausk FA, Gelfand JM (2009). Complementary and alternative medicine for psoriasis: A qualitative review of the clinical trial literature. J Am AcadDermatol 61: 841-856.
- Rucevi? I, Perl A, Barisi?-Drusko V, Adam-Perl M (2003) The role of low energy diet in psoriasis vulgaris treatment. CollAntropol 27: 41-48.
- Gisondi P, Tessari G, Conti A, Piaserico S, Schianchi S, et al. (2007) Prevalence of metabolic syndrome in patients with psoriasis: a hospital-based case-control study. Br J Dermatol 157: 68-73.
- Kirby B, Fortune DG, Bhushan M, Chalmers RJ, Griffiths CE (2000) The Salford Psoriasis Index: A holistic measure of psoriasis severity. Br J Dermatol 142: 728-732.
- Langley R, Krueger G, Griffiths CE (2005) Psoriasis: epidemiology, clinical features, and quality of life. Ann Rheum Dis 64: ii18–ii23.
- Gleeson M, Bishop NC, Stensel DJ, Lindley MR, Mastana SS, et al. (2011).The anti-inflammatory effects of exercise: mechanisms and implications for the prevention and treatment of disease. Nature Reviews Immunology 11: 607-615.
- Frankenfield DC, Rowe WA, Cooney RN, Smith JS, Becker D (2001) Limits of body mass index to detect obesity and predict body composition. Nutrition 17: 26-30.
- Dutra-de-Oliveira JE (2000) Lipids. IN: Nutritional Sciences, Sarvier, ,São Paulo, Brazil.
- Smith KE, Fenske NA (2000) Cutaneous manifestations of alcohol abuse. J Am Acad Dermatol 43: 1-16.
- Pawlosky RJ, Hibbeln JR, Lin Y, Goodson S, Riggs P, et al. (2003) Effects of beef- and fish-based diets on the kinetics of n-3 fatty acid metabolism in human subjects. Am J Clin Nutr 77: 565-572.