Keywords
Animal behavior; Beef; Eating behavior; Feeder design adaptation; Performance
Introduction
A single-space concentrate feeder with lateral protections forming a chute (SF) is an alternative feeder to conventional collective feeder used, to record individual concentrate intakes for research purposes [1,2], and also to decrease the total concentrate consumption (intake plus wastage) without impairing overall fattening performance, rumen health, and welfare in Holstein bulls fed high-concentrate diets [3]. However, the former study revealed that animals reared on SF showed difficulty accessing feed for first 2 weeks after arrival at the fattening farm due to feeder design, even with widening of the chute for first 4 days. Therefore, these calves during the arrival period (first 2 weeks) had diminished concentrate consumption and growth compared with those fed in multiple-space feeders (3.0 vs. 3.8 ± 0.25 kg/d for intake, and 1.3 vs. 1.6 ± 0.12 kg/d for average daily gain (ADG), respectively). These results were in agreement with findings reported by Gonyou and Stricklin [4]. Furthermore, complementary observations and records support the hypothesis that animals did not adapt well to the SF [3]. It is well-known that ensuring adequate feed consumption soon after arrival at fattening farm is crucial to improve performance [5], and increasing the number of feeding places increases concentrate intake and ADG in newly arrived fattening calves [6]. Thus, in order to facilitate the feed access and encourage intake after arrival at the fattening farm, it was hypothesized that concentrate consumption and animal growth in SF-fed calves could be improved by two complementary arrangements. These arrangements were providing free access to feed for first 4 days (without lateral protections, the chute), together with an additional feeder (2 feeding spaces per pen) during the first 2 weeks. The objective of the present study was to evaluate the effect of an adaptation strategy (SF without lateral protections for first 4 days, and additional feeder in which feed offered was gradually reduced for first 14 days) in SF-fed Holstein calves on performance, eating pattern, and animal behavior during the first 6 fattening weeks after arrival.
Materials and Methods
Animals, facilities, and treatments
Animals were reared under commercial conditions in a farm owned by Agropecuaria Montgai SL (Lleida, Spain), and were managed following the principles and specific guidelines of IRTA (Institut de Recerca i Tecnologia Agroalimentàries) Animal Care Committee. Two hundred sixteen male Holstein calves (120 ± 3.8 kg initial BW and 102 ± 2.7 days of age) from two separate fattening batches (114 and 102 animals for each batch) were used in a replicated study. The first batch was in summer of 2013 (from June to August), and the other took place in winter of 2015 (from January to March). The length of the experiment was 42 days after arrival at the fattening farm (14 days of arrival period and 28 days of initial growing period). After arrival, calves were weighed, fitted with a radio frequency transponder on the left ear, and randomly allocated to one of 6 pens (19 and 17 animals per pen for each batch). Each pen was equipped with a computerized concentrate single-space feeder (0.50 m length × 0.26 m width × 0.15 m depth), with lateral protections (1.40 m length × 0.80 m height) forming a chute (SF) [3]. Concentrate feeders were manufactured in stainless steel. Furthermore, covered pens (12 m length × 6 m width) were deep-bedded with straw, which had a separate straw feeder (3.00 m length × 1.12 m width × 0.65 m depth; 7 feeding spaces), and a water bowl.
Each pen was randomly assigned to one of the 2 treatments that consisted of implementing two different strategies of adaptation to SF design during the arrival period (first 14 days after arrival): First is a conventional adaptation strategy (CA), and second is an alternative adaptation strategy (AA). The CA was the strategy followed in Verdú et al. [3], widening the chute for first 4 days of the arrival period to facilitate the feeder access; after this adaptation time, the width of the chute was adjusted to 42 cm providing sufficient space for only one animal to eat comfortably at a time. Conversely, the AA treatment was designed to enhance the adaptation of the animals to the feeder design to improve the feed access and stimulate intake. Thus, following arrangements were implemented: 1) the chute was not placed for first 4 days after arrival (Figure 1), leaving the feeder access completely free without lateral protections (the chute); and 2) an additional single-space concentrate feeder (0.60 m length × 0.50 m width × 0.20 m depth), without lateral barriers, was placed on the left side of the computerized feeder (Figure 1) in which supplementary feed was provided daily at 10.00 hours, diminishing progressively the amount offered each day by 5 kg throughout the initial 14 days of study (from 70 to 0 kg per pen and day).
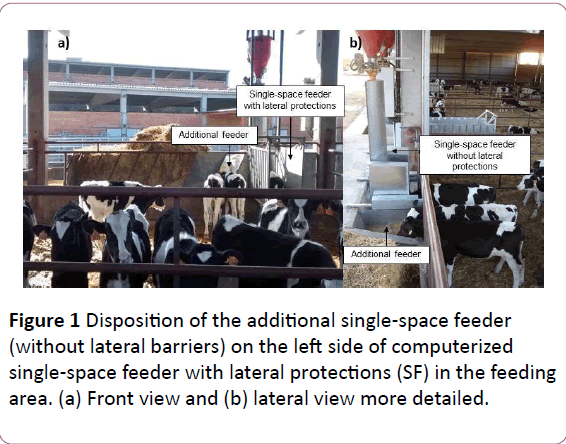
Figure 1: Disposition of the additional single-space feeder (without lateral barriers) on the left side of computerized single-space feeder with lateral protections (SF) in the feeding area. (a) Front view and (b) lateral view more detailed.
Concentrate computerized feeder
Animals were fed ad libitum concentrate via a computerized feeder (Voltec®, Lleida, Spain), which was composed of a single trough with lateral protections forming a chute, and it used a radio frequency technology to record the daily concentrate consumption and eating behavior for each animal within a pen. All feeders were continuously provided with feed by automatic feeding system, as described in Verdú et al. [3]. The chute provided protection when an animal accessed the feeder to eat, and prevented interference from other close animals from the sides, as the antenna detected transponders whenever animals were within 50 cm of feeder. Each feeder was equipped with an antenna (Azasa-Allflex, Madrid, Spain), that emitted a 130-kHz electromagnetic field to detect each animal visit via a passive transponder (half-duplex), which was encased in plastic ear tags (Azasa-Allflex, Madrid, Spain) and placed in the left ear of each bull. In addition, the feeder was suspended on 4 load cells (Utilcell, Barcelona, Spain), which constituted a scale. This scale was programmed to transmit the feed weight, at 1-min intervals or when a weight change was detected, to a PLC (Allen-Bradley model 1769-L35E; Rockwell Automation, Milwaukee, USA, Programmable Logic Controller), and, lastly, displayed on a personal computer. The scales were calibrated weekly. At each animal visit at the feeder the bull was identified, and the computer recorded the initial and final feed weight, with its corresponding initial and final time. The antenna logged the presence of each transponder every 5-s for as long as the transponders were within the read panel range as an animal visit; when another transponder was detected or the antenna did not log any transponder for 60-s a new visit was created. Before the study started, the computerized concentrate feeder was validated using data from the 6 feeders. The validation was conducted in random different days during a period of 4 months; each day was performed by one of 2 observers, who observed 2 feeders simultaneously for 60 min. A digital timer synchronized with the time of computer and reader scale panel of feed weight were used. A total of 510 events or visits were recorded. The validation method consisted of recording visually for each visit the animal number identification, the initial time and feed weight when animal entered to the feeder, and the final time and feed weight when animal left the feeder. After, from two sources of data collection (software and observations), the meal size and meal duration were calculated as parameters to validate the accuracy of system [1]. The coefficients of determination for meal size and meal duration were 0.97 and 0.98, respectively (p<0.01). Furthermore, the sensitivity (99.5%) and the specificity (99.9%) were calculated [7] obtaining greater values than others reported by DeVries et al. [8]. In conclusion, the high values for sensitivity, specificity and predictability indicated that the described concentrate computerized feeder was an adequate system to monitor individual eating behavior in beef cattle (the number of visits per animal, the length of each visit, the amount of concentrate consumed per visit and per animal, and the total daily eating time and concentrate consumption per animal).
Furthermore, if a calf had not been detected at the feeder during previous 24 hours, the computerized feeder activated an alarm. This alarm notification was used as an animal badlyadaptation record, which indicated an inability to adapt to the SF design. Each time that one calf recorded an alarm, and no consumption was recorded the next day, this particular animal was assisted to access to the feeder ensuring that the transponder worked and the animal ate. Five accumulated alarms for 1 animal were considered as a non-adaptation criterion and, therefore, this calf was removed from the study for that reason. Thus, the evaluation of animal ability to adapt to the SF design, from alarm notification system, was performed since the adaptation strategies finished for each treatment (after day 4 and after day 15 for CA and AA, respectively).
Feed consumption and performance
Calves received a commercial concentrate (Table 1) formulated according to the National Research Council recommendations [9], and wheat straw (35 CP, 16 EE, 709 NDF, and 61 ash; g/kg of DM basis), both ad libitum. During the arrival period (14 day) all animals were fed a starter concentrate, while the rest of growing period (28 day) they were fed a grower concentrate. Fresh water was available at all times. A sample from each concentrate was taken for DM determination and chemical analysis. The computerized feeder recorded the daily individual concentrate consumption throughout the study (38 days), excepting for the arrival period (14 days) during which the daily intake was collected per pen. Since, different adaptation strategies (chute widened or not place for first 4 days, and additional feeder during the initial 14 days of the study) did not allow the correct intake data recording by computerized feeder. The amount of straw offered to each pen was recorded weekly. Animals were weighed weekly throughout study at the same weekday and time of day, and BW data were used to calculate ADG and feed efficiency. To assess the variability of growth among calves sharing the same pen, the within-pen coefficient of variation (CV) of BW and ADG were calculated weekly. Lastly, gain to concentrate ratio (concentrate efficiency) weekly was estimated dividing the BW increase by the average of daily concentrate consumption throughout this 7-days period.
| Concentrate |
Starter |
Grower |
| Item |
| Ingredients, g/kg of Dry Matter (DM) |
| Corn |
360 |
361 |
| Barley |
189 |
|
| Soybean meal 47% Crude Protein (CP) |
118 |
27 |
| Corn dried brewer’s grains |
100 |
|
| Wheat middlings |
80 |
227 |
| Corn gluten feed |
80 |
|
| Corn grit |
|
200 |
| Corn dried distillers grains |
|
120 |
| Soybean hulls |
|
30 |
| Palm oil |
20 |
12 |
| Calcium carbonate |
18 |
14 |
| Urea |
|
4 |
| White salt |
3 |
3 |
| Magnesium oxide |
2 |
|
| Vitamin-mineral premix1,2 |
30 |
2 |
| Nutrient composition, g/kg of Dry Matter (DM) |
| Ash |
70 |
54 |
| Crude Protein (CP) |
172 |
160 |
| Ether Extract (EE) |
59 |
75 |
| Neutral Detergent Fiber (NDF) |
171 |
239 |
| Nonfiber carbohydrates (NFC)3 |
528 |
472 |
| Metabolizable energy (ME), Mcal/kg |
3.1 |
3.2 |
1Karimix TernerosArranque (LaboratoriosKarizoo S.A., Caldes de Montbui, Spain): vitamin and mineral premix containing, per kg of DM: 15,000 mg of vitamin A, 3,000 mg of vitamin D3, 70 mg of vitamin E. 60 mg of Zn, 50 mg of Mn, 50 mg of Fe, 15 mg of Cu, 0.7 mg of Co, 0.4 mg of I, 0.2 mg of Se. 890 mg of sepiolite, 8.5 mg of butylhydroxytoluene, 5 mg of etoxiquine, 0.8 mg of butylhydroxyanisole, 1.5 × 10⁹ UFC of Saccharomyces cerevisiaeCNCM I-1077.
2Sinuvit Terneros Final (Sinual S.L., Sallent, Spain): vitamin and mineral premix containing, per kg of DM: 4,500 kIU of vitamin A, 1,000 kIU of vitamin D3, 22.5 g of vitamin E, 0.5 g of vitamin B1, 1 g of vitamin B2, 5 mg of vitamin B12, 2.5 g of vitamin B3. 15 g of Mn, 3 g of Cu, 30 g of Zn, 0.5 g of Co, 0.5 g of I, 0.1 g of Se, 1 g of butylatedhydroxytoluene, 1 kg of calcium carbonate as excipient.
3NFC=nonfiber carbohydrates calculated as 100 - (CP + ash + NDF + EE).
Table 1: Ingredients and nutrient composition of the experimental concentrates.
Animal behavior
General activities (standing, lying, eating concentrate and straw, drinking, and ruminating) and social behaviors (nonagonistic, agonistic, and sexual interactions) of the calves within the same pen were recorded from 08.30 to 11.00 hour by scan sampling on day 1, 3, 5, 7, and weekly throughout the study. Animal behavior was analyzed according to Rotger et al. [10], Robles et al. [11], Mach et al. [12], and Marti et al. [13]. Records correspond to total counts of each activity in a pen [14], and the scan sampling method describes a behavior exhibited by an animal at a fixed time interval [15]. Two pens were observed at the same time, and whereas social behavior (Table 2) was scored during 2 continuous sampling periods of 15 minutes, general activities (Table 3) were scored using 2 scan samplings of 10 seconds at 5 minutes intervals [12]. This recording procedure (15 minutes) was repeated twice during the study of animal behavior.
| Item |
Definition |
| Nonagonistic interactions |
| Self-grooming |
Defined as nonstereotypied licking of its own body or scratching with a hind limb or against the fixtures |
| Social behavior |
When a bull was licking or nosing a neighboring bull with the muzzle or horning |
| Oral behavior |
The act of licking or biting the fixtures |
| Agonistic interactions |
| Fighting |
When bulls pushed vigorously head against head |
| Butting |
When 1 bull pushed vigorously its head against any part of another bull’s body |
| Displacement |
When 1 bull shoved itself between 2 other animals or between an animal and a wall or any equipment |
| Chasing |
When 1 bull made another animal flee by following fast or running behind it |
| Chasing-up |
When 1 bull used forceful physical contact against a resting animal that made the receiver rise |
| Sexual interactions |
| Flehmen |
Upper lip reversed |
| Attempted mounts |
Head on the back of another animal |
| Completed mounts |
Forelimbs on the back of another animal |
| Stereotypies |
| Oral stereotypies |
Tongue rolling, stereotyped licking, or biting on certain bars or sites in the stall |
Table 2: Description of the social behavioral categories recorded.
| Item |
Definition |
| Eating |
Eating (concentrate or straw) was defined as when the animal had its head into the feeder and was engaged in chewing. An observation was defined as eating when the bull was eating from the feed bunk with its muzzle in the feed bunk or chewing or swallowing feed with its head over the bunk |
| Drinking |
Drinking was recorded when the animal had its mouth in the water bowl. An observation was recorded as drinking when the bull was with its muzzle in the water bowl or swallowing the water |
| Ruminating |
Ruminating included the regurgitation, mastication, and swallowing of the bolus |
| Lying |
Lying was recorded as soon as the animal was not standing on its 4 legs, independently of any activity the animal might perform |
| Standing |
Standing was recorded when the animal was standing on its 4 legs, independently of any activity the animal might perform |
Table 3: Description of the general activities recorded.
Eating behavior
During the arrival period (14 day), the feeding area of each pen (including concentrate feeders, computerized and additional, straw feeder, and drinker) was filmed for 24 hours on day 1, 5, and 15 of study using digital cameras (Sony CSMBV420; Sony Corp., Barcelona, Spain) to analyze the eating pattern. Day 1 was the first whole day of the study after calves arrival; on day 5, the chute was narrowed (CA) or arranged (AA); and, on day 15, the supplementary amount of concentrate using an additional feeder in AA was ended. Videotapes were processed by continuous recording of the activities performed by animals. Recorded activities (eating concentrate or straw, drinking, waiting time to access the feeder or drinker, and displacements at feeder or drinker) were recorded simultaneously recording the time (min), the number of animals involved, and the frequency (the number by hour). Eating (concentrate or straw) was defined as when an animal had its head into the feeder, and an observation was defined as eating when the bull was eating from the feed bunk with its muzzle in the feed bunk or chewing with its head over the bunk. Drinking was recorded when an animal had its head in the water bowl, and an observation was recorded as drinking when the bull had its muzzle in the water bowl. Waiting time to access to feeder or drinker was recorded when an animal was close to the feeder or drinker and had the intention to access, but this place was occupied by another animal. Displacements among animals from feeders (concentrate or straw) and drinker were recorded when one animal displaced a pen mate that was eating or drinking, and forced the displaced animal to remove its head from feeding space. Only displacements with physical contact were considered. Only 4 hours of recordings (06.00 to 10.00 hour) were used to create a data set, as the eating behavior data, from a previous study [3], showed that during this time frame a first daily peak of eating activity was observed in cattle fed on collective feeders with continuously feed available. During the arrival period, the eating behavior recorded at additional and computerized feeders was considered together for the behavioral data analysis. For the growing period (28 days), the eating behavior was monitored by concentrate computerized feeder recording individual data from animals (the number of visits per animal, the length of each visit, the amount of concentrate consumed per visit and per animal, and the total daily eating time and concentrate consumption per animal).
Chemical analyses
Feed samples were analyzed for DM (24 hours at 103°C), ash (4 hours at 550°C), CP by the Kjeldahl method based on method 981.10 [16], NDF according to Van Soest et al. [17] using sodium sulfite and α-amylase, and EE by Soxhlet with a previous acid hydrolysis based on method 920.39 [16].
Calculations and statistical analyses
Firstly, a power analysis was conducted to check if 6 replicates per treatment would be sufficient to detect differences in concentrate consumption (3.0 vs. 3.8 ± 0.25 kg/d) and ADG (1.3 vs. 1.6 ± 0.12 kg/d) for SF vs. multiple-space feeder, respectively, reported in Verdú et al. [3]. The power analyses was conducted for these outcome variables using the standard deviation of this parameter between pens observed in a previous study [3], an alpha of 0.05, and a power of 0.80. The power analysis indicated at least that 3 (intake) and 4 (ADG) replicates (pens) per treatment were necessary to detect expected differences between treatments in a 27 and 23% for intake and ADG, respectively.
The pen was considered the experimental unit for all statistical analysis (n=6), and animals were included in the analysis as the sampling unit when individual measurements were possible [3]. Pen data of daily concentrate consumption, eating behavior, and performance were averaged by week and batch. Individual animal data of daily concentrate consumption, eating behavior, and performance were averaged by pen, week, and batch.
The frequency of each social behavior was obtained by summing by day, pen, and scan; while, the percentage of each general activity was averaged by day, pen, and scan. An arcsine plus 1 transformation to achieve a normal distribution was applied to behavioral data. The occupancy time of each feeder (concentrate and straw) and drinker (minutes), and the total waiting time to access each feeder and drinker (minutes) were calculated as the sum of the total time performing these activities per pen, day, and batch. The number of bulls eating and drinking, and the number of visits recorded at each feeder and drinker were averaged by pen, day, and batch. Number of displacements recorded at each feeder and drinker were summed by pen, day, and batch, and divided by total time and expressed as frequency of displacements per hour. Feeder and drinker occupancy, and waiting time data were also expressed as the percentage of time devoted to perform these activities from the total 4-hours of video recording analyzed (occupancy and waiting time rate). The occupancy and waiting time rates were root-squared to achieve a normal distribution. The means presented in the tables correspond to non-transformed data, and standard error of the mean (SEM) and p-values to the transformed data. To estimate eating pattern, meal criteria for each animal and period were calculated. The meal criterion (maximum amount of time between visits at the feeder to consider a visit as a part of the same meal) was calculated using a model composed of 2 or 3 normal distributions resulting from the natural logarithm of time (in seconds) between feeder visits as described by Bach et al. [18]. Then, visits at the computerized feeders were separated into meals, and meal frequency, meal duration and size, inter-meal duration, and eating rate were calculated.
Consumption, performance, and eating and animal behavior data were analyzed using a mixed-effects model with repeated measures (Version 9.2, SAS Inst., Inc., Cary, NC). The model included initial BW as a covariate, treatment, period (weekly for performance and consumption pen data; daily or weekly for eating and animal behavior), and their interaction, as fixed effects, and pen and batch as random effects. Period was considered a repeated factor, and pen nested within treatment was subjected to 3 variance-covariance structures: compound symmetry, autoregressive order 1, and unstructured. The covariance structure that yielded the smallest Schwarz’s Bayesian information criterion was considered the most desirable analysis. Initial and final BW, and age data were analyzed using a mixed-effects model (Version 9.2, SAS Inst., Inc., Cary, NC) including treatment as a fixed effect, and pen and batch as a random effects. Alarm notifications, which were used as animal adaptation records, were analyzed using a GLIMMIX procedure (Version 9.2, SAS Inst., Inc., Cary, NC) including treatment as a fixed effect, and pen and batch as a random effects. Herein, the Poisson with repeated measures was used for analysis the count adaptation data. Significance was established at p<0.05, and trends discussed as p ≤ 0.10.
Results and Discussion
Animal health records
One calf from AA treatment at day 1 died as a consequence of pneumonia. Veterinary treatments recorded throughout 6 weeks of study did not differ (p=0.63) between adaptation strategies (12.1 and 8.5 ± 4.91% treated calves for CA and AA, respectively; data not shown).
Animal adaptation records
Two calves were removed from the study because of their inability to adapt to the SF design, one on each treatment. No differences between treatments were observed in number of animals assisted to access the feeder (p>0.24; 5.5 vs. 1.9 ± 1.29% for CA and AA) and number of assistances recorded (p=0.11; 6 vs. 13 ± 1.1 assistances for CA and AA).
Thus, most of calves learned to access the feeder and ate at their own without difficulties. The incidence of adaptation problems in terms of number of calves that received assistance, together with the number of assistances, was very low for both treatments during the arrival period. Nevertheless, AA strategy minimized numerically these problems of adaptation reducing by a half the frequency of animals assisted.
Feed consumption and performance
A week by treatment interaction was observed (p<0.01) on concentrate consumption (Table 4). During the first week of the arrival period, calves reared with AA recorded a greater concentrate intake than calves on CA (3.5 vs. 2.8 ± 0.12 kg/d; Figure 2). However, for the remaining study no differences (p>0.10) between treatments in concentrate intake were observed, which increased from 3.3 at week 2 to 4.2 ± 0.12 kg/d at week 6. Furthermore, the adaptation strategy to SF design had an effect (p<0.05) on final BW after 42 d of the study, resulting in a greater final BW in AA group than in CA (178.8 vs. 174.9 ± 3.37 kg, respectively). Nevertheless, ADG (1.36 ± 0.040 kg/d), feed efficiency (0.37 ± 0.011 kg/kg), accumulative concentrate consumption (144.8 ± 1.78 kg after 42 days), and straw consumption (0.4 ± 0.03 kg/d) were not influenced (p>0.10) by the adaptation strategy used. The straw intake was only used as a guiding data, as the straw was also used for bedding.
| Item |
Treatment1 |
SEM |
p-value2 |
| CA |
AA |
T |
D |
T × D |
| Initial age, d |
101.9 |
102.2 |
2.72 |
0.77 |
|
|
| Initial BW, kg |
120.2 |
120.3 |
3.81 |
0.88 |
|
|
| Final BW, kg |
174.9b |
178.8a |
3.37 |
0.04 |
|
|
| CV BW within-pen, % |
12.2 |
12.6 |
1.14 |
0.72 |
0.5 |
0.22 |
| Concentrate DM consumption |
| Mean, kg/d |
3.6 |
3.7 |
0.06 |
0.34 |
<0.01 |
0.01 |
| CV, % |
8.5 |
8.1 |
1.1 |
0.79 |
0.1 |
0.18 |
Accumulative concentrate DM
consumption after 42-d, kg |
143.2 |
146.4 |
1.78 |
0.21 |
|
|
| Straw DM consumption, kg/d |
0.4 |
0.41 |
0.032 |
0.69 |
0.49 |
1 |
| ADG, kg/d |
1.31 |
1.4 |
0.04 |
0.12 |
<0.01 |
0.7 |
| CV of ADG within-pen, % |
38.2a |
32.2b |
2.14 |
0.05 |
0.85 |
0.57 |
| Gain to concentrate ratio, kg/kg |
0.37 |
0.38 |
0.011 |
0.46 |
<0.01 |
0.12 |
a-cMeans within a row with different superscripts are differ (p<0.05).
1Treatments were different strategy of adaptation to a single-space feeder with lateral protections: CA=a conventional strategy (in which lateral protections were widened for the first 4 days of the study); AA=an alternative strategy (in which no lateral protections for first 4 days were placed and additional feeder was also used during the first 14 days of the study).
2Fixed effects were treatment (T), day (D), and interaction between treatment and day (T × D).
Table 4: Performance and concentrate consumption of Holstein bulls fed a high-concentrate diet with single-space feeder using two different adaptation strategies (CA and AA) for 42-days of study.
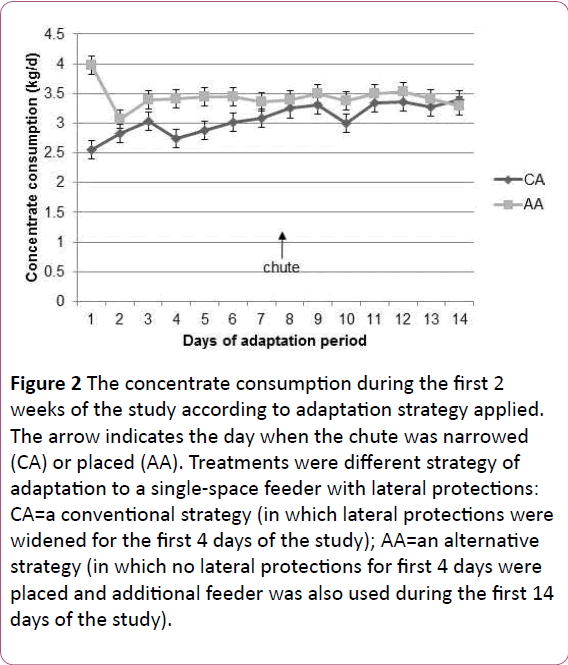
Figure 2: The concentrate consumption during the first 2 weeks of the study according to adaptation strategy applied. The arrow indicates the day when the chute was narrowed (CA) or placed (AA). Treatments were different strategy of adaptation to a single-space feeder with lateral protections: CA=a conventional strategy (in which lateral protections were widened for the first 4 days of the study); AA=an alternative strategy (in which no lateral protections for first 4 days were placed and additional feeder was also used during the first 14 days of the study).
These results indicate, as expected, that the greatest impact of the adaptation strategy was the increase of concentrate intake for first week after arrival (short-term effect; Figure 2). The narrowing of chute at day 4 interrupted the increasing trend of concentrate intake recorded by CA calves for first 3 days of arrival period, which recorded again less intakes as initially recorded (Figure 2). Consequently, calves under CA strategy needed one additional week to reach similar concentrate intakes than animals on AA. Thus, the chute management is particularly critical during the first week of adaptation to ensure expected concentrate consumptions, as well as the presence of an additional feeder increasing feeding spaces to stimulate concentrate consumption. To our knowledge, there are no studies contrasting adaptation strategies to a single-space concentrate feeder in cattle. However, many other strategies are available to foster intakes in calves after feedlot arrival [19], because newly received calves have low feed intakes [20] and that may compromise the expected growth rate. In addition, the feed intake data from the current study denote that the first week after fattening arrival was the most crucial time for adaptation to SF design.
For all these reasons, this study suggests that the effects combination of adaptation arrangements (chute not placed and additional feeder) allowed reaching the initial purpose of adaptation strategy (to ease the feed access and encourage the concentrate consumption) during the first week after arrival. Another previous study [6] also reported that the increase of feeding spaces during an arrival period is an effective strategy to increase concentrate consumption.
Moreover, whereas calves on the AA strategy maintained consumptions around 3.4 kg/d, animals on CA exhibited more variable intake between days, especially for the first week of arrival period. The CV of daily concentrate consumption for first 2 weeks of arrival period was greater (p<0.01) in calves on the CA strategy (11.3 ± 1.11%) in contrast to those on the AA (7.6 ± 1.11%; data not shown). These results are in agreement with a previous cited study [3] in which a great day-by-day variation in feed intake was observed during the arrival period. The increased final BW at day 42 recorded by AA group suggests a midterm effect of strategy of adaptation on animal growth. Also, as occurred with concentrate intake variability, the adaption strategy had an effect on growth pattern. Then, based on withinpen CV in ADG within-pen, animals on CA tended (p=0.05) to show more growth variability (38.2 ± 2.14%) in contrast to AA animals (32.2 ± 2.14%). This result is in accordance to González et al. [6], who reported less variability in ADG as number of feeding places per pen increased.
Animal behavior
General Activities: Most of the general activities were not affected by strategy of adaptation (Table 5), in contrast with results from Verdú et al. [3].
| Item |
Treatment1 |
SEM3 |
p-value2 |
| CA |
AA |
T |
D |
T × D |
| Standing |
66.3 |
64.9 |
0.72 |
0.57 |
<0.01 |
0.84 |
| Lying |
33.7 |
35.1 |
1.08 |
0.96 |
<0.01 |
0.56 |
| Eating concentrate |
5.7b |
6.1a |
0.09 |
0.02 |
<0.01 |
<0.01 |
| Eating straw |
11.3 |
10.5 |
0.38 |
0.45 |
<0.01 |
0.79 |
| Drinking |
1.6 |
1.9 |
0.17 |
0.64 |
0.39 |
0.72 |
| Ruminating |
14.5 |
15 |
0.77 |
0.53 |
<0.01 |
0.32 |
a-cMeans within a row with different superscripts are differ (p<0.05).
1Treatments were different strategy of adaptation to a single-space feeder with lateral protections: CA=a conventional strategy (in which lateral protections were widened for the first 4 days of the study); AA=an alternative strategy (in which no lateral protections for first 4 days were placed and additional feeder was also used during the first 14 days of the study).
2Fixed effects were treatment (T), day (D), and interaction between treatment and day (T × D).
3Behavioral data were analyzed as arcsine plus 1 transformation; the means presented herein correspond to non-transformed data, and SEM and p-values to the transformed data.
Table 5: Percentages of general activities (%) of Holstein bulls fed a high-concentrate diet with single-space feeder using two different adaptation strategies (CA and AA) for 42-days of study.
However, as expected, during the first week of arrival period, a greater (p ≤ 0.01) percentage of animals per pen eating concentrate and drinking were recorded in AA strategy (8.9 ± 0.10% and 2.6 ± 0.26%) compared with CA strategy (6.2 ± 0.10% and 1.3 ± 0.26%). In the second week of the arrival period, the reduced amount of concentrate supplied by additional feeder could explain the lack of differences between treatments. Thus, general activities from behavioral data indicate that the first week of the study is the most important and crucial time to adapt the animals to the feeder design.
The greater percentage of animals drinking in the AA strategy could be related to the greater concentrate intake recorded at first week compared with CA, since the ingestion of concentrate and water are strongly correlated [21]. Animals synchronize the feeding and drinking behaviors, altering the feed and water consumption [22,23].
Social behavior: No effects were observed on social behaviors due to the adaptation strategy (Table 6). However, calves under the AA strategy experienced a greater (p<0.01) frequency of displacements (2.6 ± 0.31 times/15 minutes) compared with CA (1.3 ± 0.31 times/15 minutes) for first week of arrival period.
This great incidence of displacements was probably consequence of the absence of a chute for first 4 days, and the increased feeding concentrate places promoted the competition to feed access. These results are similar to those found by González et al. [6], which observed an increase of the number of displacements when increasing the number of feeding spaces from 1 to 2 in pens with 8 calves. For the rest of the study, no displacements were observed between treatments, fact that confirmed the effectiveness of lateral protections of the chute to avoid the displacements around the feeder. Moreover, no stereotypies were observed throughout the experiment.
Eating behavior
There was an interaction between adaptation strategy and filming day for occupancy time (p<0.01), number of bulls (p<0.01), number of visits (p<0.01), displacements (p<0.01), and waiting time to feeder access (p<0.05) throughout the 2 weeks of the arrival period (Table 7). Contrarily, no differences (p>0.10) between strategies of adaptation were found in eating and drinking behaviors at straw feeder and drinker during this period. Besides, for the remaining 4 weeks of the study (growing period), the adaptation strategy did not affect (p>0.10) eating pattern at concentrate feeder (6.4 ± 0.30 number of daily visits, 9.7 ± 0.74 minutes of meal duration, 649.9 ± 28.15 g of DM basis of meal size, 55.5 ± 3.57 minutes of total daily meal duration, 80.0 ± 9.83 g of DM basis/minutes of eating rate, 240.8 min of inter-meal duration, and 1,319.5 ± 7.61 minutes of total daily inter-meal duration). Then, no mid-term effect of adaptation strategy on eating behavior at the concentrate feeder was observed.
At day 1 and 5 of arrival period, a greater (p<0.01) occupancy time of concentrate feeder was recorded in AA feeders (296.8 and 300.7 ± 10.26 minutes, respectively) than CA feeders (200.4 and 215.4 ± 10.26 minutes, respectively). González et al. [6] reported similar results in calves, where the time devoted eating concentrate increased as number of feeding places per pen increased. At day 15 of the arrival period, no differences (p>0.10) between treatments in time attending the feeder (203.4 ± 10.26 minutes) were observed, as both treatments had a single-space feeder. Thus, an additional feeding place without
chute increases the time spent at the concentrate feeder by 37% (90 minutes) during the arrival period (day 1 and 5). Moreover, the occupancy time rate for SF design recorded in the current study (89 ± 1.0% of total time analyzed) was similar to obtained in Verdú et al. [3] (90.6 ± 1.0% of total time analyzed), where the same SF design was used with similar experimental conditions in terms of number of calves per pen and initial BW.
However, when expressing the occupancy time of concentrate feeder per available feeding spaces, at day 1 and 5 of arrival period (data not shown), the AA feeders had a lesser (p<0.01) occupancy time (147.8 and 149.7 ± 1.50 minutes, respectively) compared with CA feeders (200.9 and 215.9 ± 1.50 minutes, respectively). Unexpectedly, the occupancy time decreased around 30% (60 minutes) when the number of feeding places per pen increased by the provision of an additional feeder. Then, the occupancy time when it is expressed by feeding space decreased in AA strategy indicating that more competition around feeder may have happened, even though it took into account 2 available feeding spaces. This hypothesis is supported by the increased displacements at the concentrate feeder in AA treatment and by the fact that only a total of 60 minutes of occupancy time was recorded by additional feeder. This great level of competition at the concentrate feeder in the AA strategy could be considered a positive effect to encourage the feed consumption, such as it was corroborated by intake and growth results described previously. Moreover, an increase of feed consumption when the level of competition for feed increased has been also reported by others in dairy cows [24,25,26]. However, this great level of competition around concentrate feeder only remained for the first week of the arrival period, fact that might related to establishment of a hierarchy or order to feeder attendance. Lastly, when only one feeding place was available after 2 weeks of adaptation, the feeder occupancy time was the same between treatments (around 200 minutes), independent of previous adaptation strategy. From previous eating pattern data, an occupancy time around 80% of total daily time could be used as a reference in pens of 18 animals, with 120 kg BW, and for SF design.
On day 1 and 5 of arrival period, a greater number of animals was recorded (p<0.01) at AA feeders (2.4 and 2.2 ± 0.36 animals, respectively) than CA feeders (1.3 and 1.1 ± 0.36 animals, respectively). In contrast, no differences (p>0.10) between treatments were observed in number of animals at the feeder (1.0 ± 0.36 animals) at day 15 of the arrival period. This data indicate that calves show preference to occupy all of available feeding spaces at arrival, which is in agreement with results observed by Verdú et al. [3]. Thus, during growing phase, and especially for an arrival period, an increase of the ratio animal:feeder space (from 20 to 1 to 10 to 1) seems an effective strategy to stimulate feed intake because of the eating behavior.
Although both treatments recorded (p<0.01) a reduction in number of visits at the feeder at the beginning (from day 1 to 5), this decline varied depending on adaptation strategy. Whereas on day 1 and 5, the number of visits was greater (p<0.01) for AA strategy (114.7 and 53.1 ± 7.28 visits, respectively) than CA strategy (39.7 and 9.5 ± 7.28 visits, respectively), at the end of arrival period (day 15) no differences were observed between treatments (9.9 ± 7.28 visits). Then, the great frequency of feeder visits exhibited in AA strategy indicates that their arrangements promoted an increased activity around the feeder. Therefore, an additional feeding space stimulates the feeder visits and feed intake by social facilitation [27], which may facilitate the adaptation to SF design. Also, this increase in the number of visits has been associated with a high level of competition in two studies [25,26]. Obviously, in both strategies, the number of visits decreased (p<0.01) the day after chute was narrowed or placed, for CA and AA, respectively.
Lastly, in both treatments, the waiting time increased (p<0.01) from day 1 to 5 (55% for CA and 65% for AA) when chute was ready, showing the effectiveness of lateral protections from SF to force animals accessing one by one and eating individually. However, at day 5 of arrival period, CA strategy recorded greater (p<0.05) waiting time to access the concentrate feeder than AA strategy (89.3 and 61.4 ± 9.03 minutes, respectively). The AA strategy reduced to 30% the waiting time compared with CA strategy. Also, the CA strategy was able to reduce (p<0.01) the waiting time from day 5 to 15 in contrast to AA strategy, indicating a better ability to adapt to SF design because of calves were more familiarized.
The eating and drinking behavioral data at the straw feeder and drinker were not affected by strategy of adaptation to SF design over the arrival period of the study (Table 7). The straw feeder results are in disagreement with those reported by González et al. [6], which observed an increase of time spent eating straw when the feeding space: animal ratio decreased. Moreover, although González et al. [6] found a greatest frequency of displacements at the drinker when increasing the feeder places from 1 to 2, the drinking pattern in the current study was not influenced by feeding spaces.
In summary, the AA strategy had a positive effect on concentrate intake for first week after arrival (short-term effect), and on BW after 6 weeks (mid-term effect). Moreover, AA resulted in a greater attendance (reducing the waiting time to access the feeder) and more competition (increasing the frequency of displacements) at the concentrate feeder during the first week of adaptation. In conclusion, the adaptation strategy (chute not placed and additional feeder provided) proposed herein eased access to feed and encouraged concentrate consumption during the first week of arrival period, improving concentrate intake at short-term (first week) and BW at mid-term (sixth week) after arrival fattening farm, respectively. However, further research should be conducted to evaluate long-term effects of the AA strategy on concentrate intake and performance during an entire fattening period.
The utilization of a single-space concentrate feeder with a chute (lateral protections) to feed beef cattle could compromise its concentrate consumption and performance during the first weeks after arrival at fattening farm. The current study evaluated an adaptation strategy consisting of placing the singlespace feeder without chute the first 4 days and using an additional feeder for first 14 days after arrival. This strategy had positive implications on performance at arrival to fattening farm, which encouraged the concentrate intake during the first week and achieved an increase of the BW 6 weeks after fattening arrival.
Acknowledgements
This research was made possible by the collaboration of Agropecuaria Montgai S.L., Voltec Electro Sistemes S.L., BMM, and the support from Andrea Moro, Bruna Quintana and Anna Solé.
References
- Devant M, Marti S, Bach A (2012) Effects of castration on eating pattern and physical activity of Holstein bulls fed high-concentrate rations under commercial conditions. J AnimSci 90: 4505-4513.
- Marti S, Realini CE, Bach A, Pérez-Juan M, Devant M (2013) Effect of castration and slaughter age on performance, carcass, and meat quality traits of Holstein calves fed a high-concentrate diet. J AnimSci 91: 1129-1140.
- Verdú M, Bach A, Devant M (2015) Effect of concentrate feeder design on performance, eating and animal behavior, welfare, ruminal health, and carcass quality in Holstein bulls fed high-concentrate diets. J AnimSci 93: 1-16.
- Gonyou HW, Stricklin WR (1981) Eating behavior of beef cattle groups fed from a single stall or trough. ApplAnimEthol 7: 123-133.
- Kunkle WE, Fetter AW, Preston RL (1976) Effect of initial diet on cattle performance and subsequent adaptation to high concentrate diets. J AnimSci 42: 1263-1271.
- González LA, Ferret A, Manteca X, Ruíz-de-la-Torre JL, Calsamiglia S, et al. (2008) Effect of the number of concentrate feeding places per pen on performance, behavior, and welfare indicators of Friesian calves during the first month after arrival at the feedlot. J AnimSci 86: 419-431.
- Bach A, Iglesias C, Busto I (2004) Technical note: A computerized system for monitoring feeding behavior and individual feed intake of dairy cattle. J Dairy Sci 87: 4207-4209.
- DeVries TJ, von Keyserlingk MAG, Weary DM, Beauchemin KA (2003) Measuring the feeding behavior of lactating dairy cows in early to peak lactation. J Dairy Sci 86: 3354-3361.
- National Research Council (1996) In: Nutrients Requirements of Beef Cattle (7th edn), National Academy of Sciences, Washington DC, USA.
- Rotger A, Ferret A, Manteca X, Ruíz-de-la-Torre JL, Calsamiglia S (2006) Effects of dietary nonstructural carbohydrates and protein sources on feeding behavior of tethered heifers fed high-concentrate diets. J AnimSci 84: 1197-1204.
- Robles V, González LA, Ferret A, Manteca X, Calsamiglia S (2007) Effects of feeding frequency on intake, ruminal fermentation, and feeding behavior in heifers fed high-concentrate diets. J AnimSci 85: 2538-2547.
- Mach N, Bach A, Velarde A, Devant M (2008) Association between animal, transportation, slaughterhouse practices, and meat pH in beef. Meat Sci 78: 232-238.
- Marti S, Velarde A, Ruíz-de-la-Torre JL, Bach A, Aris A, et al. (2010) Effects of ring castration with local anesthesia and analgesia in Holstein bulls at three months of age on welfare indicators. J AnimSci 88: 2789-2796.
- Mounier L, Veissier I, Boissy A (2005) Behavior, physiology, and performance of bulls mixed at the onset of finishing to form uniform body weight groups. J AnimSci 83: 1696-1704.
- Colgan PW (1978) Quantitative ethology. Wiley and Sons, New York, USA.
- Association of Official Analytical Chemist (1995) Official methods of analysis (16th edition), Association of Official Analytical Chemist, Arlington, Virginia, USA.
- Van Soest, PJ, Robertson JB, Lewis BA (1991) Methods for dietary fiber, neutral detergent fiber, and nonstarch polysaccharides in relation to animal nutrition. J Dairy Sci 74: 3583-3597.
- Bach A, Iglesias C, Devant M, Ràfols N (2006) Performance and feeding behavior of primiparous cows loose housed alone or together with multiparous cows. J Dairy Sci 89: 337-342.
- Loerch SC, Fluharty FL (1999) Physiological changes and digestive capabilities of newly received feedlot cattle. J AnimSci 77: 1113-1119.
- Hutcheson DP, Cole NA (1986) Management of transit-stress syndrome in cattle: Nutritional and environmental effects. J AnimSci 62: 555-560.
- Rodríguez-Prado M, Ferret A, Zwieten J, González LA, Bravo D, et al. (2012) Effects of dietary addition of capsicum extract on intake, water consumption, and rumen fermentation of fattening heifers fed a high-concentrate diet. J AnimSci 90: 1879-1884.
- Nocek JE, Braund DG (1985) Effect of feeding frequency on diurnal dry matter and water consumption, liquid dilution rate, and milk yield in first lactation. J Dairy Sci 68: 2238-2247.
- González LA, Correa LB, Ferret A, Manteca X, Ruíz-de-la-Torre JL, et al. (2009) Intake, water consumption, ruminal fermentation, and stress response of beef heifers fed after different lengths of delays in the daily feed delivery time. J AnimSci 87: 2709-2718.
- Friend TH, Polan CE, McGilliard ML (1977) Free stall and feed bunk requirements relative to behavior, production and individual feed intake in dairy cows. J Dairy Sci 60: 108-116.
- Elizalde HF (1993) Studies on the effects of chemical and physical characteristics of grass silage and degree of competition per feeding space on the feeding behaviour of lactating dairy cows. Queens University Belfast, Belfast, UK.
- Olofsson J (1999) Competition for total mixed diets fed for ad libitum intake using one or four cows per feeding station. J Dairy Sci 82: 69-79.
- Curtis SE, Houpt KA (1983) Animal ethology: its emergence in animal science. J AnimSci 57: 234-247.