Keywords
Leukemia; Age; Gender; Correlation; Trace elements
Introduction
Trace elements play important roles in human health by regularizing the immune system, membrane potential, nerve contraction and mitochondrial activity etc. [1]. Recently, a number of studies have focused on the relationship of various metal levels in blood with biological disorders such as lung cancer, breast cancer, gastrointestinal cancer, heart diseases, neurodegenerative disorders, thyroid dysfunction, sclerosis, schizophrenia, parkinsons disease and diabetes [2-11]. The biological effects of trace elements may be explained on the basis of their ability to catalyze the initiation of free radical reactions as pro-oxidants or anti-oxidants or the decomposition of peroxides and other unstable molecules. It is worth noting that numerous biological processes and pathological states involve these free radical reactions [12]. Thus¸ it is imperative to study the distribution and role of various metals under conditions of different diseases. An overview of roles of selected metals in human body is presented in forth coming paragraphs.
Zinc is an essential element, involved in numerous cellular metabolisms [13]. It catalyzes the activity of more than 200 enzymes [14, 15]. As an essential part of carbonic anhydrase and carboxypeptidase enzymes, it regulates CO2 and protein digestion respectively [16, 17]. It is involved in wound healing [15], DNA synthesis and cell division [18], protein synthesis and immune function [15, 18]. In a study lower Zn levels were reported in leukemia lymphocytes as compared to normal lymphocytes. It was also found that under Zn deficiency conditions , the recovery from leukemia was slow [19]. At higher levels, it may cause low Cu status, altered Fe function and reduced immune function [20].
Iron is an integral part of different classes of proteins such as Fe-heme proteins; Fe–sulfur enzymes; Fe storage and transport proteins and Fe-activated enzymes (e.g. succinate dehydrogenase, NADH dehydrogenase, alcohol cyclooxygenases, dehydrogenase) etc. In all these forms, it performs vital body functions but Fe overload may cause acute Fe poisoning. Repeated blood transfusions or excessive Fe intake may also cause chronic poisoning [12].
Cu is essential for maintaining the strength of skin, epithelial and connective tissues and blood vessels throughout the body. It maintains the normal functioning of thyroid glands and plays an important role in the production of hemoglobin, myelin, melanin. About 90% of Cu in blood is incorporated into ceryloplasmin that transport Cu to the tissues [21, 22]. As an antioxidant Cu scavenges or neutralize the free radicals and may reduce some of the damage they cause [23-25]. As pro-oxidant it may promote the free radical damage and thus contribute towards Alzheimers disease [26, 27]. Cu acts as a reductant in the enzymes superoxide dismutase, cytochrome oxidase, lysil oxidase, dopamine hydroxylase, and several other oxidases that reduce molecular oxygen. Its deficiency may lead to normocytic, hypochromic anemia, leucopenia and neuropenia, and inclusive osteoporosis in children [28]. Excessive Cu may cause liver damage and gastrointestinal effects characterized by abdominal pain, cramps, nausea, diarrhea, and vomiting
Nickel is considered as an essential nutrient that is required in very small amounts, but has a number of cellular effects. It may activate or inhibit enzymes that usually contain other elements. It is also involved in the production and function of certain hormones such as adrenaline, noradrenaline, prolactin and aldosterone. Intracellularly, it can affect membrane properties, oxidation/reduction systems and ion channels [29]. Recent studies have shown that metals including Fe, Cu, Cr undergo redox cycling while Ni deplete glutathione and protein bound sulfhydral groups resulting in the production of reactive oxygen species as superoxide ion, hydrogen peroxide and hydroxyl radical. As a result enhanced lipid peroxidation, and DNA damage may occur [30, 31].
Magnesium is mostly found in bones, muscles and non-muscular soft tissue [32]. It is a cofactor of more than 300 enzymatic reactions [33, 34] and critically stabilizes enzymes, including many ATP-generating reactions [35]. An interference with magnesium metabolism may influence ATP dependant processes such as glucose utilization, synthesis of fat, proteins, nucleic acids and coenzymes, muscle contraction, methyl group transfer [36]. Magnesium may be considered a natural ‘calcium antagonist’ [37] as it antagonizes the calcium-dependent release of acetylcholine at motor endplates [38].
In view of the important roles played by selected metals in various biological processes, the present study was formulated to determine the levels of selected metals in blood samples of leukemia patients in comparison with healthy donors, and to trace the relationships among the measured metals in terms of correlation coefficient matrix and cluster analysis.
Materials and Methods
Sampling and pretreatment
The blood samples were collected from a total of 100 diagnosed patients of leukemia belonging to both genders and ages between 3 to 60 years. The informed written consent of the subjects was obtained prior to sample collection. The protocol of the study conforms to the ethical guidelines of the "World Medical Association Declaration of Helsinki - Ethical Principles for Medical Research Involving Human Subjects" adopted by the 18th WMA General Assembly, Helsinki, Finland, June 1964 and amended by the 59th WMA General Assembly, Seoul, South Korea, October 2008. Moreover, the protocol of study was approved by the Advanced Studies and Research Board of Lahore College for Women University, Lahore.
A 5.0-mL portion of blood was drawn from the antecubital vein of each patient in pyrogen-free disposable syringe by trained phlebotomists and the samples were transported to the laboratory for analysis where these blood samples were refrigerated and stored in contaminant-free evacuated tubes. Each sample was processed within 72 h for the analysis of Co, Cu, Pb, Cr, Fe, and Mg. An equal number of age and gender matched healthy individuals belonging to same demographic origin were selected and included in the study.
Analysis of trace elements in blood
Atomic absorption spectroscopy was used for the determination of trace elements in blood samples after following a wet acid digestion method. For this purpose the blood samples were heated first gently and then vigorously with equi-molar quantities of HNO3 and HClO4 to obtain a clear solution that was subsequently diluted to 50 mL. The blanks were prepared the same way as the samples but without blood. The solutions thus obtained for samples and blanks were used for direct aspiration onto flame atomic absorption spectrophotometer (FAAS). All the chemicals and reagents used during the analysis were of spectroscopic grade with a certified purity of 99.99% obtained from E-Merck, Germany.
The processing and preparation of samples was carried out all in pyrex glassware. Hitachi AA spectrophotometer Model AA-5000, equipped with Zeeman background correction facility, was used for the estimation of selected trace elements. Standard optimum analytical conditions were maintained and periodically checked on AAS system for each trace element as per manufacturer's instructions (Table 1). To establish the precision of the results, triplicate analysis of each sample was carried out. Moreover, the blanks were used to avoid the contamination arising from matrix. These blanks were run after every ten samples to ensure the accuracy. Inter-laboratory comparison of the obtained data was conducted at the University of Punjab, Lahore, Pakistan. The data of two laboratories did not differ more than 4%.
| |
Wavelength (nm) |
HC lamp current (mA) |
Slit Width (nm) |
Detection Limit (ug/L) |
Fuel-gas flow rate (L/min) |
| Cu |
324.8 |
4.0 |
0.50 |
3 |
2.0 |
| Ni |
232 |
4.0 |
0.20 |
10 |
2.0 |
| Fe |
248.3 |
5.0 |
0.20 |
6 |
2.0 |
| Mg |
285.2 |
9.0 |
1.3 |
10 |
2.2 |
| Zn |
213.9 |
5.0 |
1.0 |
1 |
2.0 |
| Cr |
357.9 |
7.0 |
0.20 |
6 |
2.9 |
Table 1: Optimum analytical conditions for selected trace element analysis using air–acetylene flame on atomic absorption spectrophotometer.
Statistical analyses
The data obtained for the levels of various trace elements in the blood samples of leukemia patients were processed for descriptive statistics. In order to trace the trace element-to-trace element correlations among various trace element pairs, the Pearson correlation coefficient matrix was evaluated. The data were also segregated on the basis of gender, and the individual groups were studied thoroughly. Cluster analysis of trace element data was carried out by using Statistica software. It provided information about the clustering behavior of studied trace elements and their dependence on each other.
Results and Discussion
The demographic data of the patients of leukemia and their age and gender matched healthy controls is depicted in Table 2. The leukemia patients belonged to an average age of 26.6 years, and 58.06% of these patients were males and the remainder was female. Among these patients 48.4% were inhabited in comparatively less polluted environment of rural areas while 51.6% were of urban origin. The controls were selected with the similar demographic characteristics. Urban areas appear to have high incidence of disease are compared to rural areas suggesting that pollution arising from various industries may be a risk factor.
| Characteristics |
Leukemia Patients |
Healthy donors |
| Age |
Mean |
26.6 |
26.3 |
| |
Range |
3-60 |
3-60 |
| |
Median |
23 |
23 |
| Gender |
Male |
36 (58.1 %) |
36 (58.1 %) |
| |
Female |
26 (41.9 %) |
26 (41.9 %) |
| Adobe |
Urban |
32 (51.6 %) |
34 (54.8 %) |
| |
Rural |
30 (48.4 %) |
28 (45.2 %) |
Table 2: Demographic data of subjects.
Distribution of trace elements
The distribution of trace elements in blood of leukemia patients and their age and gender matched controls is presented in Table 3 and a comparison of the trace element levels in two groups is furnished in Figure 1. The data exhibited large variation in minimum and maximum values for all the trace elements. Mg among the studied trace elements was found as the major contributor at mean levels while Cr was present at sub- ppm levels. The mean levels observed for Ni and Fe were found to be 5.312 and 5.785 μg/mL respectively. Except Zn, the mean levels of all the observed trace elements in leukemia patients were much higher than healthy controls. Zinc was observed at levels of 1.625 μg/mL. The order for mean levels of trace elements in blood of leukemia patients was found to be: Mg > Fe > Ni > Cu > Zn > Cr, in contrast to healthy controls, where the observed order was: Mg > Fe > Cu > Zn > Ni > Cr. A very significant difference in the mean level of Ni was observed in the two groups (p<0.05). Ni compounds are known to induce DNA protein cross linking, DNA strand breaking, and chromosomal aberrations in isolated human peripheral lymphocytes [39]. Thus abnormal levels of these trace elements observed in leukemia patients in present study may affect the progression of disease. Cr, another culprit for DNA damage by oxygen radical production was also found to be present at higher levels in the blood of leukemia patients than controls [40, 41]. Increased levels of iron in the blood of patients may also be associated with increased risk of cancer by inducing the mutations of cells [42, 43].
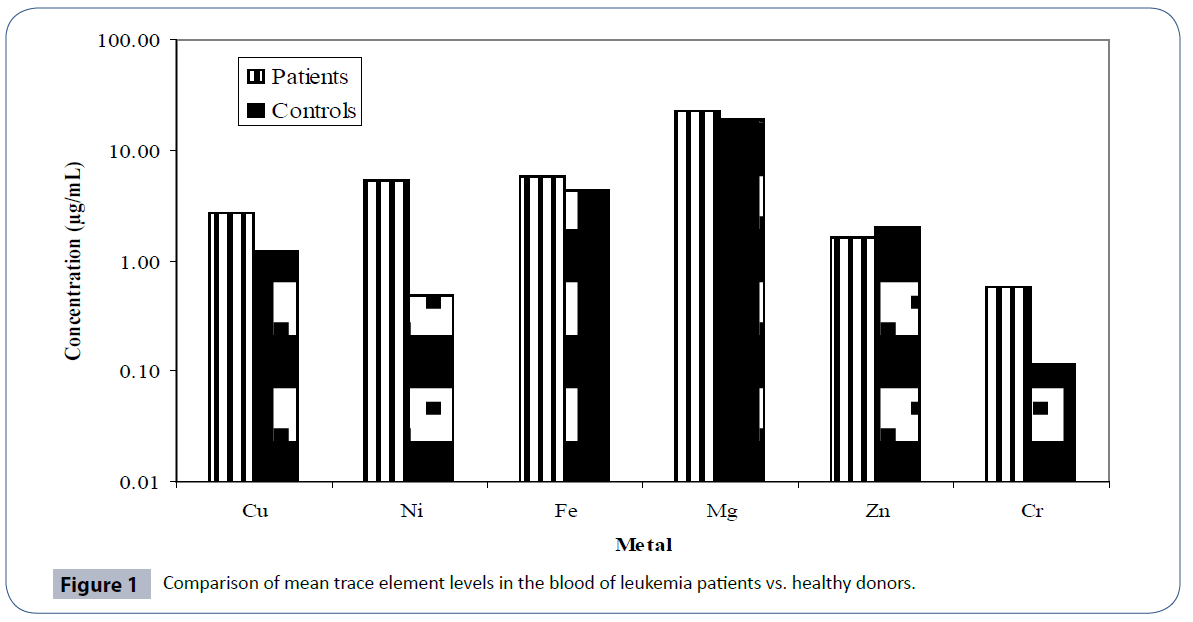
Figure 1 Comparison of mean trace element levels in the blood of leukemia patients vs. healthy donors.
| |
|
Cu |
Ni |
Fe |
Mg |
Zn |
Cr |
Age (year) |
| Leukemia Patients |
Min. |
0.000 |
0.230 |
0.166 |
0.200 |
0.190 |
0.100 |
3.000 |
| Max. |
13.40 |
28.00 |
38.70 |
75.90 |
3.68 |
3.500 |
60.0 |
| Mean |
2.696 |
5.312 |
5.785 |
22.79 |
1.625 |
0.581 |
26.6 |
| Median |
1.845 |
5.250 |
2.135 |
18.65 |
1.360 |
0.309 |
23.0 |
| S. D. |
2.586 |
3.754 |
8.336 |
19.05 |
4.023 |
0.546 |
14.8 |
| S. E. |
0.328 |
0.477 |
1.059 |
2.419 |
0.511 |
0.069 |
1.9 |
| Healthy Donors |
Min. |
0.889 |
0.419 |
3.424 |
6.560 |
1.805 |
0.084 |
3.000 |
| Max. |
1.507 |
0.586 |
6.357 |
27.42 |
2.366 |
0.146 |
60.00 |
| Mean |
1.198 |
0.487 |
4.374 |
19.27 |
2.005 |
0.115 |
26.32 |
| Median |
1.199 |
0.486 |
4.339 |
16.84 |
2.001 |
0.116 |
23.00 |
| S. D |
0.193 |
0.034 |
0.533 |
0.667 |
0.143 |
0.018 |
14.54 |
| S. E |
0.024 |
0.004 |
0.068 |
5.249 |
0.018 |
0.002 |
1.847 |
Table 3: Descriptive statistics for the distribution of trace element levels (μg/mL) in the blood of leukemia patients and healthy donors.
The quartile distribution of trace elements in the leukemia patients and healthy controls is depicted in Figure 2. The figure also supported the data provided in Table 3. The relationships among different trace element pairs in the blood samples of leukemia patients and controls are provided in Table 4 in terms of Pearson correlation coefficient matrix. The data for leukemia patients evidenced Ni-Mg pair to be significantly positively correlated with an r-value of 0.328. Magnesium was also found to be significantly negatively correlated with Cu. In case of healthy donors, Zn and Cr were the only trace elements that were found to be significantly correlated.
| |
|
Cu |
Ni |
Fe |
Mg |
Zn |
Cr |
Age (year) |
| Leukemia Patients |
Cu |
1.000 |
|
|
|
|
|
|
| Ni |
0.062 |
1.000 |
|
|
|
|
|
| Fe |
-0.080 |
0.053 |
1.000 |
|
|
|
|
| Mg |
-0.318 |
0.328 |
0.051 |
1.000 |
|
|
|
| Zn |
0.089 |
0.074 |
-0.217 |
0.031 |
1.000 |
|
|
| Cr |
0.032 |
-0.132 |
-0.220 |
-0.185 |
0.040 |
1.000 |
|
| Age (year) |
-0.207 |
0.168 |
0.021 |
0.202 |
0.043 |
-0.219 |
1.000 |
| Healthy donors |
Cu |
1.000 |
|
|
|
|
|
|
| Ni |
-0.097 |
1.000 |
|
|
|
|
|
| Fe |
0.004 |
0.104 |
1.000 |
|
|
|
|
| Mg |
0.098 |
-0.034 |
0.031 |
1.000 |
|
|
|
| Zn |
-0.010 |
0.186 |
0.201 |
0.038 |
1.000 |
|
|
| Cr |
0.099 |
0.049 |
-0.038 |
0.162 |
0.261 |
1.000 |
|
| Age (year) |
-0.133 |
0.211 |
-0.147 |
-0.045 |
0.094 |
-0.159 |
1.000 |
Table 4: Pearson correlation coefficient matrix for trace elements in the blood of leukemia patients and healthy donors (n=62).
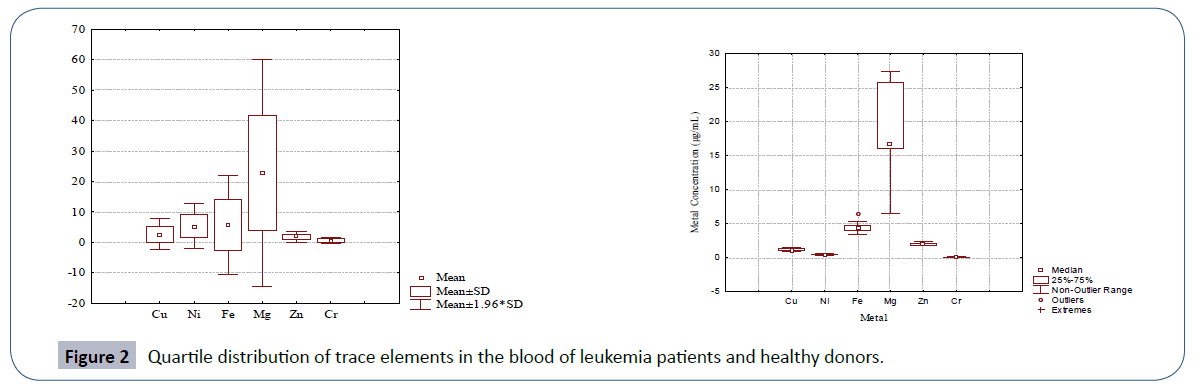
Figure 2 Quartile distribution of trace elements in the blood of leukemia patients and healthy donors.
The age of healthy donors was found to be significantly positively correlated with Ni depicting an increase in Ni levels with increasing age of patients. In fact, the Ni excretion by the body depends on the immunological body conditions. Ni itself suppresses the immunological status of body [44]. So under leukemia conditions the urinary excretion of Ni is decreased leading to an increased retention of Ni in the blood that causes more oxidative DNA damage. Ni has also been considered as an etiologic factor for childhood acute leukaemia by oxidative DNA damage [45]. In leukemia patients age was found to be significantly negatively correlated with Cr; these results are consistent with the results of Davies et al., who reported age related decrease in blood Cr levels in diabetic patients [46]. With the increasing age, no malabsorption of Cr was reported rather higher urinary excretions may be responsible for lower Cr levels in blood of patients [47].
The clustering behavior of the trace elements in blood of leukemia patients in comparison to healthy donors is depicted in Figure 3. In leukemia patients, the most significant cluster was formed by Cu, Zn and Cr within a linkage distance of 50. This primary cluster was associated with another primary cluster formed by Ni and Fe and hence a secondary cluster was formed. In these leukemia patients Mg stood alone depicting its independent behavior. Healthy donors were characterized by the most significant primary cluster to be formed by Ni and Cr that were associated with in a linkage distance of 5. Another primary cluster was formed by Cu and Zn which joined the previous cluster with in linkage distance of 20. No independent role of Mg was observed here as in case of patients. On overall basis, the clustering behavior of trace elements in leukemia patients was quite different than in controls.
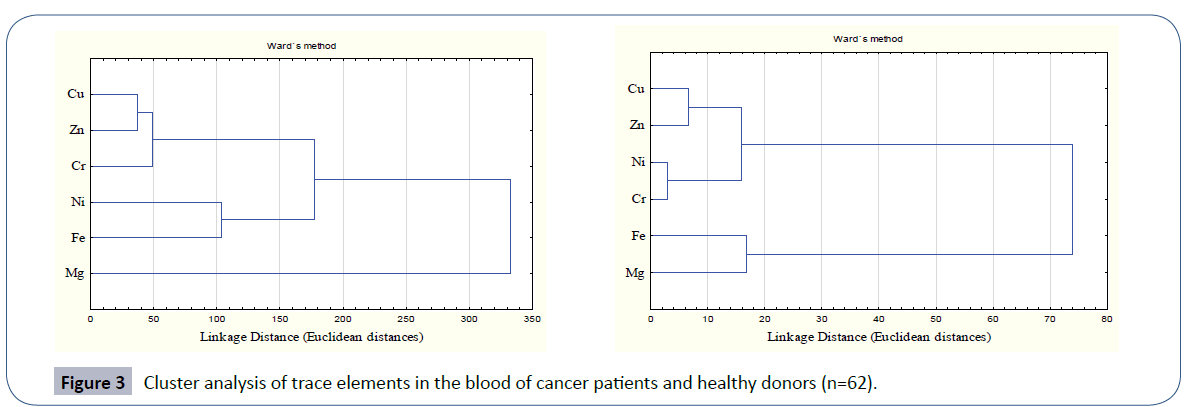
Figure 3 Cluster analysis of trace elements in the blood of cancer patients and healthy donors (n=62).
Gender based studies of trace elements in the blood of leukemia subjects
The trace elements observed in the blood of leukemia subjects were also segregated to study the behavior of trace elements in two genders. Table 5 furnishes data on distribution of trace elements in thirty six male leukemia patients and 26 female patients in comparison to corresponding healthy donors. The data for male patients presented the highest mean level for Mg with the order for the selected trace elements being: Mg > Fe > Cu > Cr > Zn > Ni with their respective mean levels being: 28.49, 10.57, 3.032, 1.381, 1.248 and 0.713 μg/mL. The large variations in minimum and maximum values evidenced the non-normal distribution of the data. The order observed for the mean levels of trace elements in the blood of male healthy controls was: Mg > Fe > Zn > Cu > Ni > Cr which was quite different from the male patients. Also the levels observed for all the trace elements were significantly different in male patients than healthy donors (p<0.05).
| leukemia patients male (n=36) |
|
Cu |
Ni |
Fe |
Mg |
Zn |
Cr |
Age (year) |
| Minimum |
0.175 |
0.135 |
0.180 |
0.200 |
0.120 |
0.100 |
3.0 |
| Maximum |
10.90 |
2.240 |
48.82 |
75.90 |
3.091 |
3.150 |
58.0 |
| Mean |
3.032 |
0.713 |
10.57 |
28.49 |
1.248 |
1.381 |
24.3 |
| Median |
2.210 |
0.611 |
2.625 |
28.80 |
0.675 |
1.044 |
20.5 |
| S. D. |
2.622 |
0.431 |
15.38 |
22.02 |
1.711 |
0.861 |
14.3 |
| S. E. |
0.437 |
0.072 |
2.564 |
3.671 |
0.285 |
0.143 |
2.381 |
| Controls male (n=36) |
Minimum |
0.889 |
0.419 |
3.535 |
15.38 |
1.816 |
0.084 |
3.000 |
| Maximum |
1.507 |
0.550 |
5.140 |
27.32 |
2.193 |
0.146 |
58.00 |
| Mean |
1.174 |
0.483 |
4.352 |
20.78 |
2.022 |
0.119 |
24.31 |
| Median |
1.117 |
0.481 |
4.523 |
17.15 |
2.092 |
0.120 |
21.50 |
| S. D. |
0.203 |
0.035 |
0.457 |
4.923 |
0.138 |
0.017 |
13.99 |
| S. E |
0.034 |
0.006 |
0.076 |
0.821 |
0.023 |
0.003 |
2.317 |
| Leukemia female patients (n = 26) |
Minimum |
0.000 |
0.210 |
0.166 |
1.220 |
0.220 |
0.123 |
6.000 |
| Maximum |
13.40 |
3.915 |
22.40 |
69.60 |
2.870 |
1.590 |
60.00 |
| Mean |
3.388 |
1.022 |
5.372 |
24.58 |
1.491 |
0.732 |
29.9 |
| Median |
1.775 |
0.555 |
1.825 |
24.60 |
0.858 |
0.666 |
26.50 |
| S D |
3.829 |
0.991 |
7.201 |
18.05 |
1.312 |
0.481 |
15.12 |
| S E |
0.751 |
0.194 |
1.412 |
3.539 |
0.257 |
0.094 |
2.965 |
| Female controls (n = 26) |
Minimum |
0.954 |
0.448 |
3.424 |
15.71 |
1.805 |
0.086 |
6.000 |
| Maximum |
1.498 |
0.586 |
6.357 |
27.28 |
2.366 |
0.140 |
60.0 |
| Mean |
1.232 |
0.493 |
4.405 |
20.63 |
1.982 |
0.111 |
29.1 |
| Median |
1.212 |
0.491 |
4.228 |
17.02 |
1.892 |
0.109 |
25.0 |
| S D |
0.175 |
0.033 |
0.632 |
5.064 |
0.150 |
0.019 |
15.21 |
| S E |
0.034 |
0.006 |
0.124 |
0.993 |
0.029 |
0.004 |
2.984 |
Table 5: Descriptive statistics of trace elements in the blood of the leukemia patients and healthy donors of both genders.
For the female subjects the mean age was found to be 29.9 years (Table 5). Quite similar to the previous case, these patients exhibited the highest mean levels for Mg standing at 24.58 μg/ mL. The highest level recorded for Cu was 13.4 μg/mL. Iron here was present at mean level of 5.372 μg/mL against the maximum concentration of 22.4 μg/mL. Zinc and Cu exhibited the mean levels of 1.491 μg/mL and 3.388 μg/mL respectively. Thus the order for the mean levels of selected trace elements in blood of female leukemia patients was: Mg > Fe > Cu > Zn > Ni > Cr. The counterpart data for the controls exhibited the order for mean levels: Mg > Fe > Zn > Cu > Ni > Cr. The levels of these trace elements were also found to be significantly lower than the patients except for Zn that was present at level of 1.982 μg/ mL in controls in comparison to female patients where its mean concentration was 1.49 μg/mL. In case of healthy donors, all the trace elements except Ni and Cu were present at higher levels in males than females. In leukemia patients in addition to Ni, Cu and Cr were also observed to be present at higher levels in females. The order observed for male patients was quite similar to one observed for female patients with only one difference, i.e., in male patients, Cr was present at least concentration levels where as in female patients, it was present at appreciably high concentrations. There is increasing evidence that trace elements differ in prevalence in prevalence in different genders and are manifested differently in two genders. However, the database is small. Differences in exposure, anatomy, physiology, biochemistry, and behavior between males and females are the dominant factors in deciding the effects and roles of different trace elements [48]. Higher levels of some of the metals such as Cd were reported to be associated with estrogenic effects in women [49].
The quartile distribution of the trace element data in male and female patients of leukemia in comparison to their healthy controls is furnished in Figure 4. The spread and SD of the data was more pronounced in male and female patients than the corresponding healthy donors. Cluster analysis (Figure 5) evidenced two main clusters of the trace elements in male patients. The first cluster comprised of Cu-Fe-Mg while the second cluster comprised of Ni-Zn-Cr. In case of controls again two major clusters were obtained; the first cluster comprised of Cu-Zn, while the second cluster comprised of Ni-Mg-Fe-Cr (Figure 5). A different clustering behavior of the trace elements evidenced a change in trace element metabolism in patients as compared to healthy donors. The disturbed levels of one or more trace elements in patients as compared to controls in two genders may exert antagonistic influence on other trace elements thereby causing a change in etiology of disease.
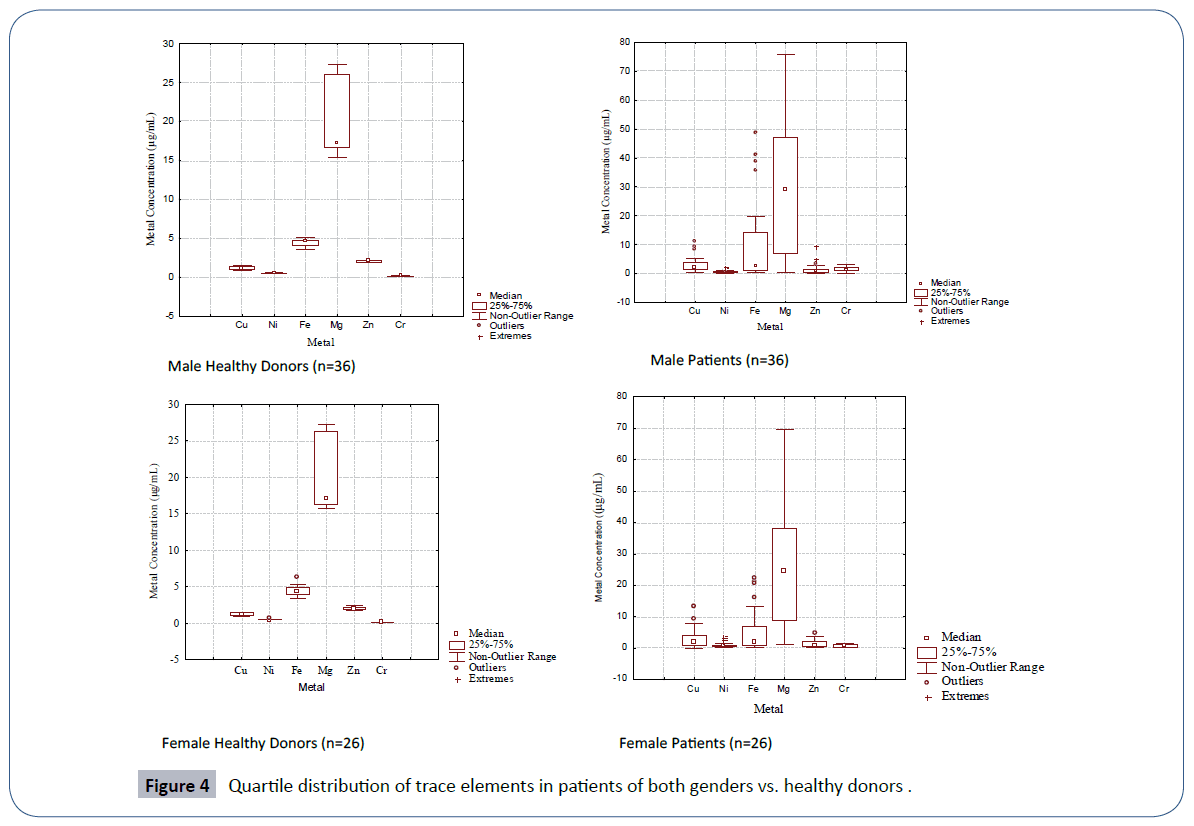
Figure 4 Quartile distribution of trace elements in patients of both genders vs. healthy donors .
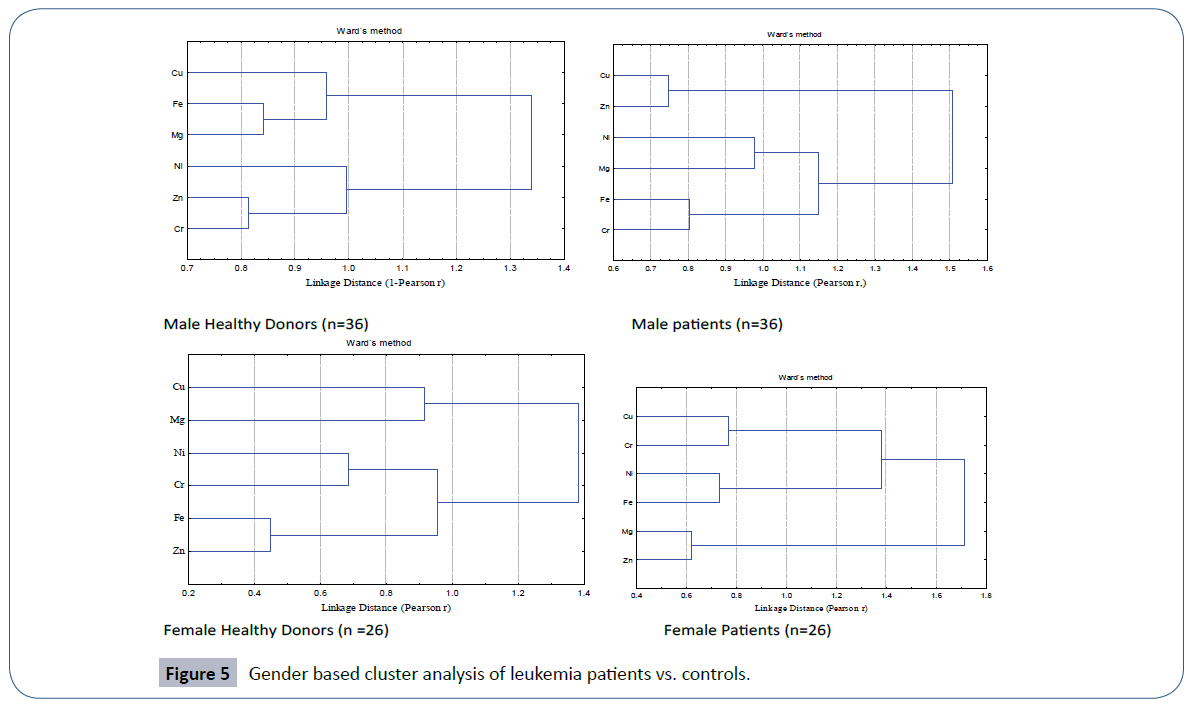
Figure 5 Gender based cluster analysis of leukemia patients vs. controls.
In healthy females, the cluster analysis depicted three primary clusters of trace elements with the most significant between Fe-Zn, linked with in a Pearson linkage distance of 0.5 (Figure 5). Nickel and chromium formed other primary cluster. Within a linkage distance of 1.0, both these primary clusters were linked together to form a secondary cluster, there by evidencing the dependence of these trace elements upon each other. Cu and Mg were the trace elements that formed third primary cluster in female controls. A similar trend of formation of three primary clusters was also observed in female patients but with different sequence of trace elements. Here most significant primary cluster was observed between Mg-Zn pair that was associated with in a linkage distance of 0.7. With a slightly increased linkage distance, Fe-Ni formed second primary cluster that was joined with the third primary cluster formed by Cu-Cr thereby forming secondary cluster. Thus different clustering behavior of trace elements was recorded in female patients and controls.
Conclusion
The present study has evidenced the abnormally high levels of trace elements such as Cr, Cu, Ni and Fe in the blood of leukemia patients than healthy controls. Zinc, that is known to form normal lymphocytes was recorded at lower levels in leukemia patients than healthy controls. Moreover, the clustering behavior of trace elements in leukemia patients was quite different from the controls. The study thus evidenced that leukemia was associated with disorder of blood trace element levels. Gender was another factor that affected the distribution of trace elements in the blood of controls as well as patients. Cu and Zn were observed at higher levels in females of both controls and patients. Female leukemia patients were also characterized by higher Cr levels than males.
References
- Schubert HL, Wilson KS, Raux ESC, Woodcock SC, Warren MJ (1998) The X-ray structure of a cobalamin biosynthetic enzyme, Co-precorrin-4 methyltransferase. Nat StrucBiol 5: 585-592.
- Kazi TG, Afridi HI, Kazi N, Jamali MK, Arain MB, et al. (2008) Distribution of Zn, Cu and Fe in biological samples of Pakistani myocardial infarction patients and controls. ClinChimActa 389: 114-119.
- Sadat AN, Hossain MI, Hossain MK (2008) Serum Trace Elements and Immunoglobulin Profile in Lung Cancer Patients. The J Appl Res 8: 24-3.
- Rivera L, Mancía S, Pérez-Neri I (2010)The transition metals Cu and Fe in neurodegenerative diseases. Chemico-Biol Interact 186: 99-184.
- Pasha Q, Malik S A, Shaheen N, Shah H M (2010) Investigation of trace metals in the blood plasma and scalp hair of gastrointestinal cancer patients in comparison with controls. ClinChimActa 411: 9-531.
- Ionescu J G, Novotny J, Stejskal V, Lätsch A, Blaurock-Busch E, et. al. (2006) Increased levels of transition metals in breast cancer tissue. NeuroEndocrinLett 9-36.
- Blazewicz A, Dolliver W, Sivsammye S, Deol A , Randhawa R, et. al. (2010) Determination of Cd, Co, Cu, Fe, Mn, and Zn in thyroid glands of patients with diagnosed nodularuanid using ion chromatography. J Chromatography B, Anal Technol in the Biomed and Life Sci 878: 34-38.
- Pasha Q, Malik S A, Shah M H (2008) Statistical analysis of trace metals in the plasma of cancer patients versus controls. J Haz Mat 153: 21-1215.
- Afridi H M, Kazi TG, Kazi N, Jamali MK, Arain MB, et al. (2008) Evaluation of status of toxic metals in biological samples of diabetes mellitus patients. Diab Res ClinPrac 80: 280-288.
- Chwiej J (2009)The use of cluster and discriminant analysis in the investigations of the role of trace metals in the pathogenesis of Parkinson’s disease, J Trace Elem Med andBiol 24: 78-88.
- Alimonti A, Bocca B, Pino A, Ruggieri F, Forte G, et al. (2007) Elemental profile of cerebrospinal fluid in patients with Parkinson’s disease. J Trace Elem Med andBiol 21: 41-234.
- Fraga CG, Oteiza PI (2002) Iron toxicity and antioxidant nutrients, Toxicology 180: 23–32.
- Classen HG, Gröber U, Löw D, Schmidt J, Stracke H (2011) Zinc deficiency: Symptoms, causes, diagnosis and therapy, Med Monatsschr Pharm 34: 87-95.
- Sandstead HH (1994) Understanding zinc: recent observations and interpretations. J Lab Clin Med 124: 322-327.
- McCarthy TJ, Zeelie JJ, Krause DJ (1992)The antimicrobial action of zinc ion/antioxidant combinations, ClinPharmacolandTher 17: 5.
- Solomons NW (1998) Mild human zinc deficiency produces an imbalance between cell-mediated and humoral immunity. Nutr Rev 56: 27-28.
- Zundahl S (1998) Chemical Principles. 3rd edition, Houghton Mifflin Co., New York. 710-711, 1019-1020.
- Prasad AS (1995) Zinc: an overview. Nutrition 11: 93-99.
- Oblender M, Carpentieri U (1991) Growth, ribonucleotidereductase and metals in murine leukemic lymphocytes. J Cancer Res and Clinic Oncol 117: 444-448.
- Hamilton IM, Gilmore WS, Strain JJ (2000) Marginal copper deficiency and atherosclerosis. Biol. Trace Elem. Res 78: 179-189.
- Harris ED (2001) Copper homeostasis: the role of cellular transporters, Nutr Rev 59: 281-285.
- Rottkamp CA, Nunomura A, Raina AK, Sayre LM, Perry G, et al. (2000) Oxidative stress, antioxidants, and Alzheimer’s disease. Alzheimer Disease Assoc Disorders 14: 62-66
- Araya M, Pizarro F, Olivares M, Arredondo M, Gonzalez M et al. (2006)Understanding copper homeostasis in humans and copper effects on health, Biol Res 39: 183-187.
- Bonham M, Jacqueline M, Bernadette M H, Strain J J (2002)The immune system as a physiological indicator of marginal copper status? Brit JNut 87: 393-403.
- Rakel D (2007) Integrative Medicine. Saunders Elsevier (2nd edition).
- Davis CD (2003) Low dietary copper increases fecal free radical production, fecal water alkaline phosphatase activity and cytotoxicity in healthy men. J Nutr 133: 522-527.
- Rottkamp CA, Nunomura A, Raina AK, Sayre LM, Perry G, et al. (2000) Oxidative stress, antioxidants, and Alzheimer’s disease. Alzheimer Disease Assoc Disorders 14: 62-66.
- Christen Y (2000) Oxidative stress and Alzheimer’s disease. Am J ClinNutr 71: 621-629.
- Kanumakala, S, Boneh, A, Zacharin, M (2002) Pamidronate treatment improves bone mineral density in children with Menkes disease, J Inherit Metab Dis 25: 391–398.
- Kusal K. Das (2009) A comparative review on nickel (II) and chromium (VI) toxivities-possible antioxidant (Allium Sativum Linn)Defenses, Al Ameen J. Med. Sci2:43-50.
- Stohs SJ, Bagchi D (1995) Oxidative mechanisms in the toxicity of metal ions. Free RadicBiol Med 18:321-336.
- Das KK, Gupta AD, Dhundasi SA, Patil AM, Das SN, et al. (2006) Effect of L-ascorbic acid on nickel-induced alterations in serum lipid profiles and liver histopathology of rats . J Basic ClinPhysiolPharmacol17: 29-44.
- Elin RJ (2010) Assessment of magnesium status for diagnosis and therapy. Magnes Res 23: 194-198
- Swaminathan R (2003) Magnesium metabolism and its disorders. ClinBiochem Rev 24: 47-66
- Saris NE, Mervaala E, Karppanen H, Khawaja JA, Lewenstam A (2000) An update on physiological, clinical and analytical aspects. ClinChimActa294: 1-26.
- Aikawa JK (1981) Magnesium: Its Biological Significance. Boca Raton, FL: CRC Press.
- Geiger H, Wanner C (2012) Magnesium in disease. Clin Kidney J 5: i25-i38.
- Wacker W (1980) Magnesium and Man. Cambridge, MA: Havard University Press 1-184.
- Katsifis SP, Kinney PL, Hosselet S, Burns FJ, Christie NT (1996) Interaction of nickel with mutagens in the induction of sister chromatid exchanges in human lymphocytes. Mutat Res 359:7–15.
- Savitz DA, Chen J (1990) Parental occupation and childhood cancer: review of epidemiologic studies. Environ Health Perspect 88: 325-337.
- Clodfelder BJ, Chang C, Vincent JB (2004) Absorption of the biomimetic chromium cation triaqua-3-oxo-µ-hexapropionatotrichromium (III) in rats. Biol Trace Elem Res 97: 1-11.
- Kohalmi SE, Gattke M, McIntosh EM, Kunz BA (1991) Mutational specificity of DNA precursor pool imbalances in yeast arising from deoxycytidylatedeaminase deficiency or treatment with thymidylate. J MolBiol220: 933-946.
- Reddy SB, Charles MJ, Raju GJN, Reddy BS, Reddy TSet al. (2004) Trace elemental analysis of cancer-afflicted intestine by PIXE technique. Biol Trace Elem Res 102: 265-281.
- Pelletier L, Dayan A D (1990) Immunologically mediated manifestations of metals. In: Immunotoxicity of metals and immunotoxicology. PlenumPress, New York.
- Yang Y, Jin XM, Yan CH, Tian Y, Tang JY, et al. (2008) Urinary level of nickel and acute leukaemia in Chinese children. ToxicolInd Health 24: 603-610.
- Davies S, McLaren Howard J, Hunnisett A, Howard M (1997) Age-related decreases in chromium levels in 51,665 hair, sweat, and serum samples from 40,872 patients: implications for the prevention of cardiovascular disease and type II diabetes mellitus. Metabolism 46: 469-473.
- Offenbacher E.G (1992) Chromium in the elderly, BiolTrace Elem Res 32: 123-131.
- Gochfeld M (2007) Framework for gender differences in human and animal toxicology,Environ Res, 104:4-21.
- Vahtera M ,Åkesson A,Lidén C, Ceccatelli S,Berglund M (2007) Gender differences in the disposition and toxicity of metals, Environmental Research 104: 85-95.