Keywords
Barriers to cessation; Reasons for quitting; Cigarette; Drinking; Concurrent
Introduction
Food products most often contain small amounts of heavy metals which contribute to dietary intakes and the levels of these metals requires regular observations and control. However, contamination of food products by heavy metals is becoming an unavoidable problem and has been important in extensive research in the last decades [1].
Biscuit is a baked, edible, and common flour based food product. The key raw materials for production of biscuits are flour, sugar, shortenings, salt, glucose, starch and milk or water. Production of several types of biscuits such as plain, cookies, oates, cream crackers, pop tarts, short bread, digestives, biscotti, shortcakes, ginger nut, cabin, rich tea, wafers depends on the ingredients used and manufacturing process employed. Biscuits are one of the important bakery products in human diet and can be eaten the whole day regardless of time. They are favorite food items for children and are most times granted to them as an expression of love and fondness from friends and family [2]. They are also important constituents of Nigerian children’s diet in terms of quantity consumed where most of these children eat biscuit on a daily basis. Thus, the chemical contamination of biscuit is possible to affect majority of these children. The total biscuit consumption is estimated to be between 450,000 to 500,000 metric tons annually [3]. Biscuits can be eaten with tea, coffee and fruit drinks and also be used as wearing food for infants. Adults consume biscuits as snacks between meals while school children use them as snacks while at school. Biscuits are also used as refreshment item in meetings, functions, parties and for entertaining guests [4]. Furthermore, biscuits do not require cooking and can be served ready. They make tasty nutritious snacks, affordable by all classes of people, very easy to digest, compact in size, and can be preserved for a long time. The commonly consumed biscuits in Nigeria are cream crackers biscuits, soft dough biscuits (digestives) and hard dough biscuits (sweet cabin).
Among several natural substances that are concentrated in man’s environment, heavy metals are the most ubiquitous [5]. Generally heavy metals which are not easily degradable or metabolized and are usually persistent may be biologically accumulated in food items, trapped on the outer surface or may be added due to manufacturing or processing of food for consumption [6]. The concentration of heavy metals in food is of great significance because they are either toxic or essential to human health. Some of these essential metals such as Zn, Fe, Se, Mo and Cu are present in small concentrations which may be bio-toxic to humans if it is sufficiently available [7-9]. The essential metals are important components of enzymes in which they attract or subtract molecules and facilitate their conversion to specific end products. For example, Iron is involved in the binding, transporting, and release of oxygen in higher animals. Essential metals also control important biological processes by facilitating the binding of molecules to their receptor sites on cell membrane, by alternating the structures or ionic nature of membrane to prevent or allow specific molecules to enter or leave a cell and in inducing gene expression resulting in the formation of protein involved in life processes [10]. In addition some of these essential elements are also important for normal functioning of the body system but when their levels exceed permissible tolerable limit for humans [11], they can lead to deleterious effects resulting into ill health cases, decrease in quality of life and ultimately death. Examples of toxic metals are lead, cadmium, nickel, mercury when present even at low levels are deleterious to humans because they are toxic and cannot be tolerated even at low concentrations [12]. These toxic metals are present in all components of the environment- land, atmosphere and aquatic systems and they have most severely affected the environment. The toxic trace metals have no identified biological function and show toxicological cases even at trace concentrations. The presence of Cadmium in food is poisonous to human health and adsorption of a few milligrams can lead to several serious diseases or neoplasia. Likewise, Lead in food has toxic effects in adults as well as young children. There are reports that indicate Lead in blood to be as low as 10 mg dL-1 which is very harmful to growing children [13]. After a number of surveys of heavy metals in food products, Food Safety Authority of Ireland [14] reported that Pb and Cd were constantly detected in various food stuffs such as meat, fish, vegetables, milk, cereals and fruits. However, the International Agency for Research on Cancer (IARC) categorized Pb and Cd as carcinogenic to humans. In order to safeguard human health, the EU legislation set maximum levels of 0.2 mg/kg Pb and Cd in cereals and cereal based products (flour, wheat, rye) used as a major component for making biscuits [15].
Food consumption is a constant means of exposure to toxic heavy metals because they are naturally found in food products [2,16,17]. Contamination of food products with heavy metals can also occur as a result of their abundance in the environment. Similarly, contamination can also occur due to pick up of metals from equipment, processing or packaging materials. These contaminated food products with heavy metals contribute to human dietary intakes and the levels of these metals need to be regularly observed and controlled. Heavy metals can develop gradually in the body tissue and overtime could exceed tolerable limits which can cause intense toxicity leading to human disease, disorders, defects, illness, malfunctioning and malformation of organs and ultimately death [18]. However, heavy metals which are naturally present in most foods, may be added to particular foods as a way of improving diet in regions where dietary intake of certain essential elements may be insufficient. Therefore, in order to ensure appropriate balance of metal content in food items, food standards should be implemented to enforce maximum concentration levels of various metals. This can also deter fraudulent labeling of a food’s origin since the metal content can be used to identify provenance.
As in the case of Nigeria as well as other developing countries, the daily food intake of infants and school children contains substantial proportion of different varieties of biscuits which makes them more vulnerable to contamination because they have immature immune system and they have much higher rate of absorption of heavy metals than adults [19]. However, children’s exposure to contamination could be as a result of various patterns of deeds and behavior as they consume larger amounts of food and have a habit of eating different kinds of food than adults which makes them more susceptible to the consequences of exposure. Biscuit products are naturally enjoyed by school children and often times wrapped in attractive and colorful packs in order to attract them to purchase the products. Producers use these colorful packaging materials without bordering about the problem of food contamination [13]. These packs sometimes contain toxic heavy metals like Pb, Cr, Ti, Zn and Cu which can contaminate the food on contact with the printed surface through blocking, peeling, rubbing, glazing and diffusion [20]. Also, the sticky nature of biscuits especially those products laced with different cream flavors could cleave unto the inner surface of the wrapper by this means introducing heavy metals to such product. Likewise, heavy metals contamination of biscuit products may arise from the raw materials used in biscuits baking. However, majority of trace metals are introduced into biscuit products through contamination as a result of unhygienic conditions of the baking environments. In addition, inadequate precautionary measures taken could also cause cross-contaminations of biscuit products from other environmental sources. It is therefore essential to estimate dietary intakes of essential metals and evaluate health risk of human exposure to toxic metals, knowing the damage that contamination of food by heavy metals could cause [21]. In this current stage of economic growth, the concentration of metals in food items at the point of consumption is necessary for the dietary intake of trace metals from food consumption especially in children since they are the most affected age grade. Therefore, continuous research should be taken to determine the levels of some trace elements in food, either for their essential nature or toxicity. It is quite important to do so since some of the essential ones at elevated levels have serious adverse health effects.
There are diverse pathways of exposure of the general public to toxic chemicals like heavy metals. Veritably, food has been known to be the major route of exposure, therefore interest in quality and safety of food consumed has increased in the prospect of reports on contaminated foodstuffs. Currently, there are reports from both developing and developed nations on the increase in the accumulation of heavy metals in the environment ascribing to their presence in the food chain via the ingestion of various foodstuffs. It is in line with these assertions that this study is designed to reveal some heavy metals content of some biscuit brands commonly available in Nigerian markets.
Contamination of biscuit products with heavy metals can arise at any stage in the chain of production (i.e. from the raw materials, processing, packing, transportation, storage or marketing) to the point of consumption [19]. Trace metals could also appear in biscuits as a result of improper handling during packaging. It is therefore necessary to constantly monitor the concentration of metals in food items such as biscuit at the point of consumption for evaluation of human exposure to these contaminants [22]. Likewise, it is required to continually track the quality of biscuit products that is being purchased by the consumer most especially children in order to ensure that trace metals content does not go beyond the permissible level that will not be detrimental to human health. In light of this event, the objective of this study was set out to assess the concentration of heavy metals in selected biscuit brands in Nigeria and evaluate the dietary daily intake, target hazard quotient (non-carcinogenic risks) and carcinogenic risks from the consumption of biscuits.
The levels of toxic heavy metals in selected brands of biscuits have been carried out by many authors in Nigeria and around the world. Some of the literatures and their respective countries include India [9], Turkey [23], Egypt [24], Greece [25] and Nigeria [2]. However, the available information on the concentration of heavy metals in biscuit products in Nigeria is scanty in literature. For this reason, this research serves as a baseline for further possible investigation.
Materials and Methods
Sampling
Ten different brands of biscuits commercially available were purchased from various retail shops and supermarkets in Ibadan and Iwo in Nigeria. The various brands of biscuits samples were collected within the four major classes of biscuits which are cookies, shortcake, cream crackers and digestive. A total of 2-3 brands of biscuits samples with three different batch numbers and different dates of manufacture were collected within each major group. Comprehensive information with reference to the brand name, class, net weight and ingredients of the samples is provided in Table 1. In selecting these samples, precautions were made in order to reflect the various popular brands consumed by different income groups and different age groups especially children. It was also influenced by the availability of biscuits products at the time of study. The samples were preserved in the refrigerator prior to analysis.
| S/N |
Brand Name |
Class |
Net Weight
(g) |
Ingredients |
| 1 |
Haansbro milkrich cookies |
Cookies |
78 |
Wheat flour, hydrogenated vegetable fat, sugar, skimmed milk powder, invert syrup, ammonium bicarbonate, vitamin B12, salt, milk flavor, egg yolk powder, sodium bicarbonate, emulsifier (E322, E471). |
| 2 |
Krakjak cream crackers |
Crackers |
20 |
Wheat flour, sugar, hydrogenated vegetable fat, invert syrup, skimmed milk powder, salt, yeast, ammonium bicarbonate, sodium bicarbonate, butter and vanilla flavor. |
| 3 |
Beloxxi cream crackers |
Crackers |
21 |
Wheat flour, vegetable shortening, carotene, palm oil, sugar, glucose syrup, corn flour, salt, baking powder, vanilla flavoring. |
| 4 |
Igloo chocolate cookies |
Cookies |
48 |
Wheat flour, sugar, refined palm oil, whey powder, skimmed milk powder, cocoa powder, corn starch, sodium bicarbonate E500, ammonium bicarbonate E503, salt, malt extract, di-calcium phosphate, soya lecithin E322, chocolate flavor. |
| 5 |
Nutribix cream crackers |
Crackers |
70 |
Wheat flour, refined palm oil, sugar, malt extract, milk powder, butter fat, corn starch, raising agents, invert syrup, salt, yeast, sodium metabisulphite, butter vanilla flavor, butter powder, emulsifier, enzyme (proteolytic). |
| |
| 6 |
Haansbro Butterbread |
Shortcake |
90 |
Wheat flour, sugar, hydrogenated vegetable fat, inverted syrup, ammonium bicarbonate, skimmed milk powder, salt, sodium bicarbonate, emulsifier (E322, E471) and butter flavor. |
| 7 |
Haansbro fibre plus biscuit |
Digestive |
40 |
Wheat flour, sugar, hydrogenated vegetable fat, wheat bran, invert syrup, ammonium bicarbonate, skimmed milk powder, salt, sodium bicarbonate, emulsifier, butter flavor. |
| 8 |
Haansbro shortcake biscuit |
Shortcake |
40 |
Wheat flour, hydrogenated vegetable fat, invert syrup, ammonium bicarbonate, skimmed milk powder, salt, sodium bicarbonate, vanilla flavor, emulsifiers (E322&E471). |
| 9 |
McVities digestive |
Digestive |
40 |
Wheat flour (51 %), partially hydrogenated vegetable fat (palm), sugar, whole meal wheat flour (12 %), raising agents, invert sugar syrup, salt, antioxidant (E321), gluten. |
| 10 |
Haansbro Oats |
Digestive |
56 |
Wheat flour, oats flakes, hydrogenated vegetable oil, sugar, wheat bran, invert syrup, skimmed milk powder, ammonium bicarbonate, salt, sodium bicarbonate, milk flavor, emulsifiers (E322&E471). |
Table 1: Information on the Different Brands of Biscuits Examined.
Reagents
All reagents and chemicals used were of analytical grades. These include: 69.5-70.5% Nitric acid (BDH, England), 70% Perchloric acid (Sigma-Aldrich, Germany), 98% Sulphuric acid (BDH, England) and 99.5% Acetone (BDH, England). The working standard of Mn, Zn, Cu, Cr, Fe, Pb and Cd were prepared by diluting concentrated stock solutions of 1000 mg/L (Chem-Lab NV, Industrienterrein, Belgium) with 2% nitric acid.
Sample preparation
The biscuit samples were cut open from their polyethylene wrappers. Then the biscuit samples were dried in an oven at 60ºC approximately 30 min for complete crispiness of samples. Each sample was ground to fine powder using a pre-cleaned agate mortar and pestle.
Sample digestion
One (1 g) of the solid powdered sample of each of the thirty biscuit samples was transferred into a Teflon beaker, 5 mL of concentrated HNO3 was added and the mixture mixed carefully and covered with a watch glass. The covered mixture was heated over a thermostated hot plate maintained at 120-150°C for about 1 h in a fume cupboard. 1 mL of HNO3 was added at intervals to prevent total drying up of the liquor. After this, the beaker was brought down and cooled for 5 to 10 min, next, 1 mL of HClO4 and 1 mL of H2SO4 was added to the mixture and digested further at 150°C for about 30-40 min until the content became colourless. The digested aliquot was withdrawn from the hot plate and was cooled to room temperature, filtered quantitatively into 25 cm3 volumetric flasks and made up with doubly distilled water to the mark. Subsequently this was poured into 25 mL plastic vial in preparation for Atomic Absorption Spectroscopy analysis. Analytical blanks were also prepared in the same manner excluding the sample for metal determination.
Metal analysis
The concentrations of Mn, Zn, Cu, Cr, Fe, Pb and Cd in digested sample solution were determined using Flame Atomic Absorption Spectrophotometer (FAAS) (FAAS, AA990 PG instrument, UK) available at the Central Laboratory, Bowen University, Iwo. Standard solutions and analytical blanks were analysed in the same manner as the samples and the equivalent concentrations of each samples were recorded in mg/kg units. The report on the working conditions of the FAAS used for analyzing the biscuit samples is presented in Table 2.
| Element |
Wavelength (nm) |
Calibration range (mg/L) |
Characteristics concentration (mg/L) |
| Mn |
279.50 |
0.01-3.5 |
0.02 |
| Zn |
213.90 |
0.01-3.0 |
0.01 |
| Cu |
324.80 |
0.018-4.0 |
0.03 |
| Cr |
357.90 |
0.04-8.0 |
0.05 |
| Fe |
248.30 |
0.03-8.0 |
0.05 |
| Pb |
217.00 |
0.08-14.0 |
0.08 |
| Cd |
228.80 |
0.02-2.2 |
0.012 |
Characteristics concentration = Magnitude of absorbance signal produced by a specified analyte concentration.
Table 2: Working Conditions of Flame Atomic Absorption Spectrophotometer.
Quality control
The quality control was performed in order to determine the reliability and accuracy of results. The quality control approaches included the use of sample replicates, analytical blanks, calibration and recovery analysis.
Blank determination: Blank determination was performed to verify the background levels of metals of interest in the materials and reagents used for analysis. This was carried out by running a separate determination under the same experimental conditions applied in the actual analysis of the sample, but excluding the sample. In this determination, the amount of all the reagents used was the same with the amounts used in the biscuit digestion but in the absence of biscuit samples. The values acquired from running blank determinations were subtracted from the metal values as appropriate [19].
Calibration: The FAAS was re-calibrated for every batch of 10 samples analyzed by analyzing a reagent blank. The calibration of FAAS was important to determine the result of the analytical steps taken regarding the known quantities of standards of trace metals involved in order to evaluate the result of the unknown quantities in the sample. Various concentrations were prepared for individual metal solution serially for the estimation of metals in the samples. Regression data for the calibration curves are presented in Table 3. These metal solutions was analysed on the FAAS to acquire calibration graph which will be applied to determine the concentrations of trace metals in the samples by automatic interpolation with regards to the calibration graph. The detection limits is the lowest concentration which can vary from a blank solution. The limits of detection (mg/L) were assessed as three times on the basis of background noise produced from the analysis of blank samples (n=3). The limit of detection (LOD) and limit of quantification (LOQ) were the level of analyte that provide a signal-to-noise ratio of 3 and 10 respectively. The values for the LOD and LOQ (in mg/kg) for each of the metals are presented in Table 3.
| Element |
R2 |
LOD (mg/kg) |
LOQ (mg/kg) |
% R |
| Mn |
0.993 |
0.002 |
0.02 |
91.8 |
| Zn |
0.948 |
0.003 |
0.03 |
85.7 |
| Cu |
0.951 |
0.004 |
0.04 |
87.5 |
| Cr |
0.997 |
0.005 |
0.05 |
90.3 |
| Fe |
0.999 |
0.004 |
0.04 |
93.5 |
| Pb |
0.999 |
0.013 |
0.13 |
92.9 |
| Cd |
0.986 |
0.003 |
0.03 |
90.4 |
LOD = 3∂
LOQ = 10 X LOD
Table 3: Regression Data for the Calibration Curves.
Recovery analysis: The recovery analysis was carried out to determine the accuracy of analytical methods employed in this research. One gram (1 g) of the grinded biscuit samples was taken twice from the same brand. One of the sample was spiked with 25 μg/mL measured out of 50 μg/mL of the standard heavy metals solution. The second sample was not spiked and it served as a control. The two samples were separately digested but in the same method as previously defined. After digestion, the mixtures was poured separately into a 25 mL volumetric flask and made up to the mark with distilled water. The concentrations of individual metals in both mixtures were analysed with FAAS. For individual metal, the percentage recovery was estimated using the following formula:
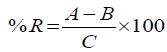
Where A is the concentration of each heavy metal in the spiked biscuit sample, B is the concentration of each heavy metal in the unspiked biscuit sample and C is the amount (ppm) of heavy metal used for spiking. The value for % R for each metal is given in Table 3.
Health risk assessment of heavy metals
Health risk assessment has been generally used in research associated with human healthiness [26]. The prominent guides applied for health risk assessment comprises of estimated daily intake of metals (EDI), target hazard quotients for noncarcinogenic risk, and carcinogenic risk assessment of heavy metals. In this study, the health risk assessment will be calculated for three different age groups involving adult (22-48.9 years having an average body weight of 60 kg) [19], school children (6- 15 years having an average body weight of 35 kg) [26,27] and infants (1-6 years having an average body weight of 15 kg) [2,19]. The consumption rate of 40 g was used which was established on the per capital consumption of 14.6 kg per annum for the estimation of dietary intake of metals. The provisional tolerable weekly intake (PTWI) was used as a standard for each metal exposure [28].
Estimated daily intake (EDI)
The daily intake of metals was calculated to evaluate the average daily concentration of metal into the body system of a specified body weight of a consumer. The body weight of humans can affect the tolerance of contaminants. The daily ingestion of metals is dependent on both the metal concentration in food and the daily food consumption. Estimated daily intake of metals has been extensively evaluated by authors [19,29,26].
 (i)
(i)
Where EDI is the estimated daily intake (μg/kg bw/day), Cmetal is the Concentration of heavy metal in the biscuit sample (mg/kg), Dfood intake = Daily food intake (kg person-1 day-1), and BWaverage is the Body weight (kg person-1).
Target hazard quotient (THQ)
To estimate the level of concern originating from ingestion of metals through the consumption of these brands of biscuit, the target hazard quotient (THQ) values were calculated by using the determined concentrations of seven metals. It is essential to assess the non-carcinogenic risk in order to determine the potential health effects of contaminants via regular consumption of several metal ions [28,30]. Target hazard quotient is among the methods applied in examining lifetime exposure to metals through diets [28]. Target hazard quotients were created by United State Environmental Protection Agency to assess possible health effects related with chronic exposure to contaminants [26]. The Target Hazard Quotients have been extensively used by authors [19,29,26]. The THQ is the ratio between the determined concentration and the oral reference level considered not harmful, weighted by the length and frequency of exposure, quantity consumed and body weight. The oral reference dose (RFD) is an estimate of the daily exposure to the human population (including sensitive sub-groups) that is likely to be without an appreciable risk of deleterious effects during lifetime [19,30]. The THQ values via the ingestion of biscuits by infants, school children and adults were assessed for each heavy metal with the following formula [31]:
 (ii)
(ii)
Where THQ is the Target Hazard Quotient (limitless), EF is the Exposure Frequency (365 days/year) [30], ED is the Exposure duration of 48.9 years based on Nigerian life expectancy rate for an adult [19], C is the Concentration of contaminant in biscuit samples (mg/kg), DFI is the Daily biscuit intake (kg person-1 day- 1), RFD is the Oral reference dose for the metals under study: Cd (0.001), Pb (0.004), Cu (0.04), Zn (0.3), Cr (0.003), Mn (0.14), Fe (0.7) (mg/kg/day) [19], BW is the Body average weight (kg), AT is the Average exposure time for non-carcinogen (days) (365 days/year × ED) [19], 10-3 is the Conversion factor and EDI is the Estimated Daily Intake of metals (μg/kg/bw/day).
If the target hazard quotient is < 1, it indicates no health concern [19,26].
In this present work, cumulative THQ was calculated by adding the THQ value of each metal as follows [30]:
TTHQ = THQ (contaminant 1) + THQ (contaminant 2) +.....THQ (contaminant n) (iii)
Where, TTHQ is the Total Target Hazard Quotient. The above formula was given due to reports on health risk associated with exposure to multiple contaminants which can develop mutual effects [32]. However, the higher the Total Target Hazard Quotient value, the greater the level of concern.
Incremental lifetime carcinogenic risk (ILCR)
Carcinogenic risk (CR) specifies an increase in the possibility of an individual of developing cancer over a lifetime owing to exposure to a potential carcinogen. The possibility of cancer risks in the studied biscuit samples through the intake of carcinogenic heavy metals was estimated using the Incremental Lifetime Cancer Risk (ILCR). Incremental Lifetime Cancer risk to individual metal was obtained using cancer slope factor (CSF), which is the risk produced over a lifetime exposure of 1 mg/kg bw/day and it is specific to a particular contaminant [33]. The carcinogenic risk of both Pb and Cr were calculated. The equation that was applied for estimation of the cancer risk is as follows [34]:
 (iv)
(iv)
Where, ILCR is the Incremental Lifetime Cancer Risk (limitless), CSF is the carcinogenic slope factor for Pb and Cr as 0.0085 mg/ kg/day and 0.5 mg/kg/day, respectively and EDI is the estimated daily intake of individual metals (μg/kg/bw/day).
Acceptable risk levels for carcinogens range from 10−4 (risk of developing cancer over a human lifetime is 1 in 10,000) to 10−6 (risk of developing cancer over a human lifetime is 1 in 1,000,000). This means that carcinogenic risk index between 10-6 and 10-4 indicates an interval of allowable predicted lifetime risks for cancer causing agents. Hence, contaminants having the risk factors less than 10-6 may not be treated as contaminants for further concern. The cumulative cancer risk as a result of exposure to multiple carcinogenic trace metals due to consumption of a particular brand of biscuit was assumed to be the sum of the individual trace metal increment risks and calculated by the following equation [34].
 (v)
(v)
Where, n can be 1, 2,…n, and it is the individual carcinogenic heavy metals in biscuit samples.
Data analysis
The invariant treatment of data was carried out by one-way analysis of variance (ANOVA) to discover the variations between the means of samples at 95% confidence level and to identify precisely which brand vary significantly from the other brands. The statistical calculations for mean and standard deviation for concentrations of trace metals from triplicate sampling were performed with Statistical Package for Social Sciences IBM SPSS® software version 20.0 for window evaluation. Duncan’s multiple range tests were carried out post hoc to describe the differences between brands. The Linear Correlation Coefficient of the data was analysed using Pearson Correlation Coefficient. Variations between the brands were statistically significant when P < 0.05. The range (minimum and maximum) of the values for each brand of biscuits was displayed in parenthesis. The results of the mean values of trace metals concentration were employed for the evaluation of health risk assessment.
Results and Discussion
Mean concentrations of heavy metals in biscuit samples
The concentration (mg/kg) of heavy metals analysed in different brands of biscuits is displayed in Table 4. Analysis of Variance (ANOVA) (P=0.05) revealed that there was significant variation in the levels of metals according to the brands. The superscript indicates the variances or connection between various brands. Those with different superscripts across rows for each brand of biscuits are significantly different from each other (P=0.05), where a< b<c<d<e. The differences found among these brands may be attributed to the raw materials such as flour, production process like baking, packaging with nylon wrappers and contamination from the environment and these are possible factors considered to influence the contamination of these brands. Other probable sources of variability within and between brands from the same producer include batch-batch discrepancies in production, differences in brand production methods as well as pollution from exogenous sources. Wheat flour made from wheat is a major ingredient used in baking biscuits, as such it is possible that the wheat grass could have absorbed heavy metals from the soil they were cultivated [35].
| Biscuit Sample |
Heavy Metal (mg/kg) |
| Mn |
Zn |
Cu |
Cr |
Fe |
Pb |
Cd |
| BC1 |
12.5 ± 2.69c
(9.40-14.1) |
157 ± 24.6e
(138-185) |
ND |
37.8 ± 50.3ab
(5.55-95.9) |
122 ± 25.2a
(96.1-147) |
3.78 ± 2.03a
(1.45-5.13) |
ND |
| BC2 |
3.05 ± 0.11ab
(2.98-3.18) |
80.1 ± 17.9d
(60.1-94.8) |
ND |
ND |
296 ± 259a
(135-595) |
4.00 ± 2.77a
(1.15-6.68) |
ND |
| BC3 |
3.40 ± 3.50ab
(0.00-7.00) |
51.2 ± 14.2bcd
(34.9-61.1) |
ND |
30.1 ± 33.2ab
(0.00-65.70) |
188 ± 99.6a
(86.2-285) |
92.0 ± 68.3b
(29.7-165) |
ND |
| BC4 |
5.71 ± 2.19b
(3.90-8.15) |
17.4 ± 7.79ab
(8.73-23.8) |
ND |
19.2 ± 12.4ab
(8.70-32.9) |
243 ± 153a
(82.1-387) |
80.3 ± 49.6b
(37.6-135) |
ND |
| BC5 |
1.80 ± 3.12ab
(0.00-5.40) |
27.9 ± 8.91abc
(22.7-38.2) |
ND |
11.2 ± 3.29ab
(8.83-14.9) |
157 ± 93.8a
(65.1-253) |
3.93 ± 6.81a
(0.00-11.8) |
ND |
| BC6 |
1.89 ± 2.33ab
(0.00-4.50) |
31.8 ± 18.3abc
(13.3-49.9) |
ND |
11.7 ± 2.22ab
(10.1-14.3) |
143 ± 72.5a
(59.4-186) |
8.78 ± 3.43a
(5.40-12.3) |
ND |
| BC7 |
11.8 ± 3.58c
(7.70-14.3) |
135 ± 50.8e
(77.1-171) |
ND |
23.3 ± 12.2ab
(11.7-36.1) |
148 ± 79.9a
(83.6-237) |
6.35 ± 2.34a
(4.18-8.83) |
ND |
| BC8 |
ND |
25.8 ± 15.5abc
(13.8-43.3) |
ND |
22.6 ± 9.15ab
(13.7-31.9) |
99.4 ± 51.5a
(40.9-138) |
5.99 ± 0.73a
(5.18-6.60) |
ND |
| BC9 |
ND |
5.64 ± 3.39a
(1.95-8.63) |
ND |
38.5 ± 3.27ab
(36.1-42.2) |
170 ± 26.7a
(155-201) |
3.11 ± 1.12a
(1.90-4.10) |
ND |
| BC10 |
5.79 ± 4.05b
(1.18-8.73) |
68.3 ± 32.5cd
(48.9-106) |
ND |
46.4 ± 1.71b
(45.1-48.4) |
147 ± 9.26a
(137-156) |
3.53 ± 0.86a
(2.75-4.45) |
ND |
| Mean ± S.D |
4.59 ± 4.81 |
60.0 ± 52.9 |
ND |
24.1 ± 21.7 |
171 ± 109 |
21.2 ± 39.9 |
ND |
| CV (%) |
105 |
88.2 |
ND |
90.0 |
63.4 |
188 |
ND |
| FAO/WHO Safe limit |
500 |
99.4 |
73.3 |
2.3 |
426 |
0.3 |
0.2 |
Values are expressed as mean ± standard deviation of triplicate (n = 3).
ND = Not detected
CV = Coefficient of variation
FAO/WHO = Food and Agricultural Organization/World Health Organization [
35] safe limit for cereals and cereal-based food product.
Table 4: Heavy Metal Concentration (mg/kg) (Mean ± SD) in Selected Brands of Biscuits.
Manganese is a nutritional element essential for different biochemical processes. Mn is required for bone development, wound healing, reproduction and proper functioning of the central nervous system. Its excess in the body causes gait, apathy and tremors while its deficiency leads to bleeding disorder [36], reproductive failure in both male and female and also causes impaired growth [37]. The concentration of Mn measured in these samples varied between not detected and 12.5 mg/kg with BC1 having the highest Mn concentration. One way ANOVA revealed that there was significant difference (P=0.05) in concentrations of Mn in biscuits. The FAO/WHO [35] maximum permissible limit for Mn level in food is 500 mg/kg. The result obtained in this study is lower than the recommended limit. Iwegbue [2] reported Mn levels ranging between 0.01-2.9 mg/kg in biscuits consumed in Southern Nigeria which were far lower than the values obtained in this study. Manganese concentrations 4.64 mg/kg to 13.50 mg/kg were found in gofret wafers biscuits available in Konya markets [4]. The levels reported in this study were slightly lower than that of Harmankaya et al. [4]. The contamination of biscuit products with Mn may be as a result of processing of biscuits in containers because Mn is commonly employed in alloys and cleansing agents for steel [38].
It is known that Zinc is an essential element not only for humans, but for all organisms, Zinc plays essential roles in metabolism, growth, development and general well-being. It is also an important co-factor for a large number of metallo-enzymes. The deficiency of Zn is characterized by coronary heart diseases and various metabolic disorders. In other cases Zn deficiency is marked with alcohol intoxication, growth retardation, acidosis, hypogonadism, blockage of protein biosynthesis and mental lethargy [36,37,39]. The level of Zn in the samples ranged from 5.64-157 mg/kg. The Zn content in the brands of biscuits was slightly lower than 99 mg/kg permissible level set by FAO/WHO [35]. Statistical test of significance using one-way ANOVA showed that there was significant difference (P =0.05) in the levels of Zn in biscuits. Harmankaya et al. [4] reported concentration of Zn ranging from 0.19 mg/kg to 8.62 mg/kg in biscuits from Turkey. Also, Iwegbue [2] reported concentration levels of Zn to be between 9.06 and 49.3 mg/kg in some brands of biscuits in Nigeria. Dada et al. [40] reported the mean concentration of Zinc at 2.62 mg/kg and 2.73 mg/kg for biscuits from two tertiary institutions in Lagos, Nigeria. The concentrations of Zn in this study were far higher than the values obtained by these authors.
Copper is an important micronutrient that is essential for metabolic and biochemical processes such as bone development, haemoglobin synthesis and connective tissue metabolism [36]. Cu is an essential metal that helps the body to get rid of free radicals, make red blood cells, protect the nerve cells and prevent cell structure damage [24]. Copper deficiencies are not common, as the human body constantly supplies copper and needs very minute copper in order to perform efficiently. Conditions relating to Cu deficiency include anemia, osteoporosis, mental retardation, rheumatoid arthritis, cardiovascular disease, colon cancer and changes in skeletal system [36]. Cu poisoning in man could lead to diarrhea, nausea, liver and kidney damage [41]. Copper was not detected in any of the biscuit samples. Copper levels have been reported in biscuits, such as Dada et al. [40] detected Cu levels ranging from 0.41 to 0.44 mg/kg in Lagos, Nigeria and Iwegbue et al. [28] reported mean levels of Cu in 16 various ready-to-eat foods in Nigeria as 2.4-5.2 mg/kg. Adegbola et al. [17] also reported the mean concentration of Cu in six different brands of biscuits in Ibadan, Nigeria as 0.08–0.51 mg/ kg. However, the results obtained in this study were far lower than the level observed by the above authors.
Normally, Chromium is an important trace element needed for biosynthesis of glucose tolerance factor [36] and its biological usable form (Cr3+) potentiates insulin action. Conversely, Cr (IV) is more toxic [22]. Exposure to Cr can occur through food, it is considered an essential metal for carbohydrate and lipid metabolism. Higher concentration of Cr in the human body could be detrimental leading to skin cancer and dermatitis, defect of the kidney, stomach and respiratory tract system [19]. In this present study, the level of Cr in the confectionary (baked biscuit) products analysed spanned between not detected (ND) to 46.4 mg/kg. The highest Cr concentration was observed in BC10 while the lowest concentration of Cr was observed in BC2. The observed values were higher than the maximum permissible limit of 2.3 mg/ kg by FAO/WHO [35]. One-way ANOVA showed that there was significant difference (P=0.05) in levels of Cr in the biscuit brands. Iwegbue [2] reported the levels of Cr in different brands of biscuit ranging between 0.39 mg/kg and 0.72 mg/kg. The concentration of Cr ranged from 0.12 mg/kg to 0.25 mg/kg in six different types of biscuits sold in Ibadan, Nigeria [17]. However, the levels of Cr in this study were far higher than the detected values reported by these authors. The sources of contamination by Cr in biscuits are majorly from raw materials used, production practices and leaching of Cr from containers in which these biscuit products are preserved.
Iron is an essential mineral for life and in diets and it also plays an important role in the production of haemoglobin, oxygen and electron transfer in human body [42]. Deficiency of Fe could result to anemia, irritability, eye defect, hair loss, chronic bleeding and severe fatigue. Long term exposure to higher concentrations of Fe could lead to vomiting, diarrhea, conjunctivitis and hepatic failure [43]. Iron was found to have the highest concentration in all the biscuit samples analyzed when compared with other trace metals present in different samples. The maximum level of Fe was detected in BC2 (296 mg/kg) while the minimum level in BC8 (99.4 mg/kg). The values obtained were lower than the recommended limit of 426 mg/kg in food by FAO/WHO [35]. Oneway ANOVA indicated that there was no significant difference (P=0.05) between all the values of Fe in the biscuit samples. Iwegbue [2] reported the mean concentration of Fe (33.9-109 mg/kg) in biscuit samples to be slightly lower than the observed values in this study. Iron level ranging from 1.62 mg/kg to 26.65 mg/kg was reported for gofret wafers biscuits in Konya [4]. Adegbola et al. [17] reported Fe concentrations of 1.02-2.07 mg/ kg in selected biscuit samples in Nigeria. However, likely sources of Fe in biscuit samples could include leaching of iron from baking pans and utensils and milk used in making biscuits.
Lead forms complexes with oxo-groups in enzymes used in haemoglobin synthesis and porphyrin metabolism [44]. Lead is a toxic metal of public health concern with no known biological function and has been reported to induce toxicity at concentrations as low as 10 μg/kg [45]. Pb can bring about severe health problems particularly for infants, school children and pregnant women [46]. The minimum and maximum concentrations of Pb in the analysed samples were 3.11 mg/kg and 92.0 mg/kg, respectively. Generally, Pb is non-essential metal as such its presence in the samples suggests toxicity. The Pb contents of biscuits in this study are higher when compared to the FAO/WHO [35] safe limit of 0.3 mg/kg. The values found for Pb in this work also surpassed the United States Food and Drug Administration (USFDA) acceptable limit of 1 mg/kg for food mostly consumed by children [47]. Thus, this study showed that the concentration of Pb in these products exceeded the permissible limits for Pb in cereal products. So, the levels of Pb obtained in this present study indicate a potential health hazard to consumers. Lead toxicity is well known to cause constipation, musculo-skeletal, colic, renal, hepatic, reproductive and developmental adverse effects [48,49]. One-way ANOVA revealed that there was significant difference (P=0.05) in levels of Pb in biscuits. The concentration of Pb in biscuit products were higher than those reported in previous literature. For example, Pb levels of 0.10–0.16 mg/kg were found for biscuits from two universities in Lagos [40]. Iwegbue [2] reported Pb concentrations of 0.39–2.92 mg/kg in different types of biscuits in Nigeria. Pb concentrations of ND–0.08 mg/kg were found in selected biscuit products obtained from Ibadan market, Nigeria [17]. The major source of Pb in these biscuit samples may probably originate from contamination during production and handling. Contamination with Pb from automobile emission cannot be ruled out in biscuits.
Like Lead, Cadmium is a non-essential metal and highly toxic. It does not play any role in biological diversity in living organisms and could lead to death of cells or increase it proliferation [19]. Even at low concentration, Cd could be detrimental to living organisms [49]. Cd poisoning in man could cause anemia, renal damage, bone disorder and cancer of the lungs [50]. No concentration was detected for Cadmium in any of the biscuit samples. The Codex Committee on Food Additives and Contamination draft guideline for Cd in foods is 0.05 mg/kg [51] while FAO/WHO [36] set 0.2 mg/kg as a permissible limit for cadmium. Previous literatures on biscuit products also revealed observed values of Cd below the permissible limit. The Cd values reported are concentration in the range of 0.03–0.05 mg/kg in various brands of biscuits in Nigeria, 0.003–0.09 mg/kg in six kinds of biscuits in Nigeria [17], 0.02–0.03 mg/kg in biscuits from two Nigerian institutions [40] and 0.14-0.83 mg/kg in ready-to-eat foods from Nigeria [28]. Tegegne [52] also found cadmium at levels below the limit of detection in selected cereals from Ambo city, Ethiopia [52]. Hence, detected levels of Cd reported by these authors were higher than the levels of Cd obtained in this study.
The coefficient of variation (CV) is a simple measure of relative variability. It is the ratio of the standard deviation to the mean (average). Coefficient of variance is particularly useful for comparing variability between different measures. It can also help demonstrate when distributions are considered low-variance and when they are considered high-variance. The CV of heavy metals in the brands of biscuits ranged from ND in Cu and Cd to 188% in Pb. Mn also had high variability of 105%. This indicated dispersion of these metals from refined wheat flour which may have been contaminated from two major sources; during cultivation of the primary raw material, wheat, and during the processing of wheat flour into the final food product (biscuits). Therefore, intense effort should be focused at decreasing the epidemic of soil contamination since the soil is the major source of pollution.
However, a correlation matrix was also calculated for the heavy metals analysed in different biscuit samples for the purpose of identifying the common source of metals. The observed results showed the significant correlation between Zinc and Manganese (r=0.700) at P=0.01. Thus, only Zn was positively correlated with Mn indicating that a mutual source of these metals could occur probably through the wheat flour used [53]. On the contrary, no correlation between Cr and Fe with other metals, suggesting that contamination of Cr and Fe can be from different source than other heavy metals. The origin of contamination by Cr and Fe was probably from leaching from containers in which these products are preserved [2].
Comparison of the metal contents in biscuit samples with previous literatures
The comparison of the values observed in this present study with values obtained in reported data is displayed in Table 5. The level of Mn in this work is comparable to the concentrations reported in biscuits available in Turkey [23] and India [9]. The concentration of Zn observed in this present study higher than the other studies in India [9], Turkey [23] and Egypt [24]. The Copper level found in this study is in agreement with that of India [9]. The level of Cr observed in this study is higher than the values found in other surveys [2,9,17]. For Fe, the result found in this study quite comparable to the concentrations reported in biscuits from India [9], Turkey [23] and Nigeria [2]. However, the Pb levels observed in biscuits manufactured in Nigeria are higher than reported data observed in biscuits from other origins [9,17,24]. The Cd level observed in this work is in line with that of other values found in other literatures [9,24,25].
| Metal |
Country |
Concentration ranges (mg/kg) |
References |
| Manganese |
India |
2.05-8.25 |
[9] |
| |
Turkey |
3.0-12.4 |
[23] |
| |
Nigeria |
0.01-2.9 |
[2] |
| |
Nigeria |
ND-12.5 |
Present study |
| Zinc |
India |
ND-13.4 |
[9] |
| |
Turkey |
3.1-16.1 |
[23] |
| |
Egypt |
2.35-4.75 |
[24] |
| |
Nigeria |
5.64-157 |
Present Study |
| Copper |
India |
ND |
[9] |
| |
Turkey |
<1-4.2 |
[23] |
| |
Egypt |
0.79-1.39 |
[24] |
| |
Nigeria |
ND |
Present study |
| Chromium |
India |
ND-1.6 |
[9] |
| |
Nigeria |
0.39-0.72 |
[2] |
| |
Nigeria |
0.12-0.25 |
[17] |
| |
Nigeria |
ND-46.4 |
Present study |
| Iron |
India |
ND-36.3 |
[9] |
| |
Turkey |
6.9-35.4 |
[23] |
| |
Nigeria |
33.9-109 |
[2] |
| |
Nigeria |
99.4-296 |
Present study |
| Lead |
India |
ND-0.13 |
[9] |
| |
Egypt |
0.126-0.127 |
[24] |
| |
Nigeria |
ND-0.08 |
[17] |
| |
Nigeria |
3.11-92.0 |
Present study |
| Cadmium |
India |
ND |
[9] |
| |
Egypt |
0.013-0.122 |
[24] |
| |
Greece |
0.0126 – 0.0143 |
[25] |
| |
Nigeria |
ND |
Present study |
Table 5: Comparison of concentrations of metals in biscuit samples (mg/kg) reported from different countries.
Estimated daily intake (EDI)
The estimated daily intake of selected metals from consumption of 40 g of various brands of biscuits per day for infants, school children and adult is presented in Table 6.
| Biscuit sample |
Category |
Mn |
Zn |
Cu |
Cr |
Fe |
Pb |
Cd |
| BC1 |
In |
33.3 |
418 |
0.00 |
101 |
326 |
10.1 |
0.00 |
| SC |
14.3 |
179 |
0.00 |
43.2 |
140 |
4.32 |
0.00 |
| Ad |
8.33 |
105 |
0.00 |
25.2 |
81.4 |
2.52 |
0.00 |
| BC2 |
In |
8.13 |
214 |
0.00 |
0.00 |
790 |
10.7 |
0.00 |
| SC |
3.49 |
91.5 |
0.00 |
0.00 |
339 |
4.57 |
0.00 |
| Ad |
2.03 |
53.4 |
0.00 |
0.00 |
198 |
2.67 |
0.00 |
| BC3 |
In |
9.07 |
137 |
0.00 |
80.3 |
501 |
245 |
0.00 |
| SC |
3.89 |
58.5 |
0.00 |
34.4 |
215 |
105 |
0.00 |
| Ad |
2.27 |
34.1 |
0.00 |
20.1 |
125 |
61.3 |
0.00 |
| BC4 |
In |
15.2 |
46.4 |
0.00 |
51.2 |
649 |
214 |
0.00 |
| SC |
6.53 |
19.9 |
0.00 |
21.9 |
278 |
91.8 |
0.00 |
| Ad |
3.81 |
11.6 |
0.00 |
12.8 |
162 |
53.5 |
0.00 |
| BC5 |
In |
4.80 |
74.4 |
0.00 |
29.9 |
418 |
10.5 |
0.00 |
| SC |
2.06 |
31.9 |
0.00 |
12.8 |
179 |
4.49 |
0.00 |
| Ad |
1.20 |
18.6 |
0.00 |
7.47 |
104 |
2.62 |
0.00 |
| BC6 |
In |
5.04 |
84.8 |
0.00 |
31.2 |
382 |
23.4 |
0.00 |
| SC |
2.16 |
36.3 |
0.00 |
13.4 |
164 |
10.0 |
0.00 |
| Ad |
1.26 |
21.2 |
0.00 |
7.80 |
95.4 |
5.85 |
0.00 |
| BC7 |
In |
31.5 |
361 |
0.00 |
62.1 |
394 |
16.9 |
0.00 |
| SC |
13.5 |
155 |
0.00 |
26.6 |
169 |
7.26 |
0.00 |
| Ad |
7.87 |
90.1 |
0.00 |
15.5 |
98.5 |
4.23 |
0.00 |
| BC8 |
In |
0.00 |
68.8 |
0.00 |
60.3 |
265 |
16.0 |
0.00 |
| SC |
0.00 |
29.5 |
0.00 |
25.8 |
114 |
6.85 |
0.00 |
| Ad |
0.00 |
17.2 |
0.00 |
15.1 |
66.3 |
3.99 |
0.00 |
| BC9 |
In |
0.00 |
15.0 |
0.00 |
103 |
453.60 |
8.29 |
0.00 |
| SC |
0.00 |
6.45 |
0.00 |
44.0 |
194.40 |
3.55 |
0.00 |
| Ad |
0.00 |
3.76 |
0.00 |
25.7 |
113.4 |
2.07 |
0.00 |
| BC10 |
In |
15.4 |
182 |
0.00 |
124 |
392.53 |
9.41 |
0.00 |
| SC |
6.62 |
78.1 |
0.00 |
53.0 |
168.23 |
4.03 |
0.00 |
| Ad |
3.86 |
45.5 |
0.00 |
30.9 |
65.42 |
2.35 |
0.00 |
In: Infant
SC: School child
Ad: Adult
Table 6: Estimated Daily Intake of Metals (μg/kg bw/day) based on Consumption of 40 g of Biscuits for Infants (15 kg), School Children (35 kg) and Adults (60 kg).
The National Research Council of Canada (NRC) endorsed safe and tolerable daily intake levels of Mn that ranged from 0.3–1 mg/day for children up to 1 year old, 1-2 mg/day for children up to 3-10 years old, 2-5 mg/day for children older than 10 [54] and 2–11 mg/day for adults from 19 to 70 years [55]. The estimated daily intakes of manganese for an infant, school child and adult were 0.00–33.3 μg/kg/bw/day, 0.00–14.3 μg/kg/bw/day and 0.00 –8.33 μg/kg/bw/day, respectively. The values are lower than the daily requirement of 33.3-83.3 μg/kg/bw/day [11]. Daily intake of little amounts of Mn is required for proper development and good health in humans else a diet deficient in Mn could cause poor growth, impaired reproduction and serious nervous system problems [19,39].
A daily intake of Zn is vital to keep a stable condition since the body has no particular Zn accumulation system. Zn also reduces the toxicity of cadmium and copper, but its deficiency or extremely high levels may develop vulnerability to carcinogenesis [56]. The recommended daily intake by Institute of Medicine [54], National Research Council of Canada [57], WHO Provisional Maximal Tolerable Daily Intake (PMTDI) [58] and Joint Expert Committee on Food Additives (JECFA) PMTDI for Zn is set at 40,000 μg/day for adults within the ages of 19-70, 12,000 μg/day, 0.3 mg/kg/ bw/day and 1000 μg/kg//bw/day respectively. In this present study, the estimated dietary intake of Zn were in the ranges of 15.0–418 μg/kg/bw/day for an infant, 6.45 – 179 μg/kg/bw/day for a school child and 3.76–105 μg/kg/bw/day. These EDI of Zn values for all categories were far lower than the recommended daily intake. Similarly, values obtained from this study were relative to values reported by Iwegbue [2] on the estimated daily intake of Zn from ingestion of biscuits ranging from 58.0- 131 μg/kg/bw/day on different brands of biscuits. The Zn values of this study were higher than the findings of previous work on consumable food items [19,28].
The presence of Chromium in the diet is of great significance owing to its active influence in lipid metabolism and insulin function. The EDIs for chromium in this study spanned between 0.00 and 124 μg/kg/bw/day for an infant, while that of a school child and an adult that consumed the same quantity of biscuits per day ranged from 0.00 to 53.0 μg/kg/bw/day and 0.00 to 30.9 μg/kg/bw/day respectively. The Expert Group on Vitamins and Minerals (EVM) safe upper level for trivalent chromium is 150 μg/kg/bw/day [59] whereas Joint FAO/WHO Expert Committee of Food Additives (JECFA) recommended daily intake of Cr is 200 μg/day [60]. The EDIs for Cr for the case of an infant were below the recommended daily intake value but the upper level of EDI for Cr for the case of an infant constituted 82% for EVM guidance level and 62 % for JECFA recommended limit.
Iron dietary daily intake of different brands of biscuits ranged from 65.4–790 μg/kg/bw/day for all scenarios. The results obtained were below the recommended tolerable daily intake value of 12,500 μg/day by National Research Council [57], upper tolerable intake of 40 mg/day (for children between 0 months–8 years) and 45 mg/kg (for adults between 14-70 years) [55] and recommended dietary allowance of 10-19 mg/day/person by WHO [28]. The estimated intake of Fe from consumption of biscuits constituted up to 0.5-6% of the recommended tolerable daily value.
Pb is not needed by the human body and can cause severe health problems particularly for infants, children and pregnant women. It affects the behaviors of children and also impairs performance in IQ tests [46]. The estimated daily intakes of Pb in this study ranged from 8.29 to 245 μg/kg/bw/day for infant scenario, 3.55 to 105 μg/kg/bw/day for school children scenario and 2.07 to 61.3 μg/kg/bw/day for an adult scenario. The values for the case of adult were below WHO tolerable daily intake of 240 μg/day for adults with body weight of 68 kg [61]. The values in this study for all categories were higher than JECFA Provisional Tolerable Weekly Intake (PTWI) of lead set at 25 μg/kg/bw for children which is equivalent to 3.6 μg/kg/bw/day, however, this value has been retracted in 2011 by combined FAO/WHO committee since it could no longer be considered health protective [58]. BC3, BC4, BC6, BC7 and BC8 have intake for adult surpassing the JECFA PTDI. Proper care should be adopted in the consumption of these biscuit samples as they could pose serious health risk in the future. The upper and lower limit of estimated daily intake in the case of an infant exceeded the provisional tolerable intakes of lead. Assuming 40 % absorption rate for Pb by consuming 40 g of any biscuit types with a lead content of 3.11 to 92.0 mg/kg, an infant weighing 15 kg at age 6 would be attaining approximately 92–2726% of his or her PTDI from this source.
Estimated target hazard quotient (THQ)
The estimated target hazard quotients of selected trace metals through the consumption of 40 g of biscuits for infants, school children and adults in Nigeria is displayed in Table 7. It must be known that the THQ values does not offer a quantitative evaluation of the possibility of an exposed population facing a reverse health effects, but rather they function as a suggestion of the risk level due to metal exposure. The analysis of THQ is binary, that is, THQ is either>1 or <1 implying that there is a reason for health concern. However, THQ values are additive not multiplicative, for instance, the level of concern at THQ of 20 is greater but not tenfold as those of THQ of 2 [62]. Due to the probability power of metals to be synergists, each THQ values for the trace metals of individual sample was added together to yield the Total Target Hazard Quotient (ΣTHQ) which can also be interpreted in the same way like the THQ [19,28]. Heavy metals such as Zn in BC1 and BC7, Cr in all samples except BC2, Fe in BC2 and Pb in all samples had THQ>1 for infants while Cr in all samples apart from BC2 and Pb in all samples apart from BC9 had THQ>1 for school children and Cr in all samples and Pb in BC3, BC4, BC6, and BC7 for adults had THQ>1 signifying potential for serious health concern for these metals. The THQ of Mn, Zn and Fe were <1 for adults and school children apart from some occurrences in infants’ intake. Chromium in most of the brands of biscuits had THQ>1. For all categories, Mn had THQ<1 in all samples while Cr had THQ>1 in most samples. The values of THQ among the different level were in the order: adults<school children<infants. Iwegbue et al. reported the same order of children>adults in health risk assessment of sweets, chewing gums and peppermints. The individual THQ values for metals for all scenarios follow the order: Cr>Pb>Fe>Zn>Mn>Cu=Cd.
| Biscuit sample |
Category |
Mn |
Zn |
Cu |
Cr |
Fe |
Pb |
Cd |
ÃÆÃââââ¬Ã ÃÆââ¬Å¡ÃâéTHQ |
| BC1 |
In |
0.238 |
1.40 |
0.000 |
33.6 |
0.465 |
2.52 |
0.000 |
38.2 |
| |
SC |
0.102 |
0.598 |
0.000 |
14.4 |
0.199 |
1.08 |
0.000 |
16.4 |
| |
Ad |
0.060 |
0.349 |
0.000 |
8.40 |
0.116 |
0.630 |
0.000 |
9.56 |
| BC2 |
In |
0.058 |
0.712 |
0.000 |
0.000 |
1.13 |
2.67 |
0.000 |
4.57 |
| |
SC |
0.025 |
0.305 |
0.000 |
0.000 |
0.484 |
1.14 |
0.000 |
1.96 |
| |
Ad |
0.015 |
0.178 |
0.000 |
0.000 |
0.282 |
0.667 |
0.000 |
1.14 |
| BC3 |
In |
0.065 |
0.455 |
0.000 |
26.8 |
0.715 |
61.3 |
0.000 |
89.3 |
| |
SC |
0.028 |
0.195 |
0.000 |
11.5 |
0.306 |
26.3 |
0.000 |
38.3 |
| |
Ad |
0.016 |
0.114 |
0.000 |
6.69 |
0.179 |
15.3 |
0.000 |
22.3 |
| BC4 |
In |
0.109 |
0.155 |
0.000 |
17.1 |
0.927 |
53.5 |
0.000 |
71.8 |
| |
SC |
0.047 |
0.066 |
0.000 |
7.31 |
0.397 |
22.9 |
0.000 |
30.8 |
| |
Ad |
0.027 |
0.039 |
0.000 |
4.27 |
0.232 |
13.4 |
0.000 |
18.0 |
| BC5 |
In |
0.034 |
0.248 |
0.000 |
9.96 |
0.597 |
2.62 |
0.000 |
13.5 |
| |
SC |
0.015 |
0.106 |
0.000 |
4.27 |
0.256 |
1.12 |
0.000 |
5.77 |
| |
Ad |
0.009 |
0.062 |
0.000 |
2.49 |
0.149 |
0.655 |
0.000 |
3.36 |
| BC6 |
In |
0.036 |
0.283 |
0.000 |
10.4 |
0.545 |
5.85 |
0.000 |
17.1 |
| |
SC |
0.015 |
0.121 |
0.000 |
4.46 |
0.234 |
2.51 |
0.000 |
7.34 |
| |
Ad |
0.009 |
0.071 |
0.000 |
2.60 |
0.136 |
1.46 |
0.000 |
4.28 |
| BC7 |
In |
0.225 |
1.20 |
0.000 |
20.7 |
0.563 |
4.23 |
0.000 |
26.9 |
| |
SC |
0.096 |
0.515 |
0.000 |
8.88 |
0.241 |
1.81 |
0.000 |
11.5 |
| |
Ad |
0.056 |
0.300 |
0.000 |
5.18 |
0.141 |
1.06 |
0.000 |
6.73 |
| BC8 |
In |
0.000 |
0.229 |
0.000 |
20.1 |
0.379 |
3.99 |
0.000 |
24.7 |
| |
SC |
0.000 |
0.098 |
0.000 |
8.61 |
0.162 |
1.71 |
0.000 |
10.6 |
| |
Ad |
0.000 |
0.057 |
0.000 |
5.18 |
0.141 |
1.06 |
0.000 |
6.43 |
| BC9 |
In |
0.000 |
0.050 |
0.000 |
34.2 |
0.648 |
2.07 |
0.000 |
37.0 |
| |
SC |
0.000 |
0.021 |
0.000 |
14.7 |
0.278 |
0.889 |
0.000 |
15.9 |
| |
Ad |
0.000 |
0.013 |
0.000 |
8.56 |
0.162 |
0.518 |
0.000 |
9.25 |
| BC10 |
In |
0.110 |
0.607 |
0.000 |
41.2 |
0.561 |
2.35 |
0.000 |
44.9 |
| |
SC |
0.047 |
0.260 |
0.000 |
17.7 |
0.240 |
1.01 |
0.000 |
19.2 |
| |
Ad |
0.028 |
0.152 |
0.000 |
10.3 |
0.140 |
0.588 |
0.000 |
11.2 |
In: Infant
SC: School child
Ad: Adult
Table 7: Estimated Target Hazard Quotients (THQ) of Heavy Metals from the Consumption of 40 g of Biscuits for Infants, School Children and Adults.
The combined metal ΣTHQ values were generally high implicating a reason for health concern for all categories in consideration. The pooled THQ values of analysed metals for biscuit brands for all scenarios ranged from 1.14 to 89.3 as seen in Figure 1. Lead and Chromium had greater effects on the ΣTHQ values than other metals while Mn, Zn and Fe showed minimal effects and Cu and Cd had no feasible effects. Cadmium, Nickel and Cobalt were reported to be the main contributors for ΣTHQ values greater than 1 [30]. In this study, the major risk contributor was Cr with 58%, followed by Pb (38.3%), Fe (1.77%), Zn (1.45%), and Mn (0.24%). Furthermore, BC2 has the lowest chances of cancer risk amongst all the samples, for both Pb and Cr.
Figure 1: ΣTHQ from the Consumption of 40 g of Biscuits for Infants, School Children and Adults.
Incremental lifetime carcinogenic risk (ILCR)
The computed values for ILCR and summation of Incremental Lifetime Cancer Risk (ΣILCR) for both Pb and Cr due to the exposure from the ingestion of 40 g of biscuits are presented in Table 8. Most metals particularly Pb are classified as carcinogenic agents. Although Cr is less carcinogenic than Pb, the incremental lifetime cancer risk was calculated. Chronic exposure to low amounts of Pb could result into several kinds of cancers [63]. USEPA recommended the permissible level for cancer risk to be lower than or about 1 chance in 1,000,000 lifetime exposure (ILCR<10-6) and this value is sometimes considered negligible. Threshold risk limit (ILCR>10-4) for a chance of cancer is higher than 1 in 10,000 exposures where corrective methods can be applied. However, values of ILCR lying between 10-6 and 10-4 are considered as acceptable range. Moderate risk level (ILCR>10-3) and (ILCR>10-2) that is above 1 in 1,000 and 1 in 100 respectively are considered unacceptable and the health safety of the public is of concern. In this present study, the values of ILCR for Cr breached the acceptable range of (>10-4) in all studied samples of biscuits with a range of 4.0 × 10⁻³ to 6.2 × 10⁻² for all whereas the ILCR values for Pb were between 10-6 and 10-4 having a range between 2.1 × 10⁻⁵ and 208.5 × 10⁻⁵. However the values for Pb for all categories and in all samples are considered acceptable. Therefore, the consumption of biscuits is less risky in this study and less vulnerable to cancer risk. Moreover Cr is less carcinogenic and the values obtained in this study for the consumption of biscuits are of less concern to the general population. Finally, the cumulative cancer risk (ΣILCR) of all biscuit samples studied exceeded the recommended threshold risk limit (>10-4) by 15% (BC1), 0% (BC2), 13% (BC3), 9% (BC4), 5% (BC5), 5% (BC6), 9% (BC7), 9% (BC8), 16% (BC9) and 10% (BC10).
| Biscuit Sample |
Category |
Mn |
Zn |
Cu |
Cr |
Fe |
Pb |
Cd |
ÃÆÃââââ¬Ã ÃÆââ¬Å¡ÃâéILCR |
| BC1 |
In |
- |
- |
- |
0.050 |
- |
8.6 × 10⁻⁵ |
- |
5.0× 10⁻² |
| |
SC |
- |
- |
- |
0.021 |
- |
3.7 × 10⁻⁵ |
- |
2.1 × 10⁻² |
| |
Ad |
- |
- |
- |
0.013 |
- |
2.1 × 10⁻⁵ |
- |
1.3 × 10⁻⁵ |
| BC2 |
In |
- |
- |
- |
- |
- |
9.1 × 10⁻⁵ |
- |
9.1 × 10⁻⁵ |
| |
SC |
- |
- |
- |
- |
- |
3.9 × 10⁻⁵ |
- |
3.9 × 10⁻⁵ |
| |
Ad |
- |
- |
- |
- |
- |
2.3 × 10⁻⁵ |
- |
2.3 × 10⁻⁵ |
| BC3 |
In |
- |
- |
- |
0.040 |
- |
209 × 10-5 |
- |
4.2 × 10⁻² |
| |
SC |
- |
- |
- |
0.017 |
- |
89.4 × 10⁻⁵ |
- |
1.8 × 10⁻² |
| |
Ad |
- |
- |
- |
0.010 |
- |
52.1 × 10⁻⁵ |
- |
1.0 × 10⁻² |
| BC4 |
In |
- |
- |
- |
0.026 |
- |
182 × 10-5 |
- |
2.8 × 10⁻² |
| |
SC |
- |
- |
- |
0.011 |
- |
78.0 × 10⁻⁵ |
- |
1.2 × 10⁻² |
| |
Ad |
- |
- |
- |
0.006 |
- |
45.5 × 10⁻⁵ |
- |
6.5 × 10⁻³ |
| BC5 |
In |
- |
- |
- |
0.015 |
- |
8.9 × 10⁻⁵ |
- |
1.5 × 10⁻² |
| |
SC |
- |
- |
- |
0.006 |
- |
3.8 × 10⁻⁵ |
- |
6.0 × 10⁻³ |
| |
Ad |
- |
- |
- |
0.004 |
- |
2.2 × 10⁻⁵ |
- |
4.0 × 10⁻³ |
| BC6 |
In |
- |
- |
- |
0.016 |
- |
19.9 × 10⁻⁵ |
- |
1.6 × 10⁻² |
| |
SC |
- |
- |
- |
0.007 |
- |
8.5 × 10⁻⁵ |
- |
7.1 × 10⁻³ |
| |
Ad |
- |
- |
- |
0.004 |
- |
5.0 × 10⁻⁵ |
- |
4.1 × 10⁻³ |
| BC7 |
In |
- |
- |
- |
0.031 |
- |
14.4 × 10⁻⁵ |
- |
3.1 × 10⁻² |
| |
SC |
- |
- |
- |
0.013 |
- |
6.2 × 10⁻⁵ |
- |
1.3 × 10⁻² |
| |
Ad |
- |
- |
- |
0.008 |
- |
3.6 × 10⁻⁵ |
- |
8.0 × 10⁻³ |
| BC8 |
In |
- |
- |
- |
0.030 |
- |
13.6 × 10⁻⁵ |
- |
3.0 × 10⁻² |
| |
SC |
- |
- |
- |
0.013 |
- |
5.8 × 10⁻⁵ |
- |
1.3 × 10⁻² |
| |
Ad |
- |
- |
- |
0.008 |
- |
3.4 × 10⁻⁵ |
- |
8.0 × 10⁻³ |
| BC9 |
In |
- |
- |
- |
0.051 |
- |
7.0 × 10⁻⁵ |
- |
5.1 × 10⁻² |
| |
SC |
- |
- |
- |
0.022 |
- |
3.0 × 10⁻⁵ |
- |
2.2 × 10⁻² |
| |
Ad |
- |
- |
- |
0.013 |
- |
1.8 × 10⁻⁵ |
- |
1.3 × 10⁻² |
| BC10 |
In |
- |
- |
- |
0.062 |
- |
8.0 × 10⁻⁵ |
- |
6.2 × 10⁻² |
| |
SC |
- |
- |
- |
0.027 |
- |
3.4 × 10⁻⁵ |
- |
2.7 × 10⁻² |
| |
Ad |
- |
- |
- |
0.015 |
- |
2.0 × 10⁻⁵ |
- |
1.5 × 10⁻² |
In: Infant
SC: School child
Ad: Adult
Table 8: Carcinogenic Risk of Heavy Metals in Selected Biscuit Brands for Infants, School Children and Adults.
Conclusions
The concentrations of heavy metals in various biscuit brands were mostly high with Cr and Pb at concentrations higher than their permissible limits in cereal based food products. However, there is need for caution in intakes of these metals since Cr at elevated levels can lead to hyperglycemia while overexposure to Pb can result in reduction of children’s IQ and could also cause reproductive problems. Cu and Cd were not detected in the biscuit brands. All other metals present in the biscuit samples were at concentrations below the permissible limit. The Estimated Daily Intake values showed that the intakes of metals from the ingestion of these products were within their provisional tolerable daily intake limits for the toxic metals and recommended daily intake values for the essential metals. The intakes of beneficial metals such as Zn and Fe from the ingestion of these products were low and contribute quite significantly to the dietary requirement of Zn and Fe. The results of this present study suggest that BC2, BC3 and BC4 are more contaminated with heavy metals than any other brands studied; therefore people who consume these biscuit items in preference to other brands are more exposed to higher levels of metals. This however, indicates that excessive consumption of these products could result in high concentration of metals; therefore parents should guide their wards by controlling their consumption of these food products. The estimated THQ values for metals from consumption of these brands of biscuits were generally high indicating potential health concern for infants, school children and adults who consume these products on a regular and daily basis. It is possible that the contamination of these food items may have originated from the raw materials like flour which may been contaminated through improper handling, leaching from baking pans, contamination during processing and could also arise from automobile emissions, poor packaging and storage conditions. However, this demands for the urgent need to safeguard and impose strict quality control techniques during the process of production to decrease the concentration of toxic metals to acceptable levels in all food production.
Conflict of Interest
The authors declare that there are no conflicts of interest.
Data Availability
The data used to support the findings of this study are included within the article.
References
- Orecchio S, Papuzza V (2009) Levels, fingerprint and daily intake of polycyclic aromatic hydrocarbons (PAHs) in bread baked using wood as fuel. J Hazard Mater 164: 876-883.
- Iwegbue CMA (2012) Metal contents in some brands of biscuits consumed in southern Nigeria. Am J Food Technol 7: 160-167.
- USDA (United States Department for Agriculture Foreign Agricultural Service) (2009) Gain Report No. N19010, 10/2/2009.
- Harmankaya M, Özcan MM, Duman E, Dursun N (2012) Mineral and heavy metal contents of ice-cream wafer, biscuit and gofret wafers. J Agroaliment Proc Technol 18: 259-265.
- Sodhi GS (2006) Fundamental concepts of environmental chemistry, 2nd Edn, New Delhi: Narosa Publishing House, Pp: 332-351.
- Hamilton EI (1979) The chemical elements and man: measurements, perspectives, applications (No. 1021). Charles C. Thomas Publisher, Springfield, U.S.A, 95-467.
- Onianwa PC, Adetola IG, Iwegbue CMA, Ojo MF, Tella OO (1999) Trace heavy metals composition of some Nigerian beverages and food drinks. Food Chem 66: 275-279.
- Iwegbue CMA (2010) Composition and daily intakes of some trace metals from canned beers in Nigeria. J I Brewing 116: 312-315.
- Gopalani M, Shahare M, Ramteke DS, Wate SR (2007) Heavy metal content of potato chips and biscuits from Nagpur city, India. Bull Environ Contam Toxicol 79: 384-387.
- Nielsen FH (1990) New Essential Trace Elements for the Life Sciences. Biol Trace Elem Res 26-27: 599-611.
- WHO (World Health Organization) (1996) Trace elements in human health and nutrition. Chapter 3: Trace element bioavailability and interactions. Geneva, Pp: 23-41.
- Suppin D, Zahlbruckner R, Krapfenbauer-Cermak CH, Hassan-Hauser CH, Smulders FJM (2005) Mercury, lead and cadmium content of fresh and canned fish collected from Austrian retail operations. Nutr 29: 456-460.
- Ogunfowokan AO, Morakinyo MK, Agboola OS, Durosinmi LM (2005) Levels of lead and cadmium in some Nigerian confection wrappers. J Appl Sci 5: 1032-1035.
- FSAI (Food Safety Authority of Ireland) (2009) Mercury, Lead, Cadmium, Tin and Arsenic in Food. Toxicol Factsheet Series 1: 1-13.
- EC (European Commission) (2006) Commission Regulation (EC) No 1881/2006 of 19 December 2006 setting maximum levels for certain contaminants in foodstuffs.J Euro Uni 364: 5-24.
- Ashraf W (2006) Levels of selected heavy metals in tuna fish. Arab J Sci Eng 31: 89-92.
- Adegbola RA, Adekanmbi AI, Abiona DL, AtereAA (2015) Evaluation of some heavy metal contaminants in biscuits, fruit drinks, concentrates, candy, milk products and carbonated drinks sold in Ibadan, Nigeria. Int J Biol Chem Sci 9: 1691-1696.
- Ajai AI, Ochigbo SS, Abdullahi Z, Anigboro PI (2014) Determination of trace metals and essential minerals in selected fruit juices in Minna, Nigeria. Int J Food Sci 2014: 1-5.
- Iwegbue CM, Bassey FI, Tesi GO, Overah LC, Onyeloni SO, et al. (2015) Concentrations and health risk assessment of metals in chewing gums, peppermints and sweets in Nigeria. J Food Meas Charact 9: 160-174.
- Bradley EL, Castle L, Dines TJ, Fitzgerald AG, Gonzalez TP, et al. (2005) Test method for measuring non-visible set-off from inks and lacquers on the food-contact surface of printed packaging materials. Food Addit Contam 22: 490-502.
- Soliman K, Zikovsky L (1999) Determination of Br, Ca, Cl, Co, Cu, I, K, Mg, Mn, Na, Rb, S, Ti and V in cereals, oils, sweeteners and vegetables sold in Canada by neutron activation analysis. J Food Compos Anal 12: 85-89.
- Iwegbue CMA (2011) Concentrations of selected metals in candies and chocolates consumed in southern Nigeria. Food Addit Contam Part B Surveill 4: 22-27.
- Saracoglu S, Tuzen M, Mendil D, Soylak M, Elci L, et al. (2004) Heavy metal content of hard biscuits produced in Turkey. Bull Environ Contam Toxicol 73: 264-269.
- Salama AK, Radwan MA (2005) Heavy metals (Cd, Pb) and trace elements (Cu, Zn) contents in some foodstuffs from the Egyptian market. Emir J Food Agr 17: 34-42.
- Karavoltsos S, Sakellari A, Dimopoulos M, Dasenakis M, Scoullos M (2002) Cadmium content in foodstuffs from the Greek market. Food Addit Contam 19: 954-962.
- Aigberua AO, Izah SC, Isaac UI (2018) Level and health risk assessment of heavy metals in selected seasonings and culinary condiments used in Nigeria. Biol Evid 8: 6-20.
- Kigigha LT, Ebieto LO, Izah SC (2017) Health risk assessment of heavy metal in smoked Trachurus trachurus sold in Yenagoa, Bayelsa state, Nigeria. Int J Healthc Med Sci 3: 62-69.
- Iwegbue CM, Nwozo SO, Overah CL, Bassey FI, Nwajei GE (2013) Concentrations of selected metals in some ready-to-eat-foods consumed in southern Nigeria: estimation of Dietary intakes and target hazard quotients. Turk J Agri Food Sci Technol 1: 1-7.
- Udowelle NA, Igweze ZN, Asomugha RN, Orisakwe OE (2017) Health risk assessment and dietary exposure of polycyclic aromatic hydrocarbons (PAHs), lead and cadmium from bread consumed in Nigeria. Rocz Panstw Zakl Hig 68: 269-280.
- Ullah H, Noreen S, Rehman A, Waseem A, Zubair S, et al. (2017) Comparative study of heavy metals content in cosmetic products of different countries marketed in KhyberPakhtunkhwa, Pakistan. Arab J Chem 10: 10-18.
- Naughton DP, Petroczi A (2008) Heavy metal ions in wines: meta-analysis of target hazard quotient reveals health risk. Chem Cent J 2: 22.
- Hallenbeck WH (1993) Quantitative Risk Assessment for Environmental and Occupational Health, Lewis, Chelsea, Lewis Publishers. Pp: 121-130.
- Bamuwamye M, Ogwok P, Tumuhairwe V (2015) Cancer and non-cancer risks associated with heavy metal exposures from street foods: Evaluation of roasted meats in an urban setting. J Environ Pollut Hum Health 3: 24-30.
- Liu X, Song Q, Tang Y, Li W, Xu J, et al. (2013) Human health risk assessment of heavy metals in soil–vegetable system: a multi-medium analysis. Sci Total Environ 463: 530-540.
- FAO/WHO, Codex Alimentarius Commission (2001) Food additives and contaminants. Joint FAO/WHO Food Standards Programme, & World Health Organization. Codex Alimentarius: General requirements (food hygiene). ALINORM 01/12A: 1-289.
- Prashanth L, Kattapagari KK, Chitturi RT, Baddam VRR, Prasad LK (2015) A review on role of essential trace elements in health and disease. J Dr NTR Univ Health Sci 4: 75-85.
- Saraf A, Samant A (2013) Evaluation of some minerals and trace elements in Achyranthes aspera Linn. Int J Pharm Sci 3: 229-233.
- Duran A, Tuzen M, Soylak M (2009) Trace metal contents in chewing gums and candies marketed in Turkey. Environ Monit Assess 149: 283-289.
- Oyekunle JAO, Adekunle AS, Ogunfowokan AO, Olutona GO, Omolere OB (2014) Bromate and trace metal levels in bread loaves from outlets within Ile-Ife Metropolis, Southwestern Nigeria. Toxicol Rep 1: 224-230.
- Dada EO, Ojo ON, Njoku KL, Akinola MO (2017) Assessing the levels of Pb, Cd, Zn and Cu in biscuits and home-made snacks obtained from vendors in two tertiary institutions in Lagos, Nigeria. J Appl Sci Environ Manag 21: 521-524.
- Turnlund JR (1998) Human whole-body copper metabolism. Am J Clin Nutr 67: 960S-964S.
- Kalagbor IA, Barisere V, Barivule G, Barile S, Bassey C (2014) Investigation of the presence of some heavy metals in four edible vegetables, bitter Leaf (Vernonia amygdalina), scent Leaf (Ocimum gratissimum), water leaf (Talinum triangulare) and fluted pumpkin (Telfairia occidentalis) from a cottage farm in Port Harcourt. Res J Environ Earth Sci 6: 18-24.
- Ikem A, Egiebor NO (2005) Assessment of trace elements in canned fishes (mackerel, tuna, salmon, sardines and herrings) marketed in Georgia and Alabama (United States of America). J Food Compos Anal 18: 771-787.
- Ademoroti CMA (1996) Environmental Chemistry & Toxicology, 1st Edn. Ibadan: Foludex Press Ltd., p. 171.
- WHO/FAO (World Health Organization/Food and Agriculture Organization) (2009) Corporate document repository plants as storage pesticides.
- Olutona GO, Aribisala OG, Akintunde EA, Obimakinde SO (2012) Chemical Speciation and Distribution of Trace Metals in Roadside Soil from Major Roads in Iwo, a Semi-Urban City, South Western Nigeria. Terr Aquat Environ Toxicol 6: 116-126.
- US FDA (United States Food and Drugs Authorities) (2006) Guidance for Industry Lead in candy likely to be consumed frequently by small children: Recommended maximum level and enforcement policy. Centre for Food Safety and Applied Nutrition (CFSAN), Office of Plant and Foods, https://www.csfan.fda.gov/dms/pbguid3.html. Accessed 5 July 2018.
- Uluozlu OD, Kinalioglu K, Tuzen M, Soylak M (2007) Trace metal levels in lichen samples from roadsides in East Black Sea region, Turkey. Biomed Environ Sci 20: 203.
- Ambedkar G, Muniyan M (2012) Analysis of heavy metals in water, sediments and selected freshwater fish collected from Gadilam river, Tamilnadu, India. Int J Toxicol Appl Pharmacol 2: 25-30.
- Edward JB, Idowu EO, Oso JA, Ibidapo OR (2013) Determination of heavy metal concentration in fish samples, sediment and water from Odo-Ayo River in Ado-Ekiti, Ekiti-State, Nigeria. Int J Environ Monit Assess 1: 27-33.
- CCFAC (Codex Committee of Food Additives and Contaminants) (2001) Comments submitted on draft maximum levels for lead and cadmium. Agenda 16 c/16d, Joint FAO/WHO Food Standards Programme, thirty-third sessions, 12–16 March, 2001, The Hague, The Netherlands.
- Tegegne WA (2015) Assessment of some heavy metals concentration in selected cereals collected from local markets of Ambo City, Ethiopia. J Cereals Oilseeds 6: 8-13.
- Tejera RL, Luis G, González-Weller D, Caballero JM, Gutiérrez ÁJ, et al. (2013) Metals in wheat flour; comparative study and safety control. Nutr Hosp 28: 506-513.
- Institute of Medicine (2001) Food and Nutrition Board. Dietary Reference Intakes for Vitamin A, Vitamin K, Arsenic, Boron, Chromium, Copper, Iodine, Iron, Manganese, Molybdenum, Nickel, Silicon, Vanadium and Zinc. Washington, DC: The National Academies Press.
- Institute of Medicine (2003) Dietary Reference Intakes: applications in Dietary Planning. Subcommittee on Interpretation and Uses of Dietary Reference Intakes and the Standing Committee on the Scientific Evaluation of Dietary Reference Intakes. Washington, DC: The National Academies Press, 248.
- Florence TM, Batley GE (1980) Scheme for classification of heavy metal species in natural waters. Reply to comments. Anal Chem 52: 1962-1963.
- NRC (National Research Council) (1989) Recommended dietary allowance, 10th edition. National Academy Press, Washington.
- WHO (World Health Organization) (2017) Evaluations of the Joint FAO/WHO Expert Committee on Food Additives, https://apps.who.int/food-additives-contaminants-jecfa-database/search.aspx?fcc=2, Accessed January 23rd 2018.
- EVM (Export Group on Vitamins and Minerals) (2003) Safe upper levels for vitamins and minerals of the Export Group on Vitamins and Minerals. Food Standard Agency.
- WHO (World Health Organisation) (2013) Summary and conclusion of the 61st meeting of the Joint FAO/WHO Expert Committee on Food Additives (JECFA) JECFA/Sc Rome. Italy 10-19 June, 2013.
- García-Rico L, Leyva-Perez J, Jara-Marini ME (2007) Content and daily intake of copper, zinc, lead, cadmium, and mercury from dietary supplements in Mexico. Food Chem Toxicol 45: 1599-1605.
- Hague T, Petroczi A, Andrews PL, Barker J, Naughton DP (2008) Determination of metal ion content of beverages and estimation of target hazard quotients: a comparative study. Chem Cent J 2: 13.
- Järup L (2003) Hazards of heavy metal contamination. Br Med Bull 68: 167-182.