Keywords
Faster R-CNN; CubeSats Detection; Attitude Estimation
Introduction
Since 1960, there have been numerous launches of different types
of satellites (Sats) aiming at studying different disciplines, mainly
focusing on engineering applications and atmospheric chemistry
[1]. The Aerospace Corporation is one of the major industries
that constructed and launched CubeSats for the purpose of
technological demonstrations [2]. The structure of a CubeSat is
significant to resolving the problem of space object identification.
The CubeSat reference design, proposed by Professor Jordi Puig-
Suari from California Polytechnic State University and Professor
Bob Twiggs from Stanford University in 1999, aimed to build a
spacecraft with similar capabilities to the first spacecraft, Sputnik
[1]. A CubeSat consists of one or more 10 cm by 10 cm by 11.35
cm units with mass no more than 1.33 kg per unit [3]. Larger
CubeSat platforms have been proposed from time to time.
Among them, common are the 6U and 12U CubeSats, which are
used for academic and technological validation applications [1].
Real-time object detection is crucial for many space-related
applications. Although higher accurate object detection is
becoming important, there are many loopholes in current
object detection methods. Therefore, robust object detection
systems are needed to precisely understand the environment.
Recently, convolutional neural networks (CNNs) have been used as a powerful tool for recognizing image content and are
widely considered in the computer vision community [4]. One
disadvantage of CNNs is that it is computationally demanding,
which requires a GPU that requires higher power consumption.
With the development of the software industry, there are
many advances that have been done in the fields of computer
vision and machine learning. One major contribution is the
Faster R-CNN [4] which shows promising results. This context
motivated the researcher to participate in this research and to
develop robust Faster R-CNN based object detection models that
will perform a key role in the computer vision community. This
research was focused on generating new CubeSats databases
and development of CubeSats detection models using the Faster
R-CNN [4]. In this research, CubeSats with various dimensions are
referred as “1U CubeSat,” “2U CubeSat,” “3U CubeSat,” and so on
[5]. Latest development the Faster R-CNN achieves near real-time
performances using deep networks [4]. Faster R-CNN models
described in this research for CubeSat detection were trained
and tested on both Web-searched images and synthetic images
rendered using CAD models. A series of sensitivity analyses were
performed to measure the accuracy of the developed CubeSats
detection models. Results showed the potential to be a general
CubeSat detection tool.
CubeSat attitude estimation using the
detection results from the Faster R-CNN
Increasing the number of CubeSats launches leads to an increase
in the number of small Sats in the lower-earth orbit (LEO).
This causes an increase in space traffic and the possibility of
the collision of Sats and asteroids. This requires more service
missions to remove Sats debris. To better service these missions,
it is important to understand the environment. Therefore, fast
and accurate space objects detection and attitude estimation
methods need to be developed. Sat’s attitude can be determined
by using several different ways. In this research, the singular value
decomposition (SVD) method [6] has been examined to estimates
a spacecraft attitude by minimizing Wahba’s loss function [7].
In this paper, a coarse range of attitude estimation is obtained
for a Sat using the centroids of the bounding boxes of detected
CubeSats in the environment.
Related Work
The development of image datasets used to train artificial neural
networks (NNs) progresses with the computer vision demand.
Computer vision is a research field that is used to perform many
object detections experiments with image datasets [8-13]. The
use of visual data from the internet is a good source to develop
a vision-based system. There is good amount of literature in the
computer vision community [14-18] that has been devoted to
designing object detection systems using images texture and
shape cues. With the recent improvements, the CNNs have been
successfully used on red-green-blue (RGB) images for a variety of
tasks [4,19-24] in computer vision (e.g. classification and object
detection). CNNs have the power of learning features accurately.After learning from a large database like ImageNet [4], CNNs have the ability to generalize the learned features on new image
datasets as well. However, there are drawbacks of these systems
with the limited data availability. Because of this, researchers
were focused on developing detection models using synthetic
image data [25-27].
Synthetic images for training
Many researchers tried to use synthetic images to train CNNs
due to the lack of training images [28-31]. There have been a few
works published on shape descriptors considering the 3D-CAD
data representation [32-34]. There are many ways to represent
the shape information in a vision system [35,36]. This research
had been focused on a few more experiments to increase the
accuracy of the object detection process using 3D-CAD-based
images. When preparing a massive image dataset using 3D-CAD
models, the dataset needs to consist of a large number of images
with higher variation in features (e.g., color, scale, texture, etc.)
to increase the accuracy of training with higher learning capacity
[37]. When rendering an image, many different parameters
such as different lighting conditions and camera configurations
can be used. This research introduces an innovative path (using
Autodesk Maya) [38] to render images from 3D-CAD models for
the Faster R-CNN training purposes.
Experimental Setup
Faster R-CNN has the capability of learning powerful image data patterns. All these image data patterns are hidden under huge
number of parameters [4]. It is worth it to study what these
parameters represent to understand the behaviour of the Faster
R-CNN. In this paper, the Faster R-CNN is evaluated on two
tasks: Web-searched images based CubeSats detection and CAD
images based CubeSats detection (Sat’s attitude estimation). The
mean average precision (mAP), precision and recall curves are
reported to evaluate the accuracy of trained CubeSats models [5]. The section experiment setup includes discussions for data
-sets and important considerations that are followed towards
developing an accurate CubeSats detection system [39].
Data
For the preliminary works in this research two new datasets are
collected. They are Web-searched CubeSats images and 3D-CAD
models-based images with texture. This subsection includes
discussions about datasets, annotation process, and experimental
setup in detail for the collected Web-searched dataset.
Web-searched dataset: This dataset is collected as a part of
the research to detect CubeSats in Web-searched images. Main
problems when working with images are the partial observability,
scale, and recognition of the correct shape of the object with
different viewpoints [40]. However, these problems could be solved by introducing more information such as increasing the training data with various data augmentation techniques.
Augmented web-searched dataset: This dataset is prepared by
incorporating data augmented techniques, as shown in Figure 1 [41]. The dataset is divided into two: original images (970 images)
and augmented images (9,067 images) with corresponding
annotation files. 10,037 images (with data augmentation) are
used for training and four types of image datasets are used for
testing. Data augmentation techniques rotation, jitter, gray, and
flip are used to increase the Web-searched training dataset to
10,037 images with corresponding annotation files [5].
Figure 1: Data augmented techniques: rotation, gray, flip, and
jitter [41].
Test dataset: Test datasets include 255 Web-searched gray
images, 317 CAD with texture images, 313 CAD images without texture, and 255 Web-searched color images. In addition, for a fair
comparison 1,014 Web-searched test images are prepared using
all data augmented techniques. These images are collected to
evaluate the ability of the trained CubeSats models on detecting
correct CubeSats classes.
Image annotation: Training and testing CubeSat datasets are
annotated as follows. Inputs to the annotation process are a
CubeSat image, predefined classes (e.g., 1U CubeSat, 3U CubeSat,
etc.), and a user defined bounding box around the object-ofinterest
in the image. When it comes to image annotation
process, two assumptions are made about the images [42]: the
object class (e.g., 1U CubeSat, 3U CubeSat, etc.) and the location
of the object in each image. Each CubeSat image is annotated
by drawing rectangular boxes for each predefined object (e.g.,
CubeSats) and labeled every object-of-interest with predefined
keywords found in its image [41]. All annotated files for positive
images are in the pascal challenge format [34].
Important considerations
How to handle the scale of an image: One of the biggest
challenges when training the Faster R-CNN is the scale of images
[37]. Sometimes, the CubeSats detection process fails due to the
difficulty of detecting CubeSats. One limitation of Web-searched
images for CubeSats detection is that there are a limited number
of images available for CubeSats. To overcome this situation, one
possibility is preparing the CubeSat dataset including CubeSats
images with different scales [39]. In order to evaluate how the
scale of the image effects on Web-searched-based CubeSats
dataset, the Faster R-CNN is trained at the image scale of 600
1,000 (default scale) and results are tested at different scales
[39]. Results show that image scaling considerably affects the
detection process (Table 1). When reducing the scaling of the
image, the resolution of the image drops by reducing the CubeSat
detection probability.
| Trained data |
Trained scale |
Extractor |
Tested scale |
mAP (%) |
| Web-searched |
600 |
1,000 |
VGG-16 |
300 |
300 |
85 |
| Web-searched |
600 |
1,000 |
VGG-16 |
300 |
1,000 |
93.7 |
| Web-searched |
600 |
1,000 |
VGG-16 |
600 |
1,000 |
95.8 |
| Web-searched |
600 |
1,000 |
VGG-16 |
600 |
600 |
93 |
| Web-searched |
600 |
1,000 |
VGG-16 |
1,000 |
300 |
85 |
Table 1: CubeSats detection results on different image scales (tested on
the Web-searched augmented image dataset).
How object proposal matters: In the Faster R-CNN, detection
accuracy depends on the number of object proposals [39]. The
Faster R-CNN architecture is flexible on choosing the number
of object proposals to be sent to the classifier at test-time [4].
Experiments are conducted on the number of the object proposal
at test time to find out how the accuracy changes on the Websearched
CubeSats detection system (Table 2). In this experiment,
the test-time number of object proposals varies between 10 and
1,000 [39]. Figure 2a shows variations of the mAP with a different
number of object proposals. According to the Table 2 it shows
increasing the number of object proposals does not largely help
to increase the detection accuracy. To save the computational
cost, for this research selected 100 object proposals at test time.
| Extractor |
Trained data |
Trained proposals |
Tested proposals |
mAP (%) |
| VGG-16 |
Web-searched |
2,000 |
10 |
89.8 |
| VGG-16 |
Web-searched |
2,000 |
100 |
95.7 |
| VGG-16 |
Web-searched |
2,000 |
200 |
95.7 |
| VGG-16 |
Web-searched |
2,000 |
300 |
95.8 |
| VGG-16 |
Web-searched |
2,000 |
500 |
95.6 |
| VGG-16 |
Web-searched |
2,000 |
1,000 |
95.6 |
Table 2: CubeSats detection results by varying number of object
proposals (tested on the Web-searched augmented image dataset).
Figure 2: Memory usage (MiB) of GTX-1080 GPU and Number of
object proposals versus mAP.
Iterative training: The Faster R-CNN is an iterative method [4]. Experiments are conducted to monitor how the iterative ways
improve the accuracy of the CubeSats detection [39]. Multiple
networks are trained with two different feature extractors:
the VGG-M and VGG-16. VGG-M is a smaller CNN architecture
with seven layers [1]. For the Web-searched image dataset, it
showed that increasing the number of iterations does not largely
help to improve the accuracy of the CubeSats detection model
(Table 3). For the VGG-16, it is worth applying early stopping at
70K to prevent unnecessary computation [43]. In addition, the
researcher measured the memory consumption of GTX-1080
GPU for the VGG-M and VGG-16 feature extractors. Also, the
size of CubeSats models generated by each extractor is recorded.
The graph shown in Figure 2b shows that the VGG-16 has higher
memory consumption compared to VGG-M feature extractor.
| Type |
Trained data |
VGG-16 |
VGG-M |
| GPU memory consumption (MiB) |
Web-searched |
6,834 |
1,945 |
| Size of the model (MB) |
Web-searched |
546.9 |
349.8 |
| Testing time for an image (seconds) |
Web-searched |
<0.2 |
<0.2 |
| Iteration 70K, mAP (%) (one stage) |
Web-searched |
95.8 |
- |
| Iteration 80K, mAP (%) (two stage) |
Web-searched |
- |
90.6 |
| Iteration 100K, mAP (%) (one stage) |
Web-searched |
95.2 |
- |
Table 3: Performance of each feature extractor on GTX-1080 GPU (tested on the Web-searched augmented image dataset).
Performances of the CubeSats detection process: In this section,
the mAP [4] is reported for the Web-searched CubeSats detection
models. The detection accuracy of CubeSats model is evaluated
by plotting the precision and recall curve. Figure 3 shows how the
precision and recall curve change with the type of tested image
datasets. Figures 3a-3c show higher accuracy while maintaining a
high precision with a high recall compared to Figure 3d. Figure 3d shows that the Web-searched CubeSats detection model shows
a very low accuracy when tested on CAD-no-texture CubeSats
image dataset compared to other precision and recall curves.
Rendered images from 3D-CAD models are lack of realistic nature
which significantly reduces the performance when testing on
Web-searched CubeSat model [25]. It is possible to overcome
such situations to some extent by adding real image texture on
to CAD models [25]. This process is time-consuming and needs
supervision to select the appropriate texture for each CubeSat
category [25].
Figure 3: Precision and recall curves for different test datasets.
Training methods: To train the Faster R-CNN both the
“approximate joint training” (end-to-end) and the “alternating training” [4] methods can be used. Table 3 shows results of
both training methods. From results on Table 3, it shows that
deep architectures like VGG-16 trained using the one-stage
method learned better on new CubeSat datasets than the small
architecture like VGG-M which has used the two-stage training
method [4]. What makes alternating training special is it first trains
the region proposal network (RPN) and uses the proposals to train
the Fast R-CNN [4]. For the alternating training, the learning rate
is fixed at 0.001, momentum to 0.9, and trains for 80K iterations,
then lowers the learning rate to 0.0001 and trains for another
40K iterations [4]. For the approximate joint training (end-toend),
the learning rate is fixed at 0.0001, momentum to 0.9, and
has trained for both 70K and 100K iterations. The intersection of
union (IoU) threshold for the non-maximum suppression (NMS)
is fixed at 0.7 to get around 2,000 proposal regions per image [4].
The experiments are conducted on a Dell desktop computer with
32GB RAM, an i7-6700 Intel CPU, and a Nvidia Ge Force GTX-1080
GPU [5]. It took below 0.2 seconds to process a test image by all
CubeSats models on the GTX-1080 GPU (Table 3). This training
process applied widely used Faster R-CNN pre-trained weights for
1,000 object categories on Image Net [4].
Effect of the training batch size: In order to measure the impact of the size of image datasets, two CubeSats models are trained with
Web-searched image datasets varying from 970 original images
to 10,037 images with data augmentation techniques [39]. VGG-
16 feature extractor is evaluated on the training batch size (Table
4) [5]. The performances are increased considerably (from mAP
of 83.7 percent to 95.8 percent for VGG-16) when increasing the
size of training images dataset [39].
| Method |
Extractor |
Trained data |
1U (%) |
3U (%) |
mAP (%) |
| End-to-end |
VGG-16 |
Web-searched: original (970) |
84.8 |
82.5 |
83.7 |
| End-to-end |
VGG-16 |
Web-searched: augmented (10,037) |
95.8 |
95.8 |
95.8 |
Table 4: Performance with training images batch size (tested on the
Web-searched augmented image dataset).
Detection Accuracy after Increasing the
Number of CubeSat Classes: 1U, 2U, 3U, and
6U CubeSats
When it comes to CubeSats configuration, there are different
CubeSats configurations such as “2U” and “6U” CubeSats. In
this section, the researcher set a goal of developing a CubeSat
detection model by increasing the number of the CubeSat classes:
“1U, 2U, 3U, and 6U” CubeSats. In order to start the process, the researcher collected a dataset for four different classes of
cubesats.The dataset contains images from the Web using the Google search engine. 29,210 images (with data augmentation) are used for the training process. Data augmentation techniques rotation, jitter, gray and flip is used to increase the training dataset to
29,210 images with corresponding annotation files. 4201 images
(with data augmentation) are used for the testing process. The
CubeSat detection model is trained using the “approximates joint
training” method. The IoU, threshold for NMS, set at 0.7 for this
experiment to get around 2000 proposal regions per image [4].
For the approximate joint training, the learning rate is fixed at
0.0001, momentum to 0.9, and has trained for 70K iterations.
The size of the sliding window used in this experiment is 3×3,
as it is a good scale to detect the likelihood of the presence of
a CubeSat in the proposal generation stage [4]. To extract more
accurate features the “cov5_3” layer of VGG-16 architecture has
been used. It took below 0.2 seconds to process a test image on
the GTX-1080 GPU.
When developing a vision-based model, it is important to have a
way to measure the accuracy of the developed vision system to
handle unseen test data [44]. Supervised learning models which
are acquired from a dataset can be categorized into three types
[44]: under-fitted, well-trained, and over-fitted models. Overly
simple models named as under-fitted models. Overly complex
training methods lead to over-fitted models by learning noisy
data, which then leads to bad generalization [44]. The following
experiments are conducted to evaluate the performance of the
trained CubeSat model: when the test image is that of a “1U, 2U,
3U, and/or, 6U” CubeSats, when the test image is an asteroid
or a planet, and if there are no CubeSats at all to find out when
the trained CubeSat detection model fails. mAP for detecting
four CubeSats classes are shown on Table 5. Figure 4 shows the
precision and recall curve after increasing the number of CubeSat
classes: 1U, 2U, 3U, and 6U CubeSats. From the mAP, the precision
and recall curve can conclude that the developed Web-searched
CubeSat model with four classes shows acceptable results to
become a general CubeSat detection tool.
| Tested data |
No. images |
1U (%) |
2U (%) |
3U (%) |
6U (%) |
mAP (%) |
| Web-searched |
4201 |
96.3 |
73.4 |
82.5 |
78.6 |
82.7 |
Table 5: mAP after increasing the number of CubeSat classes: 1U, 2U, 3U,
and 6U in Web-searched dataset.
Figure 4: Precision and recall curve after increasing the
1U (%) 3U (%) mAP (%) 1U 2U (%) 3U (%) 6U (%)
number of CubeSat classes: 1U, 2U, 3U, and 6U.
CubeSats detection results are evaluated on how illumination
affects the detection process and the prediction probability
when there are no CubeSats at all. The detection results for
four CubeSats classes are shown in Figures 5 and 6. If the Websearched
CubeSats detection model has to detect low-resolution
images (Table 1) there is a high chance for a false detection. Figure 6 shows that the Web-searched CubeSats detection
models assigned lower probabilities to non-CubeSat objects. Due
to the intra-class variation of CubeSats models available in the
Web-searched image dataset, Web-searched-based CubeSats
detection model learned the 1U, 2U, 3U, and 6U CubeSats
shapes with higher accuracy. There are false positives for Web-
Searched-based CubeSats detection system. The Web-searched
CubeSats detection model detected cylinders (e.g., Hubble
space telescope) as 3U CubeSats (Figure 6). This is expected
fault detection as the viewpoint of the Hubble space telescope
image is similar to a side view of a 3U CubeSat. Sometimes, the Web-searched-based CubeSats detection models detect wrong
shape (e.g., a 2U CubeSat as a 3U CubeSat) as shown in Figure
6. These are some major challenges with the developed CubeSat
models which focus to solve in the future works. However, the developed Web-searched-based CubeSats detection model has a high capability on rejecting irregular shapes and circles (asteroids
and planets) as shown in Figure 6 and showed the potential to be
a general CubeSat detection tool.
Figure 5: Detection results after increasing the number of CubeSat classes: 1U, 2U, 3U, and 6U [36-43].
Figure 6: Trained for 1U, 2U, 3U, and 6U CubeSats detection, no red-box means no detection [44-47].
CubeSat Attitude Estimation Using
the Detection Results from the Faster
R-CNN
This section presents a single-point coarse attitude estimation
method based on the detection results by a spacecraft in the close
proximity of two or more CubeSats. The method can be used as
a contingent attitude estimation solution for a spacecraft. The
attitude is defined not as the orientation of the spacecraft relative
to one of the CubeSats in close proximity, but the orientation of
the spacecraft with respect to a global reference frame such as the
Earth-Centered Inertial frame or the Earth-Centered Earth-Fixed
frame. Determining the former would require the use of CubeSat
surface feature points in the image, which are unavailable from
the output of the CubeSat detection system. Instead, the attitude
determination system leverages the coordinates of the bounding
boxes surrounding the CubeSats. The centroid of a bounding box
can be readily calculated from the coordinates of the four corners
of the bounding box. These bounding box centroids approximate
the centroids of the CubeSats in the image, which in turn
approximates the center of mass of the CubeSats in the image.
Algorithm development
The attitude estimation algorithm is developed under the
following assumptions: the spacecraft body frame is the same as
the camera frame, the CubeSat image is provided by a pin-hole
camera with known focal length onboard the spacecraft, two or
more CubeSats are detected in the image, the position vectors of
the detected CubeSats and the spacecraft are provided by GPS,
the position information of the detected CubeSats is shared with the spacecraft. The bounding box coordinates and the camera
focal length determine the LOS vectors from the spacecraft to the
CubeSats in the body frame. The GPS data are used to determine
the LOS vectors in the reference frame. Then, the three-axis attitude is obtained by solving Wahba’s problem [7]. Suppose there are n≥2 bounding boxes with centroids 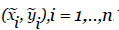 The n LOS vectors in the body frame are given by:
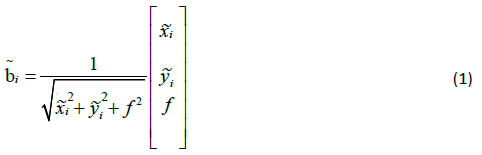
where f denotes the focal length of the camera. The LOS vectors
in the reference frame are given by:
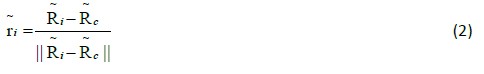
Where  are the CubeSat positions in the reference frame and
  is the space craft position in the reference frame. The attitude matrix estimate
  is the solution to Wahba’s problem, which
minimizes the following cost function:
is the solution to Wahba’s problem, which
minimizes the following cost function:
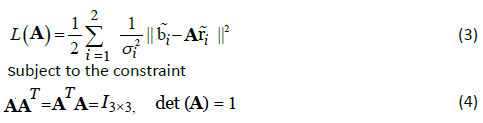
Where the superscript T denotes matrix transpose, det denotes
matrix determinant, I3x3 is the three-dimensional identity matrix,
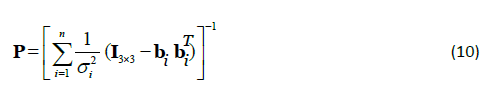
and  is the effective noise level. Suppose the noise variances
of
is the effective noise level. Suppose the noise variances
of  and
and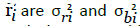 respectively. Therefore, σi2 ≈ σri2 +σbi2. Many solutions to Wahba’s problem exist. In this research Markley’s singular value decomposition method [6] has been used to solve the attitude estimation problem. First, an attitude profile matrix B is constructed:
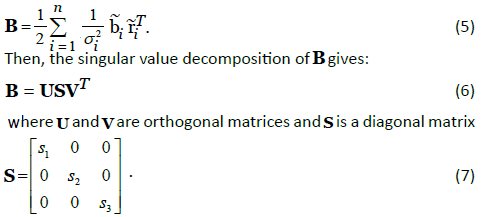
The attitude estimate is given by:
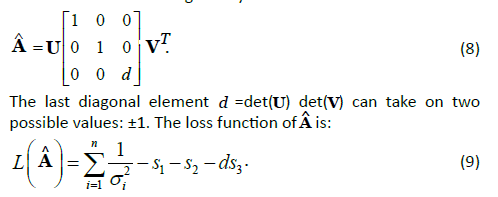
The 3×3 attitude error covariance matrix is given by:
Where  are the noise-free LOS vectors in the body frame.
Illustrative example
In this subsection, an example is used to show the attitude
determination process. Simulated images are generated using
Autodesk Maya, a 3D software application developed by Autodesk
[56]. A Faster R-CNN with four CubeSat classes is built on Caffe
[57]. A total of 90,956 synthetic training images in 1,000 random
camera viewpoints are generated using Autodesk Maya. In Maya,
the default method of rotation is Euler [58]. Euler rotations are
calculated using three Euler angles, which represent rotations
about the X, Y, and Z axis, with an order of rotation [58]. The
user can specify the order of rotation for an object (CubeSat) by
setting its rotation order (e.g., XYZ). For example, if the user sets
a CubeSat’s rotation order to XZY, the CubeSat will first rotate on
the X axis, then the Z axis, and finally the Y axis. The synthetic test
images of rotating CubeSats are simulated based on rigid-body
kinematics and dynamics under zero external torque. The camera
is assumed to be sufficiently close to the CubeSat, but the relative
translational motion is not simulated.
Object space versus world space: Maya has two
coordinate systems: the local coordinate system and global
coordinate system. The local coordinate system is called object
space and the global coordinate system is called world space [56].
In Maya, the world coordinate system is always fixed. Figure 7a shows three CubeSats representation in the world frame and XYZ
coordinates of a one CubeSat in the world frame. It is necessary
for each CubeSat to have its own axis independent of the worldaxis.
When a CubeSat rotates or moves, its object space rotates
or moves with it. This is called the object space [56].
Figure 7: Autodesk Maya world and camera frames.
Camera frame: When a user creates a camera in Maya, its view
is perspective [59]. To render a scene the user needs to create a
rendering camera as shown in Figure 7b.
Focal Length: In Maya, the focal length is represented in
millimeters (mm) [59]. The object’s (CubeSat’s) size in the
rendering frame is proportional to the focal length of the camera.
Therefore, the user needs to be careful when selecting a focal
length as it causes the CubeSat to appear larger or smaller in the
rendering frame.
Simulated scenario 1: 1U CubeSats detection
In this example, three 1U CubeSats are present in the close
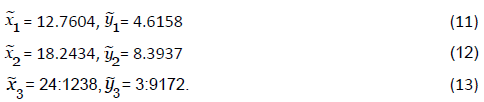
proximity of a camera onboard a spacecraft. The detection result is shown in Figure 8. The centroids of the bounding boxes are
[units: centimeters (cm)]:
Figure 8: 1 U CubeSats detection.
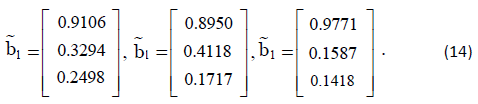
The focal length of the camera is f =3.5 cm. Thus, the three LOS
vectors in the body frame are:
The position vectors of the CubeSats and the spacecraft are (cm):
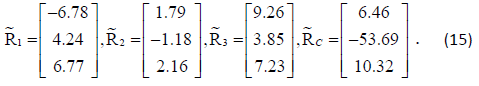
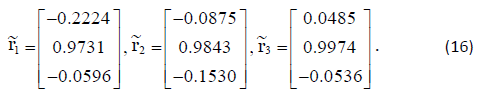
From the position vectors, the LOS vectors in the reference frame
are:
The attitude estimate is given by:
From the attitude-error covariance matrix in Equation 10, the
attitude estimation method has two primary error sources: GPS
and bounding box coordinates. The effect of the GPS positioning error on σri is well understood. Roughly speaking, σri ≈ σGPS/ri where ri is the distance from the camera to the i-th CubeSat. The noise level σbi is a complicated function of the attitude of the
CubeSats and the tightness of the bounding box and need to be
determined by experimentation. In addition, σbi is approximately proportional to the pixel size of the camera and inversely
proportional to the field of view of the camera. The field of view
of the camera limits the number of CubeSats that simultaneously
appear in the image. When the number drops below two, the
attitude cannot be uniquely determined.
Conclusion
The goal of this research framework is to provide an introduction
and crucial knowledge to develop accurate CubeSats detection
models using the Faster R-CNN. A wide range of experiments
is conducted to develop accurate CubeSats detection models.
For the preliminary work of this research, a CubeSats detection
model using the Faster R-CNN with Web-searched images is
developed. Then, experiments are analyzed Web-searched
CubeSats detection model on images with and without texture
features. The biggest challenges with these experiments are to
detect small-scale CubeSats and to detect the correct shape of
CubeSats. There are situations where the CubeSats detection
process failed due to the difficulty of detecting the CubeSat.
Therefore, this paper proposed important considerations that
need to be considered to improve the accuracy of CubeSats
detection models. Another objective of this research is to solve
an attitude estimation problem using the detection results
from the Faster R-CNN. This paper proposed a coarse singlepoint
attitude estimation method utilizing the centroids of the
bounding boxes surrounding the CubeSats in the image. Future
research will focus on generalizing the CubeSats detection model
to an extent that can detect more CubeSats classes (12U, 27U)
in dynamic environments while optimizing the Faster R-CNN
network. Moreover, to increase the estimation accuracy, future
works will focus on more quantitative error analysis for the
attitude estimation problem.
References
- CubeSat. Wikipedia, 2020.
- About us, Aerospace. Aerospace.org, 2019.
- 3D CAD Design. CubeSatkit.com, 2005.
- Ren S, He K, Girshick R, Sun J (2015) Faster R-CNN: Towards Real-Time Object Detection with Region Proposal Networks. Adv Neural Inf Processing Syst: 1-14.
- Gamage S, Cheng Y (2018) CubeSat Detection Using Convolutional Neural Networks. Space Flight Mechanics Meeting, 2018.
- Markley L (1988) Attitude Determination Using Vector Observations and the Singular Value Decomposition. J Astronaut Sci 38: 245-258.
- Wahba G (1965) A Least Squares Estimate of Satellite Attitude. SIAM Review 7: 409–409.
- Eggert C, Brehm S, Winschel A, Zecha, D, Lienhart R (2017) A closer look: Small object detection in faster R-CNN. IEEE Int Conf Multimed Expo: 421–426.
- Lee J, Wang J, Crandall D, Sabanovic S, Fox G (2017) Real-Time, Cloud-based Object Detection for Unmanned Aerial Vehicles. IEEE Int Conf Robot Comput: 36–43.
- Lokanath M, Kumar KS, Keerthi ES (2017) Accurate object classification and detection by faster-RCNN. IOP Conf Ser: Mater Sci Eng 263: 1-8.
- Oliver NM, Rosario B, Pentland AP (2000) A bayesian computer vision system for modeling human interactions. IEEE Trans Pattern Anal Mach Intell 22: 831–843.
- Vasilescu MAO, Terzopoulos D (2005) Multilinear independent components analysis. 2005 Proc IEEE Comput Soc Conf Comput Vis Pattern Recognit1: 1-7.
- Wang H, Li Z, Ji X, Wang Y (2017) Face R-CNN. CoRRabs/1706.01061.
- Marcos D, Volpi M, Tuia, D (2016) Learning rotation invariant convolutional filters for texture classification. Comput Vis Pattern Recognit, arXiv:1604.06720v2.
- Peng X, Saenko K (2016) Combining Texture and Shape Cues for Object Recognition with Minimal Supervision. Asian Conf Comput Vis 4: 256-272.
- Uijlings JRR, van de Sande KEA, Gevers T, Smeulders AWM (2013) Selective search for object recognition. Int J Comput Vis 104: 154–171.
- Zeiler MD, Fergus R (2014) Visualizing and understanding convolutional net-work. Comput Vis ECCV: 818-833.
- Cimpoi M, Maji S, Kokkinos I, Mohamed S, Vedaldi A (2014) Describing textures in the wild. 2014 IEEE Conf Comput Vis Pattern Recognit: 1-8.
- Donahue J, Jia Y, Vinyals O, Hoffman J, Zhang N, et al. (2013) DeCAF: A Deep Convolutional Activation Feature for Generic Visual Recognition. 2013 IEEE/RSJ Int Conf Intell Robot Syst: 922-928.
- Girshick R (2015) Fast R-CNN. 2015 IEEE Int Conf Comput Vis, 2015.
- Girshick R, Donahue J, Darrell T, Malik J (2014) Rich feature hierarchies for accurate object detection and semantic segmentation. 2014 IEEE Conf Comput Vis Pattern Recognit, 2014.
- Hao S, Charles RQ, Yangyan L, Guibas LJ (2015) Render for CNN: View point Estimation in Images using CNNs Trained with Rendered 3-D Model Views. IEEE Conf Comput Vis Pattern Recognit, 2015.
- Kazhdan M, Funkhouser T, Rusinkiewicz S (2003) Rotation invariant spherical harmonic representation of 3D shape descriptors. Eurographics Symp Geom Process 43: 156-165.
- Osada R, Funkhouser T, Chazelle B, DobkinD (2002) Shape distributions. ACM Trans Graph 21: 807–832.
- Philipp F, Alexey D, Thomas, B (2014) Descriptor matching with convolutions neural networks. Comput Vis Pattern Recognit, Machine Learning eprint arXiv: 1405.5769.
- Vishakh H, Reza Z (2016) Fusion-Net:3D object Classification using Multiple Data representation. Neural Inf Process Syst: 1-9.
- Xingchao P, Baochen S, Karim A, Kate S (2015) Learning Deep Object detectors from 3D Models. 2015 IEEE Int Conf Comput Vis: 1278-1286.
- Hoiem D, Savarese S (2011) Representations and Techniques for 3D Object recognition and Scene Interpretation. Morgan and Claypool: 169.
- Peng X, Sun B, Ali K, Saenko K (2015) Learning Deep Object Detectors from 3-D Models. 2015 IEEE Int Conf Comput Vis: 1278-1286.
- Song S, Xiao J (2014) Sliding Shapes for 3-D Object Detection in Depth Images. 13th Comput Vis ECCV: 634–651.
- Xiang Y, Kim W, Chen W, Ji J, Choy C et al. (2016) ObjectNet3D: A Large Scale Database for 3D Object Recognition. Comput Vis ECCV: 160-176.
- Li Y, Pirk S, Su, H, Ruizhongtai C Qi (2016) FPNN:Field Probing Neural Networks for 3D Data.Comput Vis Pattern Recognit: 1-9.
- Shi B, Bai S, Zhou Z, Deeppano XB (2015) Deep panoramic representation for 3D shape recognition. IEEE Signal Process Lett 22: 2339–2343.
- Wu Z, Song S, Khosla A, Yu F, Zhang L (2015) 3D shapenets: A deep representation for volumetric shapes. 2015 IEEE Conf Comput Vis Pattern Recognit: 1912–1920.
- Bronstein AM, Bronstein MM, Guibas LJ, Ovsjanikov M (2011) Shape Google: Geometric words and expressions for invariant shape retrieval. ACM Trans Graph 30: 1-20.
- Chen D, Tian X, Shen Y, Ouhyoung M (2003) On visual similarity based 3D model retrieval. The Eurographics Association and Blackwell Publishers 22: 223-232.
- Goodfellow I, Bengio Y, Courville A (2016) Deep Learning (6th edn) MIT Press 2016.
- Overview: Create expansive worlds, complex characters, and dazzling effects with Maya. Autodesk.com, 2020.
- Huang J, Rathod V, Sun C, Zhu M, Korattikara A (2017) Speed/accuracy trade-offs for modern convolutional object detectors. 2017 IEEE Conf Comput Vis Pattern Recognit: 7310-7319.
- Milivojevic B (2012) Object Recognition Can Be Viewpoint Dependent or Invariant – It's Just a Matter of Time and Task. Front Comput Neurosci 6: 27.
- Newly Created Tiny Satellites Are Key to Space Exploration. Futurism.com, 2017.
- What is image annotation? Quora.com, 2019.
- Early stopping. Wikipedia, 2020.
- Underfitting and Overfitting in Machine Learning. GeeksforGeeks.org, 2020.
- Kits multinational birds Cubesats. Madeinepali, 2017.
- ESDN CubeSat Swarm- NASA. AMSAT-UK Radio Amateur Satellites, 2012.
- CubeSat. Netease.com, 2014.
- Ham Radio CubeSat Launch Success. W6TRW Amateur Radio Club, 2018.
- Space sky rocket. Space Environmental NanoSat Experiment (SENSE), 2015.
- The next big thing is small. Appel Knowledge services NASA, 2010.
- Space sky rocket. Space Environmental NanoSat Experiment (SENSE), 2015.
- Astronauts Gloves and sources. Google search.
- CubeSat.Jet propulsion laboratory NASA.
- Diamonds and more suggest unusual origins asteroids. Science news for students.
- Grush L (2018) NASA’s Hubble Space Telescope is offline after a steering component failed. Theverge.com, 2018.
- Learn Explore, cloud help. Autodesk knowledge network, 2016.
- Jia Y, Shelhamer E, Donahue J, Karayev S, Long J et al. (2014) Caffe: Convolutional Architecture for Fast Feature Embedding. ArXiv.org: 675-678.
- Animated rotation in Maya, Animation basics. Autodesk Maya, 2015.
- Support & Learning. Autodesk knowledge network, 2020.