Elisabetta Stenner1*, Roberta Russo1, Maurizio Ruscio1, Giulia Barbati2 and Aneta Aleksova3
1Dipartimento di Medicina dei Servizi, SC Laboratorio Unico di ASUITs, Azienda Sanitaria Universitaria di Trieste, Burlo, Gorizia e Monfalcone, Italy
2Department of Medical Sciences, Biostatistics Unit, University of Trieste, Italy
3Cardiovascular Department, Azienda Sanitaria Universitaria di Trieste, Italy
*Corresponding Author:
Elisabetta Stenner
Dipartimento di Medicina dei Servizi,
SC Laboratorio Unico di ASUITs, Azienda
Sanitaria Universitaria di Trieste, Burlo,
Gorizia e Monfalcone, Italy.
Tel: +39 3394306446
Fax: +390402872
E-mail: elisabetta.stenner@asuits.sanita.fvg.it
Received date: December 24, 2018; Accepted date: January 28, 2019; Published date: February 04, 2019
Citation: Stenner E, Russo R, Ruscio M, Barbati G, Aleksova A (2019) Could the Intra-Laboratory Inter-Identical-Instrument Bias Compromise the Interpretation of the Absolute High-Sensitive Troponin Delta Around the 99th Percentile Upper Reference Limit?. Biomark J Vol.5 No.1:1. doi: 10.21767/2472-1646.100056
Copyright: © 2019 Stenner E, et al. This is an open-access article distributed under the terms of the Creative Commons Attribution License, which permits unrestricted use, distribution, and reproduction in any medium, provided the original author and source are credited.
Keywords
High-sensitive troponin; Absolute delta; Inter-instrument bias; Passing- Bablok; Bland-Altman
Introduction
Measurement of troponins is mandatory for all patients with suspected NSTE-MI [1]. High sensitive troponin (hs-cTn) assays (which are able to measure the troponin in at least 50% of a healthy population, with an analytical coefficient of variation (%CV) lower than 10% at the 99th percentile upper reference limit (URL)), have been recently recommended in preference to less sensitive ones [1]. The use of hs-cTn assays have basically reduced the troponin-blind interval due to their ability to detect very small concentrations [2]. As result, rule-in and rule-out algorithms,based on the absolute hs-cTn value at presentation (above or below the 99th percentile URL) and the changing pattern observed 1-3 hours later, are currently recommended by the European Society of Cardiology (ESC) with a Class I recommendation and are considered safe [1-5]. To define whether or not a changing pattern is present, one must consider the blood flow and the time between the onset of symptoms and the obtaining of samples [6]. In addition, previous studies gave warning of possible quantitative analytical shifts at these low concentration ranges that may exceed some of the deltas reported in clinical studies [7-9] and it has recently been suggested to consider also the biological variation if hs-cTn assay is available, especially around 99th percentile. As a consequence, most studies conclude that a 50-60% change, if the initial value is less than 99th percentile, and a 20% change, if the initial value is greater than 99th percentile, are to be considered significant deltas [6]. However, absolute delta (assay dependent), appears superior to relative per cent changes with hs-cTn assay [10] and in some studies this is particularly so when the initial value is increased [11]. The critical point is that due to the fact that each patient should have more than one sample tested in order to evaluate the hs-cTn changes [2], in a laboratory equipped with more than one instrument, these samples may randomly be assayed by different instruments. This may lead to possible misclassification, as previously demonstrated by a contemporary assay [12]. The aim of this study is to measure inter-identicalinstrument bias in our laboratory in order to understand if it can compromise the interpretation of absolute delta value for rapid algorithm 0-3 hours.
Materials and Methods
Study design
A training program was scheduled before the beginning of the experiment to ensure that the operators would understand all procedures and could execute them properly [13].
High sensitive troponin I assays (hsTnI) (Access hsTnI, Beckman Coulter, Brea, CA, USA) were performed on sera from anonymized pre-existing heparin-plasma samples with a TnI (Access AccuTnI+3, Beckman Coulter, Brea, CA, USA) result. Tests were processed sequentially on the two DxI800 (Beckman Coulter), DxI-1 and DxI- 2, found in the stat laboratory, and on the other, DxXI-3, found in the central routine laboratory.
Assay methods
We used the hsTnI (Access hsTnI, Beckman Coulter, Brea, CA, USA) assay, which is characterized by a 2.3 ng/L LoD, 11.6 ng/L 99th percentile for women (CV%: 4.2), 19.8 ng/L 99th percentile for men (CV%: 3.6), 17.5 ng/L 99th percentile for overall (CV%: 3.7) and the 10%CV at 5.6 ng/L. Evaluation of total imprecision.
Total imprecision within the laboratory, expressed by the coefficient of variation (CV%), were calculated on all instruments. This was done by running five replicates of a plasma pool (P) (concentration of approximately 21 ng/L) and three internal quality controls (IQC) (Biorad Liquichek Cardiac Markers plus Control LT, Level 1C (CQ-LC) at approximately 17 ng/L, Biorad Level 1 (CQ1), at approximately 42 ng/L and Biorad Level 2 (CQ2), at approximately 780 ng/L) for five times [14]. These analyses were performed over a period of three weeks. Grubbs’ test was used to evaluate the presence of outliers [14]. In addition, daily IQC were evaluated before starting all analytical sessions (IQC-LC, IQC1, IQC2). Same lot of reagents were used over the experimental period (of about two months) and were calibrated using two different calibrator lots.
Statistical analyses
Data analysis (MedCalc® Statistical Software version 18.2.1 and R statistical package version 3.4.0, library “BlandAltmanLeh”) was performed using Passing-Bablok regression to test the linear relationship between the measurements, and Bland-Altman technique to estimate the consistency of the methods [13,15,16]. The results given by the three instruments were analyzed as followed: DxI1 vs. DxI2, DxI1 vs. DxI3, DxI2 vs. DxI3. The statistical analysis was inclusive of all the results, but this study focuses on the subgroup characterized by values below 50 ng/L. The acceptance of inter-identical-instrument bias calculated with the Bland-Altman test (bias ± 95%CI limits of agreement) was based on the reference change values (RCV= 2.77 (CVa2 + CVi2)1/2 where CVi= intra individual variation, taken as 10% [17] and CVa=total imprecision). Finally, method comparison was evaluated by means of the weighted Cohen’s Kappa statistic (with linear weights) [18] to calculate the concordance at clinically relevant cutoffs (women: 11.6 ng/L, all: 17.5 ng/L, men: 19.8 ng/L). This study was performed according to the Code of Ethics of the World Medical Association (Declaration of Helsinki) for experiments involving humans. The Hospital Institutional Review Board waived the need for informed consent.
Results
Our range of Access TnI+3, measured on 159 pre-existing heparinplasma samples, was <0.01 to 22.4 μg/L and it corresponds to hsTnI ranges 3 to 21839, 3 to 22382 and 5 to 21106 ng/L using DxI1, DxI2 and DxI3, respectively. Four samples were below the LoD and two samples were outliers, as a consequence they were excluded from the statistical analysis. Total imprecision within the laboratory was consistent with claims made by the manufacturer and in accordance with previous studies [19,20] on all instruments.
Due to the fact that we performed the assays using identical instruments, PB regression did not show any significant deviation from linearity (all p values from the linearity test: >0.10) and no proportional nor constant differences were observed among instruments, as expected, considering both the whole range of results Table 1 and those of subgroups below the 50 ng/L Table 1 and Figure 1. Moreover, the mean absolute bias, even though among the three instruments the lowest 95%CI lower limit was -3.75 and the highest 95%CI upper limit was 3.92 ng/L, was virtually zero and within the acceptance limits (all results
| |
|
Passing Bablok Regression |
Bland-Altman Test |
| |
|
Intercept
(95% Cl) |
Slope
(95% Cl) |
Bias
(95% Cl) |
Lower Limit
(95% Cl) |
Upper Limit
(95% Cl) |
| DXI-1 vs. DXI-2 |
<50 ng/L
(n=82) |
0.00
(0.00 to 0.00) |
1.00
(1.00 to 1.00) |
0.32
(0.05 to 0.58) |
- 2.07
(-2.53 to -1.60) |
2.70
(2.24 to 3.16) |
| DXI-2 vs. DXI-3 |
<50 ng/L
(n=82) |
0.00
(0.00 to 0.00) |
1.00
(1.00 to 1.00) |
0.18
(- 0.16 to 0.53) |
- 2.95
(- 3.55 to - 2.34) |
3.31
(2.70 to 3.92) |
| DXI-1 vs. DXI-3 |
<50 ng/L
(n=82) |
0.00
(0.00 to 0.00) |
1.00
(1.00 to 1.00) |
- 0.13
(-0.47 to 0.20) |
- 3.16
(-3.75 to - 2.57) |
2.89
(2.31 to 3.48) |
| DXI-1 vs. DXI-2 |
Total
(n=153) |
0.07
(-0.71 to 0.24) |
0.98
(0.96 to 0.99) |
23.8
(-42.84 to 90.47) |
- 791.44
(-906.9 to – 675.98) |
839.07
(723.62 to 954.53) |
| DXI-2 vs. DXI-3 |
Total
(n=153) |
0.00
(-0.18 to 0.00) |
1.00
(1.00 to 1.01) |
- 13.02
(-63.47 to 37.43) |
- 630.04
(-717.42 to – 542.66) |
604.00
(516.62 to 691.38) |
| DXI-1 vs. DXI-3 |
Total
(n=153) |
0.17
(-0.50 to 0.50) |
0.99
(0.97 to 1.00) |
- 10.79
(-70.49 to 92.09) |
- 983.42
(-1124 to – 842.62) |
1005.01
(864.21 to 1145.81) |
Table 1: Passing-Bablok regression values and Bland-Altman absolute differences (bias), limits of agreements and their confidence intervals for hsTnI measurements using DXI-1 vs. DXI-2, DXI-2 vs. DXI-3, DXI-1 vs. DXI-3. The statistical analysis was made of all the results and the subgroup characterized by values below 50 ng/L.
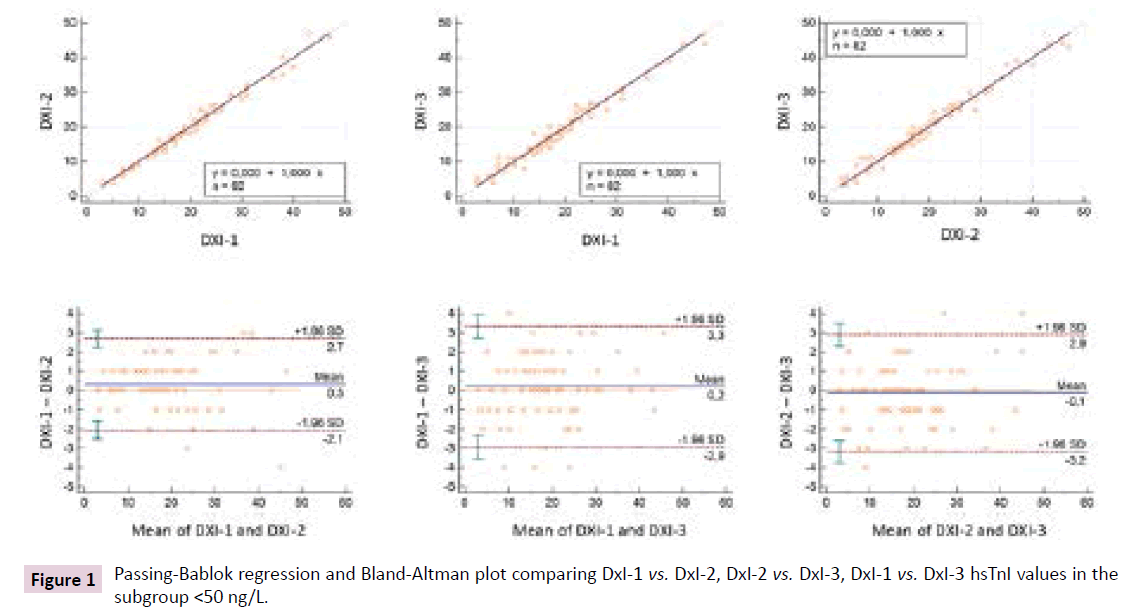
Figure 1: Passing-Bablok regression and Bland-Altman plot comparing DxI-1 vs. DxI-2, DxI-2 vs. DxI-3, DxI-1 vs. DxI-3 hsTnI values in the subgroup <50 ng/L.
The concordance between each couple of instruments was mostly strong [18]; however, the lower 95%CI limits of agreement sometimes revolved around 0.8, namely moderate agreement (11.6 ng/mL women cutoff: DxI1-DxI2: κ=0.93; 95%CI: 0.83-1.00, DxI1-DxI3: κ=0.93; 95%CI: 0.83-1.00, DxI2-DxI3: κ=1.00; 95%CI: 1.00-1.00; 17.5 ng/L all population cutoff: DxI1-DxI2: κ=0.97; 95%CI: 0.93-1.00, DxI1-DxI3: κ=0.90; 95%CI: 0.81-0.99, DxI2- DxI3: κ=0.89; 95%CI: 0.77-0.96; 19.8 ng/L men cutoff: DxI1-DxI2: κ=0.89; 95%CI: 0.89-0.99, DxI1-DxI3: κ=0.89; 95%CI: 0.80-0.99, DxI2-DxI3: κ=0.89; 95%CI: 0.79-0.99).
Discussion
Our data confirmed that analytical performance of each instrument around the cutoff values lies well within the accepted quality requirements [1-3]. Nevertheless, considering the combined effect of the presence of the three instruments, few patient results (k test results described above) were in disagreement between instruments. This was not unexpected and it is, at least in part, also the same if the evaluation is performed using only one instrument and considering its measurement uncertainty (MU) [21]. For example, if the 99th percentile 17.5 ng/L of all the population is supposed to be the real value of a patient then, according to our MU (imprecision and bias) of about 6.3%, the measured value will be, with a 95%CI, within the range (16.4 - 18.6 ng/L). Moreover, the measured inter-identical-instrument absolute bias Table 1 and Figure 1 of each couple of instruments, basically from -4 to 4 ng/L in the worst situation, allows us to conclude that the 3 and 5 ng/L absolute delta for short 0/1-0/3 hour algorithms, suggested by the manufacturer, cannot be used in our laboratory because the inter-instrument absolute delta is large enough to significantly interfere with the interpretation of these clinical absolute deltas. Probably this is especially the case when 0/1 hour is evaluated. Absolute deltas of 11 and 22 ng/L could be an analytically applicable choice, even if clinicians should think about these cutoffs as range (11 or 22 ± inter-identicalinstrument absolute bias) instead of dichotomous cutoff. For example, in our laboratory, if a patient has a real absolute delta of 11 ng/L, the measured delta could be 11 ± 4 ng/L, depending on the sequence of instruments used (DxI1-DxI1, DxI2-DxI2, DxI3- DxI3, DxI1-DxI2, DxI2-DxI1, DxXI1-DxI3, DxI3-DxI1, DxI2-DxI3, DxI3-DxI1). Interestingly, even if we used only one instrument, but considering the RCV (for all instrument <7 ng/L) to correctly interpret the absolute delta, the choice to not use 3 and 5 ng/L absolute value would be the same. However, due to the fact that 11 ± 4 ng/L absolute delta is really close to the observed RCV value, our analytical choice was to suggest to the clinicians the 22 ± 4 ng/L absolute delta. In addition, to underline the concept of a delta cutoff as a range, we also added to the final patient report, in the reference interval camp, the indication for absolute delta as 22 ± 4 ng/L.
Conclusion
Our data suggest that inter-identical-instrument bias needs to be considered before evaluating the clinical diagnostic accuracy of one absolute delta with respect to another, in order to define the minimum absolute delta that the laboratory can guarantee to the clinicians (Figure 2). Nevertheless, even if the laboratory has only one instrument, MU and RCV should be evaluated in interpreting values around cutoff and absolute delta respectively. Finally, it is well established that errors in cardiac troponin testing (i.e. heterophile antibodies, non-reproducible false elevations, etc) [22] can occur, so results should always be interpreted alongside the clinical context.
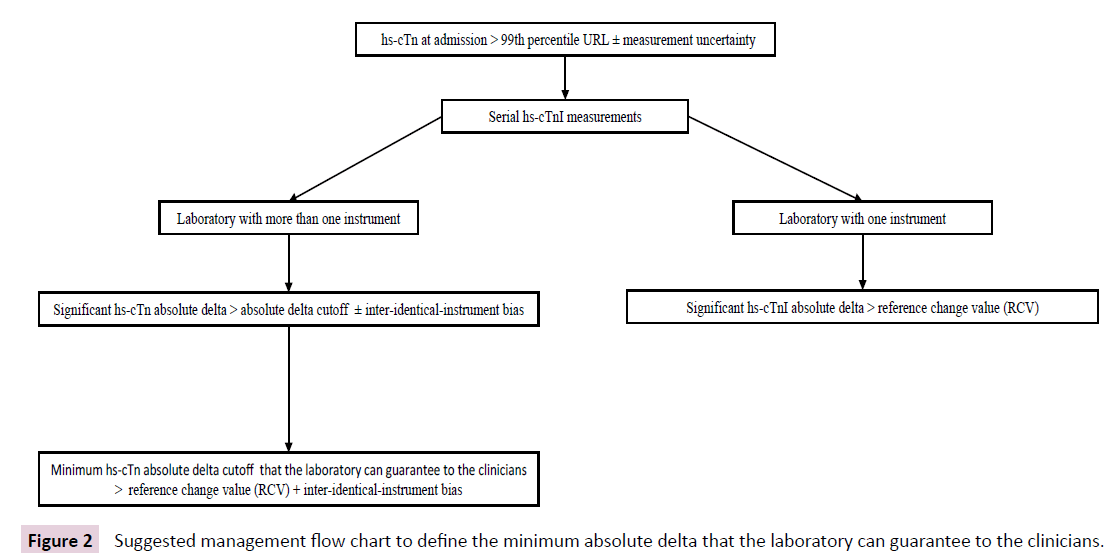
Figure 2: Suggested management flow chart to define the minimum absolute delta that the laboratory can guarantee to the clinicians.
Acknowledgement
We would like to thank Arianna Moranduzzo for English language revision and student Lorenzo Iob for practical help. All the hsTnI kits were kindly supported by the manufacturer (Beckman Coulter S.r.l. Italy. Cassina de’ Pecchi, Milan, Italy.
Research Funding
None.
Declarations of Interest
None.
References
- Roffi M, Patrono C, Collet JP, Mueller C, Valgimigli M, et al. (2016) 2015 ESC Guidelines for the management of acute coronary syndromes in patients presenting without persistent ST-segment elevation. Eur Heart J 37: 267-315.
- Twerenbold R, Boeddinghaus J, Mueller C (2018) Update on high-sensitive cardiac troponin in patients with suspected myocardial infarction. Eur Heart Journal Suppl 20: G2-G10.
- Twerenbold R, Neumann JT, Sörensen NA, Ojeda F, Karakas M, et al. (2018) Prospective validation of the 0/1-h algorithm for early diagnosis of myocardial infarction. J Am Coll Cardiol 72: 620-632.
- Body R, Carlton E (2018) Understanding cardiac troponin part 1: Avoiding troponitis. Emerg Med J 35: 120-125.
- Greenslade JH, Carlton EW, Van-Hise C, Cho E, Hawkins T, et al. (2018) Diagnostic accuracy of a new high sensitivity troponin I assay and five accelerated diagnostic pathways for ruling out acute myocardial infarction and acute coronary symdrome. Ann Emerd Med 71: 439-451.
- Thygesen K, Alpert JS, Jaffe AS, Chaitman BR, Bax JJ, et al. (2019) Fourth universal definition of myocardial infarction. Eur Heart J 40: 237-269.
- Wu AHB, Christenson RH, Greene DN, Jaffe AS, Kavsak PA, et al. (2018) Use of cardiac troponin in acute coronary syndrome: Expert opinion from the Academy of the American Association for Clinical Chemistry and the Task Force on Clinical Applications of Cardiac Bio-Markers of the International Federation of Clinical Chemistry and Laboratory Medicine. Clin Chem 64: 645-655.
- Lyon AW, Kavsak PA, Lyon OAS, Worster A, Lyon ME (2017) Simulation models of misclassification error for single thresholds of high-sensitivity cardiac troponin I due to assay bias and imprecision. Clin Chem 63: 585-592.
- Kavsak PA, Don-Wauchope AC, Hill SA, Worster A (2016) Acceptable analytical variation may exceed high-sensitivity cardiac troponin I cutoffs in early rule-out and rule-in acute myocardial infarction algorithms. Cin Chem 62: 887-889.
- Reichlin T, Irfan A, Twerenbold R, Reiter M, Hochholzer W, et al. (2011) Utility of absolute and relative changes in cardiac troponin concentrations in the early diagnosis of acute myocardial infarction. Circulation 124: 136-145.
- Mueller M, Biener M, Vafaie M, Doerr S, Keller T, et al. (2012) Absolute and relative kinetic changes of high-sensitivity cardiac troponin T in acute coronary syndrome and in patients with increased troponin in the absence of acute coronary syndrome. Clin Chem 58: 209-218.
- Pethick JPP, Davies T, Thompson J, Nallagonda M, Beech A, et al. (2016) The effect of multiple analysers on the biochemical diagnosis of myocardial infarction using a contemporary troponin-I assay. Ann Clin Biochem 53: 702-705.
- https://www.labac.eu/telechargements_labac/2016/07/CLSI-EP09A3E.pdf.
- https://clsi.org/standards/products/method-evaluation/documents/ep15/.
- Bland JM, Altman DG (2012) Agreed statistics: Measurement method comparison. Anesthesiology 116: 182-185.
- Ungerer JPJ, Pretorius CJ (2018) Method comparison: A practical approach based on error identification. Clin Chem Lab Med 56: 1-4.
- Scharnhorst V, Krasznai K, Van’t-Veer M, Michels RH (2012) Variation of cardiac troponin I and T measured with sensitive assays in emergency department patients with non-cardiac chest pain. Clin Chem 58: 1208-1214.
- McHugh ML (2012) Interrater reliability: The kappa statistic. Biochem Med 22: 276-282.
- Masotti S, Prontera C, Musetti V, Storti S, Ndreu R, et al. (2018) Evaluation of analytical performance of a new high-sensitivity immunoassay for cardiac troponin I. Clin Chem Lab Med 56: 492-501.
- Lippi G, Ferrari A, Gandini G, Gelati M, Lo Cascio C, et al. (2017) Analytical evaluation of the new Beckman Coulter access high sensitivity cardiac troponin I immunoassay. Clin Chem Lab Med 56: 157-161.
- Plebani M, Sciacovelli L, Bernardi D, Aita A, Antonelli G, et al. (2018) What information on measurement uncertainty should be communicated to clinicians, and how?. Clin Biochem 2: 1.
- Herman DS, Kavsak PA, Greene DN (2017) Variability and error in cardiac troponin testing. Am J Clin Pathol 148: 281-295.