Keywords
Clofibric acid; Copper (II); IR; Potentiometry; UV-Vis
Introduction
CA is a Peroxisome proliferator-activated receptors-alpha (PPARα) ligand. Peroxisome proliferator-activated receptors (PPAR)s constitute a family of receptors members of the steroid receptor superfamily [1-2]. To date, there are three known receptors, namely PPAR (α), (β/δ), and (γ). From our ongoing efforts to study the interaction of CA with a variety of metal ions, we have recently published, in this journal, the interaction of CA with the trivalent chromium metal ion Cr3+ [3]. Moncol et. al. showed the crystal structures and the spectral properties (EPR) for the solid state of the bis Cu(CA)2L2 complex where L is 2-pyridylmethanol. They also showed the dimeric (Cu)2(CA)4L2 complexes where L is N,Ndiethylnicotinamide [4]. Most of the works by Moncol and others [5-7] were in the solid state in which they showed the X-ray diffraction patterns of various solid Copper/CA monomer and dimer complexes.
Herein, we are showing aqueous solution studies of CA with hexa-aqua Cu2+ metal ion under ambient conditions between pH values of 2.5 to 10.5. The main objectives of the current report are: (1) To identify the type of Cu2+-CA complexes formed, if there is binding, under these ambient conditions in aqueous solutions in the low (1-2) milli molar concentration range; (2) To measure the potential response of the reaction mixture in milli-Volts (mV). Potentiometry is one of the most powerful tools to study metal ions in aqueous solutions under ambient conditions [8-11].
Experimental Section
Materials
All solutions were prepared using 99% purity Sigma reagent grade CA, C10H11ClO3, formula weight 214.6 g.mol-1, copper sulfate penta-hydrate, Cu(SO4).5H2O, formula weight 249.7 g.mol-1, and copper nitrate hemipenta-hydrate, Cu(NO3)2.2.5H2O, formula weight 232.6 g.mol-1using doubly deionized water to prepare all solutions. Figure 1 shows the structural formula of CA, or [2-(4-chlorophenoxy)-2-methyl propanoic acid (Chemical formula C10H11ClO3). The pH values of all solutions were adjusted using standardized sodium hydroxide (NaOH) solution. Standardization of this NaOH solution was done to the fourth decimal place (0.1271 ± 0.0043) mol.L-1. The pH values were measured using Orion Membrane pH meter (model 720) with a combination Orionglass electrode. No other ions were added to adjust the ionic strength of the solution; i.e., the potentiometric measurements were done in 0.0 mole.L-1 ionic strength solutions. The electrode was calibrated using the two points calibrations mentioned in the pH-electrode manual. Using buffer pH 4.00 and buffer pH 7.01 purchased from Fisher scientific.
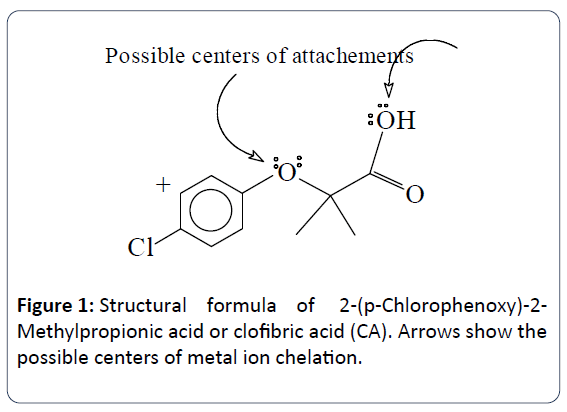
Figure 1: Structural formula of 2-(p-Chlorophenoxy)-2- Methylpropionic acid or clofibric acid (CA). Arrows show the possible centers of metal ion chelation.
Preparation of the potentiometric titration solutions
In all metal-ligand potentiometric titrations, the NaOH solution was always the titrant. The NaOH solutions were prepared from NaOH laboratory grade pellets in carbonate free water. The methods used to prevent the contamination of the titrant with atmospheric CO2 had been described elsewhere [5-8]. The NaOH solutions were standardized using primary standard potassium hydrogen phthalate (KHP).
Both NaOH and KHP were purchased from Fisher Chemical Co. Before any KHP titration, the KHP was dried at 110°C for 24 h and stored in a desiccator. A stock indicator solution of about 0.2% phenolphthalein in about 90% ethanol was prepared from reagent grade phenolphthalein. KHP was titrated to the phenolphthalein end point. Twelve runs were carried out to standardize the NaOH solution. Standard statistical treatments of the data such as the arithmetic mean, standard deviation, Ttest, and Q-test were conducted using Excel software (Table 1).
| Run Number |
Mass of KHP (g) |
Mass of KHP (mg) |
Number of millimoles |
Volume of NaOH (mL) |
Molarity of NaOH |
| 1 |
0.2174 |
217.4 |
1.064 |
8.35 |
0.1275 |
| 2 |
0.2575 |
257.5 |
1.261 |
9.85 |
0.128 |
| 3 |
0.1231 |
123.1 |
0.6028 |
4.6 |
0.131 |
| 4 |
0.2195 |
219.5 |
1.075 |
8.3 |
0.1295 |
| 5 |
0.24 |
240 |
1.175 |
9.6 |
0.1224 |
| 6 |
0.2212 |
221.2 |
1.083 |
8.05 |
0.1345 |
| 7 |
0.2235 |
223.5 |
1.094 |
9.05 |
0.1209 |
| 8 |
0.2524 |
252.4 |
1.236 |
9.9 |
0.1248 |
| 9 |
0.2784 |
278.4 |
1.363 |
10.9 |
0.125 |
| 10 |
0.1991 |
199.1 |
0.9749 |
7.6 |
0.1283 |
| 11 |
0.1912 |
191.2 |
0.9362 |
7.1 |
0.1319 |
| 12 |
0.2674 |
267.4 |
1.309 |
10.8 |
0.1212 |
| |
Average (x) |
0.1271 |
| Standard deviation (σ) |
±0.0043 |
Table 1: NaOH standardization using phenolphthalein as indicator.
Potentiometric titrations
The potentiometric titration solutions were contained in a 250 mL beaker equipped with a magnetic stirring bar. The beaker was covered with a custom made Teflon cover. In brief; the CA solution was added first followed by the addition of the Cu(SO4) solution. The total volume of the final titration solution was 100 mL. After standardization, the final concentration of the Cu(SO4) solution titrated was 0.03424 ± 0.0006 mmoles.L-1. Before each titration, the titration solution mixtures were allowed to stir for 25 min to reach equilibrium. The NaOH titrant was added in 100 μL increments using an Eppendorf micropipette with continuous stirring. The time intervals between the additions of the NaOH solution were set to 5 min, which was sufficient to get each of the pH values stabilized and reach complete equilibrium. The start pH-value was in the range of 2.5-3.0 and the final pH-value was in the range of 10.3-10.5. Each titration took about 3-4 h to complete. All titrations were conducted at room temperature.
UV-Vis spectroscopy
All UV-Vis spectroscopy measurements were conducted using a T60 high-performance spectrophotometer in connection with UVWIN software version 5.0, both purchased from Advanced ChemTech (Louisville, KY). Samples were prepared in D.I. water at 25°C. The entire UV-Vis spectrum was scanned from 250 to 1100 nm using quartz cuvettes with optical path length of 1 cm. A reference cuvette filled with D.I. water was used with all measurements as the control or as the reference sample. The concentration of the copper solution was=1.14 × 10⁻³ mol.L-1. In the case of free CA, there was no need to continue the scans beyond the visible region due to the colorless nature of the free CA solutions so that the CA solutions were scanned from 250 nm to 550 nm.
IR spectroscopy
All IR spectroscopy measurements were conducted using Nicolet iS10 spectrophotometer in connection with OMNIC software version 8.1, both purchased from Thermo Fisher Scientific (Madison, WI). Samples were prepared neat in their solid phase at 25°C. The entire IR spectrum was scanned from 400 to 4000 cm-1 using the provided attenuated total reflectance (ATR) accessory cell compartment equipped with a diamond cell that can accommodate various types of samples (solid samples as well as aqueous solution samples). The following data parameters were used in collecting the IR spectra: number of sample scans and the number of background scans was set at 32 with resolution of 4.000 cm-1, and Laser frequency of 15798.7 cm-1.
Typical IR spectra were generated in which the X-axis was given as Wavenumbers in cm-1 and Y-axis was recorded as % Transmittance which can easily be converted and displayed into absorbance by means of the OMNIC software program. Background spectra were collected prior to any sample data collection using polystyrene calibration film at which the fingerprint peaks appeared and were identified. In some cases we have also looked at the IR pattern of the fibers that makes up the lab-cleaning papers (Kimwipes). To ensure data consistency, a duplicate experiment was conducted by mixing Cu(SO4) with CA in 2:1 ratio to make sure that the observed peaks are not for Cu(SO4) that is contaminated with CA samples.
Results and Discussion
Potentiometric titrations of free CA and free metal ion (Cu(SO4))
Our collaborator and research group were the first to report, in 100% aqueous solution at 25°C, the acidity constant of the carboxylic acid functional group of CA to be pKa=4.32 ± 0.06 [3]. Figure 2 is the potentiometric titration graph of free CA. This graph contains four plots with excellent overlap.
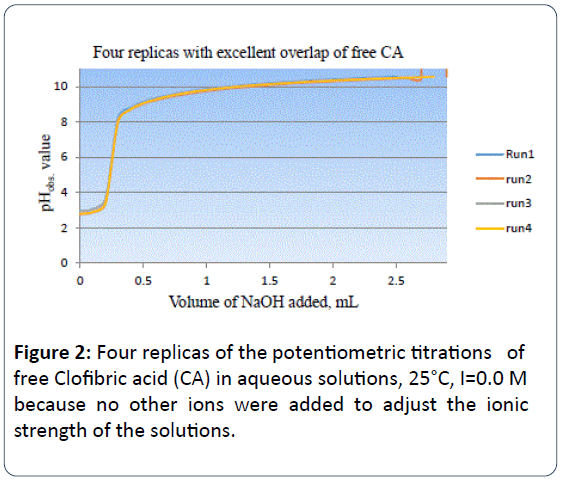
Figure 2: Four replicas of the potentiometric titrations of free Clofibric acid (CA) in aqueous solutions, 25°C, I=0.0 M because no other ions were added to adjust the ionic strength of the solutions.
Figure 3 gives the correlation of the observed pH-values (pHobs) with the potential in units of mV for the free CA titrations.
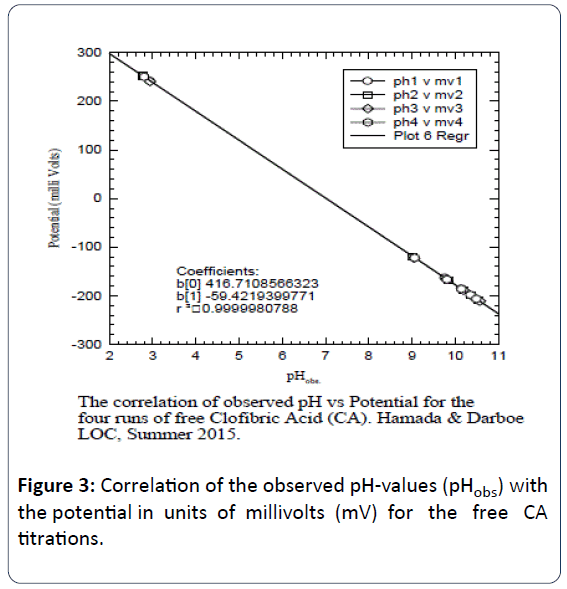
Figure 3: Correlation of the observed pH-values (pHobs) with the potential in units of millivolts (mV) for the free CA titrations.
These figures indicate the agreement with Nernst equation [12,13]. Careful searching for CA data in National Institute of Standard and Technology (NIST) databases indicated that CA data have not been report in the NIST standard reference database of critically selected stability constants of metal complexes [12].
Figure 4 is the potentiometric titration graph of free Cu2+. Three titration plots were overlapped to show data consistency.
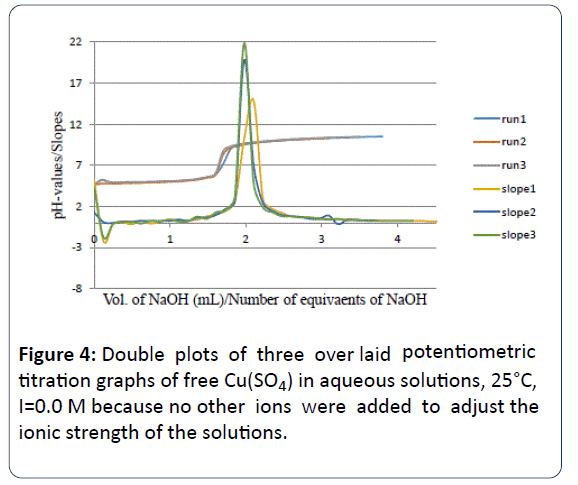
Figure 4: Double plots of three over laid potentiometric titration graphs of free Cu(SO4) in aqueous solutions, 25°C, I=0.0 M because no other ions were added to adjust the ionic strength of the solutions.
One might explain Figure 4 as the Double plots of free Cu(SO4) in aqueous solutions, 25°C, with ionic strength I of (I=0.0 M) because no other ions were added to adjust the ionic strength of the solutions. The slopes are the mathematical treatment or the first derivatives versus the number of observed equivalents of added titrant (NaOH).
After data treatment and converting the volume of titrant into number of equivalents of titrant, it is clear that a di-valnet metal ion such as Cu2+ releases a net of two proton equivalents into the aqueous solutions. This is due to the fact that metal ions in aqueous solutions under ambient conditions go through metal ion hydrolysis. This term, metal ion hydrolysis, is defined in equations 1 and 2 [13-16]. The number of equivalents is defined as the number of milli-moles of added titrant (NaOH) per number of milli-moles of Cu2+ ion present in solution.
 (First proton equivalent) (1)
 (Second proton equivalent) (2)
Potentiometric titrations of Cu2+ with CA in various molar ratios
Figure 5 is the potentiometric titration graph of the Cu2+:CA in 1:1 molar ratio. This graph contains a total of four individual plots.
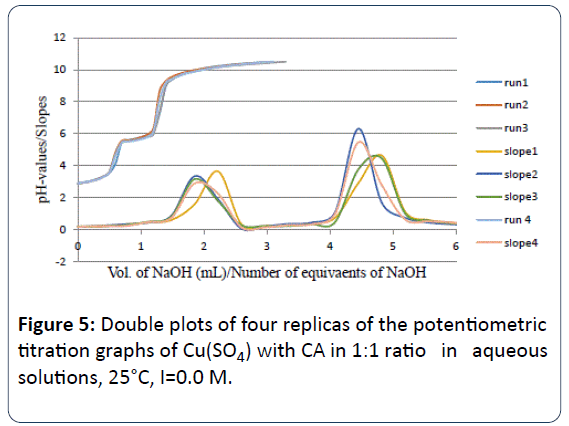
Figure 5: Double plots of four replicas of the potentiometric titration graphs of Cu(SO4) with CA in 1:1 ratio in aqueous solutions, 25°C, I=0.0 M.
This graph shows the exact locations of the inflection points. The location of each inflection point gives the exact number of protons released into the aqueous solution.
For example, the titration plots of the Cu2+:CA in 1:1 molar ratio indicated the release of three protons (3.06 ± 0.19 H+). By examining these plots in this figure, clearly there has been a strong interaction between the Cu2+ metal ion and CA due to the shift in the location of the inflection points to 3.0 equivalents; compared to 2.02 ± 0.07 equivalents in the titration of the free Cu2+ ion as shown in Figure 4.
For the Cu2+: CA in 1:1 ratio, the important point is that three equivalents of protons have been released from the reaction of Cu2+ with CA into the solutions. One proton was clearly released from the CA. The source of the other two protons must be accounted for. These two protons must come from the aqua ligand attached to the metal ion as it was explained in equations 1 and 2. It is established in the literature that such hydroxo-complexes with Cu2+ and most metal ions have been seen previously [3-14].
When we conducted the potentiometric titrations between Cu2+ and CA in 1:2 and 1:3 molar ratios, it appeared that the number of proton equivalents were 3.97 ± 0.23 and 4.70 ± 0.22 respectively. These values indicate that no matter how much CA present in solution with the copper metal ion the same type of Cu-CA species predominates. Figures 6 and 7 are showing these exact locations of the major inflection points with four and more than four proton equivalents released into solution.
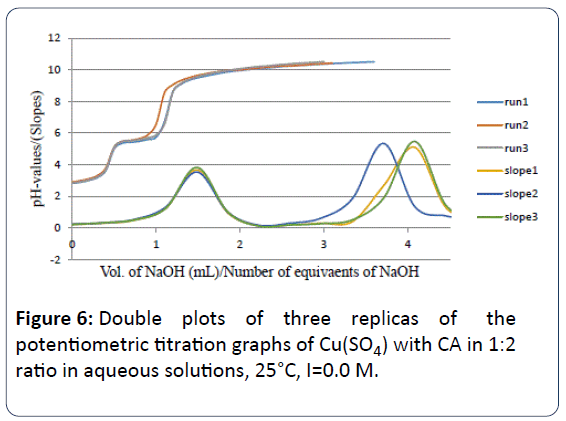
Figure 6: Double plots of three replicas of the potentiometric titration graphs of Cu(SO4) with CA in 1:2 ratio in aqueous solutions, 25°C, I=0.0 M.
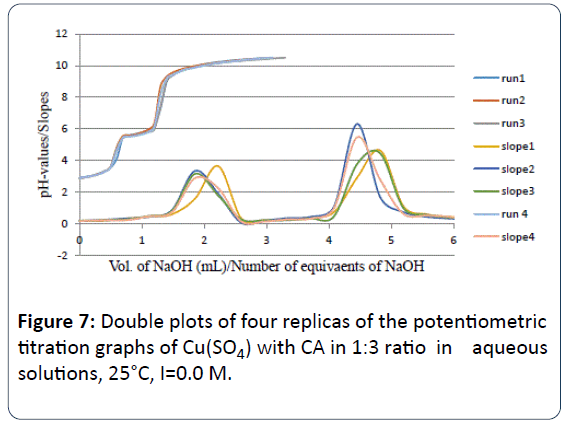
Figure 7: Double plots of four replicas of the potentiometric titration graphs of Cu(SO4) with CA in 1:3 ratio in aqueous solutions, 25°C, I=0.0 M.
The proposed and the most plausible species to be formed in solution will be the ternary copper-hydroxo-CA complex [Cu2+ (clofibrate-)(OH-)2]1-. Table 2 is the summary of all potentiometric experiments conducted in this study. This ternary copper-hydroxo-CA complex accounts for the release of three protons. When the ratio of Cu2+ to CA is 1:2 there is an extra mole of CA that releases a net of four protons (as seen in the 1:2 titrations). There is another possibility at which the bis-complex or the [Cu2+ (clofibrate-)2(OH-)2]2- can account for the release of four protons. In the 1:2 potentiometric titrations, the potentiometric techniques cannot differentiate between which complexes are formed just based on the number of protons released.
| Cu2+:CA mole ratio |
Number of runs |
Vol. (mL) of NaOH titrant (0.1271 M) |
Equivalents of NaOH titrant |
Proposed species |
Remarks |
| 1:0a |
3 |
1.62a |
2.02 ± 0.07a |
Cu(OH)2 |
Two H+ were released |
| 0:1b |
4 |
0.320b |
1.04 ± 0.04b |
[CA-COO-] |
Clofibric acid is a mono-protic acid |
| 1:1 |
4 |
0.83 ± 0.05 |
3.06 ± 0.19 |
[CuCA(OH)2] |
The ternary (Cu-CA-OH) complexes formed |
| 1:2 |
3 |
1.07 ± 0.06 |
3.97 ± 0.23 |
[CuCA(OH)2] |
The ternary (Cu-CA-OH) complexes formed |
| 1:3 |
4 |
1.24 ± 0.03 |
4.70 ± 0.22 |
[CuCA(OH)2 |
The ternary (Cu-CA-OH) complex is formed |
Table 2: Potentiometric titration data for (Cu2+, 0.03424 millimoles) with (CA 0.001835M) in different molar ratios, 25°C, I=0 M. a0.1027 millimoles of Cu2+ (3 mL × 0.03424M) were titrated to generate the free Cu2+ curve shown in Figure 5. b0.0367 millimoles Clofibric acid (20 mL × 0.001835 M) were titrated to generate the Free Clofibric acid curve shown in Figure 2.
Further studies are underway to determine which complex is predominant under this experimental 1:2 conditions (Table 2).
It is worth mentioning that above pH 6.0 in all titrations, i.e., in the 1:1, 1:2 and 1:3 titration ratios, a light green gelatinous precipitate of Cu(OH)2 formed. This indicated that the bidentate binding fashion of CA to Cu2+ is not strong enough to keep the formed complexes soluble in solutions at the physiological pH value 7.40.
Table 2: Potentiometric titration data for (Cu2+, 0.03424 millimoles) with (CA 0.001835M) in different molar ratios, 25°C, I=0 M. a0.1027 millimoles of Cu2+ (3 mL × 0.03424M) were titrated to generate the free Cu2+ curve shown in Figure 5. b0.0367 millimoles Clofibric acid (20 mL × 0.001835 M) were titrated to generate the Free Clofibric acid curve shown in Figure 2.
Electronic spectra of Cu2+ with CA in aqueous solutions
Ultra violet and visible absorption spectroscopy experiments (UV-Vis) were conducted as another tool as further confirmation for the Cu2+/CA binding. Figure 8 is Near UV, UVVis, and near IR absorption spectra of the aqueous solutions of free CA, free Cu(NO3)2, and CA/Cu(NO3)2 in 1.6 to 1 mole ratios.
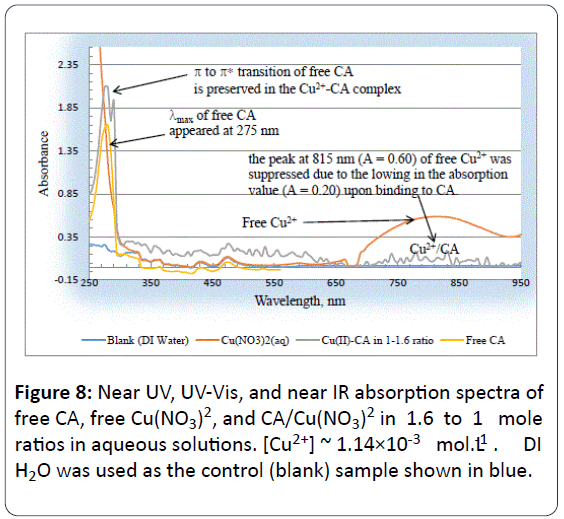
Figure 8: Near UV, UV-Vis, and near IR absorption spectra of free CA, free Cu(NO3)2, and CA/Cu(NO3)2 in 1.6 to 1 mole ratios in aqueous solutions. [Cu2+] ~ 1.14×10⁻³ mol.L-1 . DI H2O was used as the control (blank) sample shown in blue.
The molar concentration of copper solution was [Cu2+]=1.14×10⁻³ mol.L-1. DI H2O was used as the blank (control) sample. From Figure 8, one might observe that the λmax for the free CA peak appeared at 275 nm.
This peak is due to the π π* electronic transition of the pielectrons on the p-Chlorophenoxy ring of free CA. To the best of our knowledge this is the first study to report the absorption pattern of free CA in aqueous solution under ambient conditions.
It is also obvious from Figure 8 that the electronic transition for the free Cu2+ ion in aqueous solutions appeared at less energy (or at longer wavelength, λmax appeared at 815 nm) compared that for the free CA (λmax for the free CA peak appeared at 275 nm).
The maximum absorption for the free Cu2+ ion is due to the d d electronic transition [13]. When the solution of Cu2+ was mixed with that of CA in 1:1.6 ratio, the peak of Cu2+ at 815 nm (A=0.60) of free Cu2+ was suppressed due to the lowing in the absorption value to (A=0.20) upon binding to CA. The Cu2+ -CA complex had a bluish-green color.
It is well established that Cu2+ ion has a d9 electronic configuration, and the movement of the d-electrons within the visible region is responsible for the characteristic peak at 815 nm. Lowering the absorption value of this characteristic peak for copper is good evidence that CA has bound to the Cu2+ ion.
Clearly there is ligand to metal charge (or electron) transfer. Further collaborations are needed to measure the EPR pattern for the transformation of Cu2+ to Cu+.
IR spectra of Cu2+ with CA in the solid state
The characteristic IR peaks for solid phases (neat) of free CA, free Cu2+ in the form of Cu(SO4), and the homogenized mixture of both CA and Cu(SO4) were collected (Figure 9).
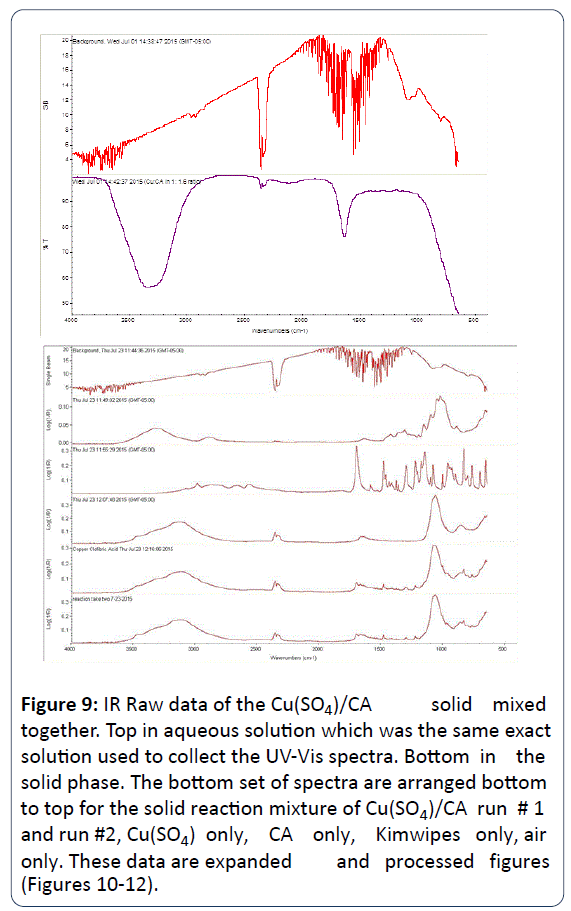
Figure 9: IR Raw data of the Cu(SO4)/CA solid mixed together. Top in aqueous solution which was the same exact solution used to collect the UV-Vis spectra. Bottom in the solid phase. The bottom set of spectra are arranged bottom to top for the solid reaction mixture of Cu(SO4)/CA run # 1 and run #2, Cu(SO4) only, CA only, Kimwipes only, air only. These data are expanded and processed f igures (Figures 10-12).
Figures 10-12 are the spectra of these neat samples respectively.
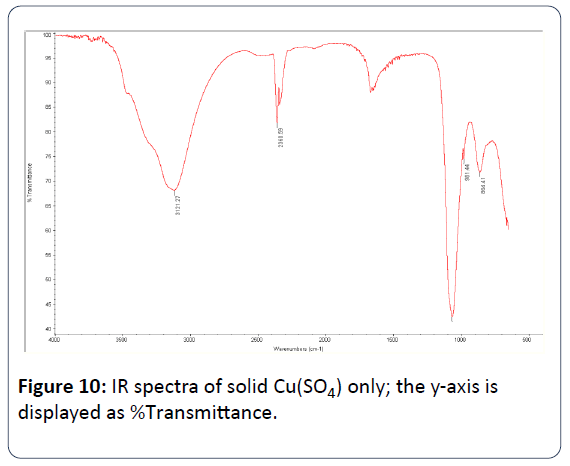
Figure 10: IR spectra of solid Cu(SO4) only; the y-axis is displayed as %Transmittance.
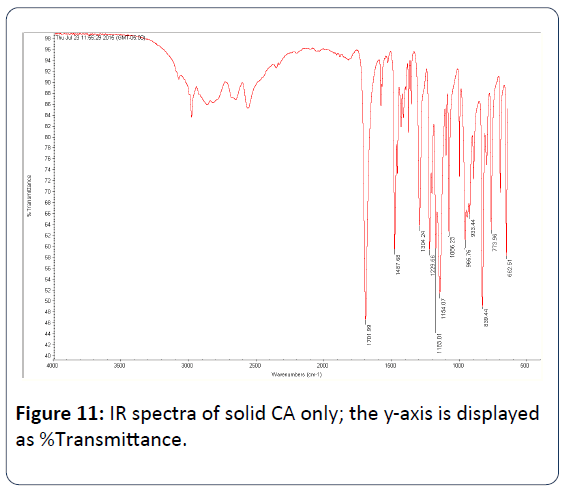
Figure 11: IR spectra of solid CA only; the y-axis is displayed as %Transmittance.
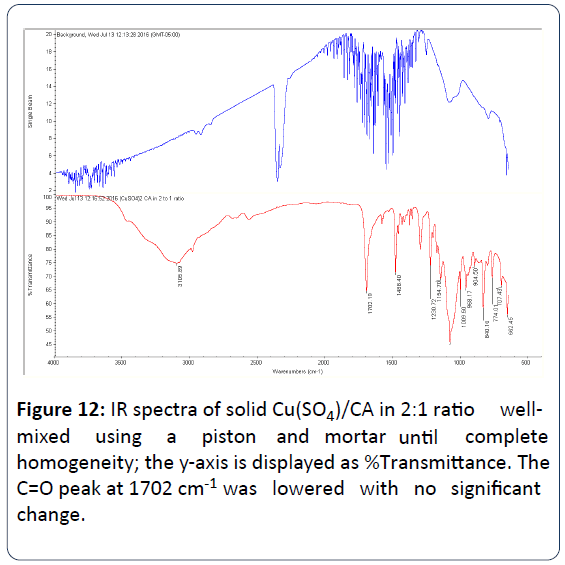
Figure 12: IR spectra of solid Cu(SO4)/CA in 2:1 ratio wellmixed using a piston and mo r t a r u n ti l complete homogeneity; the y-axis is displayed as %Transmittance. The C=O peak at 1702 cm-1 was lowered with no significant change.
Table 3 shows the selected IR-peaks for Cu(SO4), CA, and Cu(SO4)/CA.
| |
Cu(SO4)2 only |
CA only |
Cu(SO4)2/CA |
| O-H |
3121 cm-1 |
2571-2987 cm-1 |
3119.4 cm-1 |
| C=O |
- |
1702 cm-1 |
1701.4 cm-1 |
| O-H (Cu2+) |
1066 cm-1 |
- |
1069 cm-1 |
| O-H |
864 cm-1 (H2O of crystallization) |
839 cm-1 |
840 cm-1 |
Table 3: Selected IR-peaks for Cu(SO4), CA, and Cu(SO4)/CA.
Table 4 summarizes the main stretching frequency peaks that appeared in the repeated experiment of the reaction of CA and Cu(SO4). Interestingly, the very strong carbonyl peak (C=O) of the carboxylate group of the free CA that appeared at 1702 cm-1 was lowered and the peak became medium when Cu(SO4) reacted with CA. This observation is a clear evidence of the participation of the carboxylate group of CA in the chelation of the Cu2+ ion.
| Cu(SO4):CA in 2:1 ratio/Peak shape |
Wavenumbers Values of all peaks |
Assignments |
| Very broad |
3106 cm-1 |
O-H (water/acid) |
| Medium |
1702 cm-1 |
C=O |
| Medium |
1488 cm-1 |
CH3 Methyl |
| Medium |
1305 cm-1 |
CH3 Methyl |
| Medium |
1231 cm-1 |
Un-identified |
| Broad |
1155 cm-1 |
C-O-C |
| Strong |
1086 cm-1 |
C-O-C |
| Medium/Broad |
968 cm-1 |
O-H (Acid) |
| Strong |
840 cm-1 |
Aromatic |
| Broad |
774 cm-1 |
C-Cl |
| Medium |
662 cm-1 |
Aromatic |
Table 4: IR Peaks of the reaction mixture of Cu(SO4):CA in 2:1 ratio. These peaks were repeated twice to ensure data consistency.
This further confirms our proposed structures depicted in Figure 13. The very strong carbonyl peak (C=O) of the carboxylate group that appeared at 1702 cm-1 was lowered with no significant change indicating that the de-protonated - O- group of the carboxylic acid of CA is the main center of attachment and not the carbonyl C=O group.
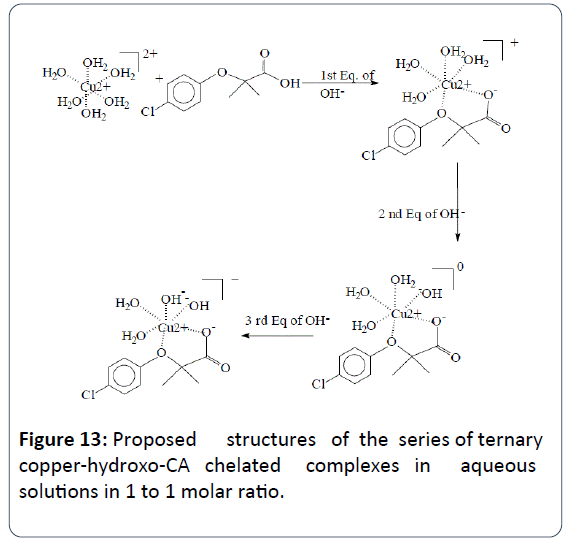
Figure 13: Proposed structures of the series of ternary copper-hydroxo-CA chelated complexes in aqueous solutions in 1 to 1 molar ratio.
A search of the databases for the IR pattern for CA revealed a simulated or a calculated (theoretical) IR pattern for free CA in the gas phase. To the best of our knowledge, these peaks for free CA and the peaks for Cu(SO4) with CA are novel and never reported before.
Close examination of the wavenumbers gathered from the IR Peaks of the reaction mixture of Cu(SO4):CA in 2:1 ratio shows that most peaks of the CA were lowered in intensity due to copper chelation. We were able to assign each observed peak to its specific functional group. The only peak that was not identified was that at 1231 cm-1. We do not know to which functional group this stretching frequency is belonging to.
Conclusion
In a recent paper in this journal, we have reported a detailed literature search which indicated the lack of research articles (experimental and theoretical) for CA with essential metal ions such as copper, iron, zinc and chromium. In another recent paper, we have demonstrated the very large number of research articles and reviews (150,000) that discussed and included copper with various organic ligands but not CA. Furthermore, NIST standard reference database of critically selected protonation constants and stability constants of ligands and their metal complexes does not contain any data for CA. In the current report, we are showing a careful and detailed experimental potentiometry work that shows that the number of proton equivalents that appeared were three and four. This indicated the formation of the ternary copperhydroxo- CA chelate complex [Cu2+ (clofibrate-)(OH-)2]1-, and the bis-chelate complex or the [Cu2+ (clofibrate-)2(OH-)2]2- respectively.
The IR has shown the participation of the hydroxyl group (O ̶ H) of the carboxylate group of CA in binding the Cu2+ metal ion. The UV-Vis spectra have showed the lowering of the characteristic peak of free Cu2+ indicated the reduction of Cu2+ to Cu+. This observation is in good agreement with the EPR data presented in literature published by Moncol et al. However, the EPR data presented by these authors were done on solid samples. Due to the fact that CA has two possible centers of attachments when it comes to chelating metal ions, we are proposing the structure of this ternary copper chelate complex in aqueous solution as shown in Figure 13. We are also proposing the aqueous solution structure for the bis-Cu2+- CA chelate complex as shown in Figure 14.
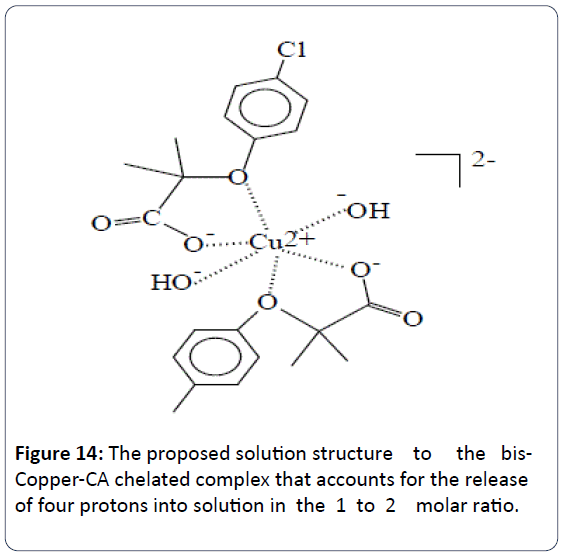
Figure 14: The proposed solution structure to the bis- Copper-CA chelated complex that accounts for the release of four protons into solution in the 1 to 2 molar ratio.
Further stability constant measurements are needed in this area and they are underway in our laboratory. Furthermore, speciation diagrams are needed to be constructed to sort out which species are the predominant at the physiological pHvalue (7.40) and which are less stable compared to other and similar bi-dentate ligands found in NIST standard reference database of critically selected protonation constants and stability constants.
Acknowledgment
We would like to acknowledge the financial support from NSF (Grant # HRD-1332459). Also we would like to acknowledge the financial support of the ACS-SEED summer program to Aishah Darboe. Special thanks go to Prof. S. Painter of Le-Moyne Owen College for her helpful suggestions.
References
- Issemann I, Green S (1990) Activation of member of the steroid hormone receptor superfamily by PPAR. Nature 347: 645-650.
- Badr M (2006) A forum for a highly important and ever-expanding field of study. PPAR Research, pp: 1-2.
- Hamada YZ, Badr MZ, Hayes J, Yates B (2016) Ternary Metal-Hydroxo Chelate of Cr3+ with Clofibric acid (CA): a Peroxisome proliferator-activated receptors-alpha (PPARa) ligand.JHeavy Met Toxicity Dis 1: 1-8.
- Moncol J, Kalinakova B, Svorec J, Kleinova M, Koman M, et al. (2004) Spectral properties and bio-activity of copper(II) clofibriates, part III Crystal structure of Cu(clofibriate)2(2-pyridylmethanol)2, Cu(clofibriate)2(4-pyridylmethanol)2(H2O) dihydrate, and Cu2(clofibriate)4(N,N diethylnicotinamide)2. Inorg Chim Acta 357: 3211-3222.
- Moncol J, Koman M, Melink M, Glowiak T (2001)Crystal and molecular structure of copper(II) (pyridine-2,6-dicarboxylato)( 2,6-dimethanolpyridine). Inorg Chem Commun 3: 262-266.
- Mak TCW, Kennard CHL, Smith G, O’Reilly EJ, Sagaty DS, et al. (1987) Phenoxyalkanoic acid interactions—XXIII. Complexes of copper(II) with the enoxyisobutyric acids. The crystal structures of tetra-µ-[2-methyl-2-(4-chlorophenoxy)propanoato-O,O')]-bis[(2-aminopyrimidine)copper(II)] and two polyaquacopper(II) tri-µ-[2-methyl-2-phenoxypropanoato-O,O']-bis[(2-methyl-2-phenoxypropanoato)copper(II)] polymorphs. Polyhedron 6: 855-861.
- Kani Y, Ohba S, Matsushima H, Tokii T (1998) A Dimeric Copper(II) 4-Chlorophenoxyisobutyrate Adduct with Methanol and a Monomeric Copper(II) 4-Chlorophenoxyisobutyrate Adduct with Pyridine. Acta Crystallogr Sec C 54: 193-195.
- Hamada YZ, Carlson B, Dangberg J (2005) Interaction of malate and lactate with chromium(III) and iron(III) in aqueous solutions. Syn Reac Inorg Met-Org Nano-Met Chem 35: 515-522.
- Hamada YZ, Holyfield H, Rosli K, Burkey TJ (2009) Equilibrium models of Cr3+ and Cu2+ with glutamate. J Coord Chem 62: 721-733.
- Hamada YZ, Carlaon BL, Shank JT (2003) Potentiometric and UV-Vis spectroscopy studies of citrate with the hexaquo Fe3+ and Cr3+ metal ions. Syn Reac Inorg Metal-Org Chem 33: 1425-1440.
- Hamada YZ, Bayakly N, Peipho A, Carlson B (2006) Accurate potentiometric studies of Chromium-citrate and ferric citrate complexes in aqueous solutions at physiological and alkaline pH-values. Syn Reac Inorg Met-Org Nano-Met Chem 36: 469-476.
- Martell AE, Smith RM, Motekaitis RJ (2001) Critical Stability Constants Database, Version 6.0, NIST, Texas A and M University, College Station, Texas, USA.
- Kettle SFA (1996) Physical Inorganic Chemistry, A Coordination Chemistry Approach, Spektrum. University Science Book, Sausalito, CA.
- Baes CF, Mesmer RE (1976)The hydrolysis of cations. Wiley and Sons, New York.
- Hamada YZ, Harris WR, Rath N (2013) Crystal Structure of Pyridoxal Amino Methyl Phosphonic Acid (PYRAMPA) and Its Stability Constants with Al3+. Int J Green Nano Tech 1: 1-8.
- Hamada YZ, Cox R, Hamada H (2015) Cu2+-Citrate Dimer Complexes in Aqueous Solutions. J Basic Appl Sci 11: 583-589.