Research Article - (2022) Volume 9, Issue 12
Constructs Influencing Performance of National Examinations Examinees: The Case of Grade Ten Amhara Regional State Students
Kidanie Aragaw Alemu*
Department of Statistics, Wollo University, Dessie, Amhara Region, Ethiopia
*Correspondence:
Kidanie Aragaw Alemu, Department of Statistics, Wollo University, Dessie, Amhara Region,
Ethiopia,
Email:
Received: 21-Jul-2022, Manuscript No. IPBJR-22-14003;
Editor assigned: 23-Jul-2022, Pre QC No. IPBJR-22-14003(PQ);
Reviewed: 06-Aug-2022, QC No. IPBJR-22-14003;
Revised: 20-Oct-2022, Manuscript No. IPBJR-22-14003(R);
Published:
27-Oct-2022, DOI: 10.21767/2394-3718.9.12.124
Abstract
Examinations are given to certify and select candidates for higher educations. The Ethiopian General
Secondary Education Certificate Examination (EGSECE) was administered for the first time at a
national level to students who completed grade 10 by the year 2001. It included 9 exams on academic
subjects. From 2001 to 2019 it was the national examinations given to grade ten students. This study
was done on grade ten student’s results that were taken the EGSECE exams in Amhara region 2001 to
2017. Year to year though the numbers of Ethiopian general secondary education certificate
examination exam sitters were increased, the relative numbers of passers were very low. The purpose
of the research was to extract the hidden risk factors affecting passers size in the region and measure
correlation between passers size and constructs. To analyze the data, we used factor analysis model.
The analysis with varimax and promax rotation methods on passers size separated by zonal area
revealed two constructs. The correlation between the numbers of national exam passers and latent
variables, and the total influences of the constructs in deteriorating passers size in the different zones
of the region were very high. Identifying constructs affect student’s performance in examinations will
help education bureaus and offices, policy makers, planners, teachers and supervisors alleviate their
influences in the future, and increase efficiency and quality of the education in the region and in the
country.
Keywords
Constructs influencing performance; EGSECE; Factor analysis; National examination
examinees; Policy makers
Introduction
Education is a process that helps to develop the social and
economic status of a given society. It is a fundamental
instrument in the poverty alleviation process of any country.
Education as an essential means for developing human
resource and proper utilization of natural resource has
becoming critical for social and economic development and
poverty reduction. As stated by Ministry of Education (MOE), education helps human beings to change as well as develop
and conserve environment for the purpose of all rounded
development by diffusing science and modern technology in
to the society and also it has great significance to understand
and respect democratic and human rights. It is a prerequisite
for personal development of an individual and economic
development of the Society as well for the country.
Examinations are given to certify completion of a program at
a satisfactory level of achievement, and select candidates for higher education, professional training, and thus, ultimately,
for employment. The prospect of the examination affects
student's motivation to achieve, influencing the quality of
his/her work; the test paper itself legitimizes the school's
course of study and shapes what teachers do in the
classroom; and the results form part of parents evaluation of
their children's schooling. While not always conclusive,
examinations have powerful influences on individual’s success
in adult life. They also serve as a gauge of the quality of a
nation's educational efforts and its workforce. Taxpayers and
politicians use the results to estimate how well national
resources have been spent, to measure the status and relative
progress of regional, social, or ethnic group relative to
another, and to compare their nation's educational level with
that of other nations (Figure 1) [1-5].

Figure 1: Structure of the Ethiopian education system 1995 to
2019.
As Figure 1 shows the education structure of Ethiopia was
composed of 3 years of pre primary education, 8 years of
primary education (1st cycle: Grades 1-4, 2nd cycle: grades
5-8), 2 years of general secondary education (grade 9-10), 2
years of preparatory secondary education, and higher
education. School year starts on the 13th of September and
ends in the first week of July. The school year is divided into 2
terms with September to January as term I and February to
July as term II. Schools are in vacation in January (2 weeks)
and in July and August (2 months). From 1998 to 2019 upon
completion of grades 8, 10, and 12, students take the
education completion certificate examinations and are
allowed to proceed to the next stage based on performance in
the examinations. The Ethiopian general secondary education
certificate examination was administered for the first time at
a national level to students who completed grade 10 by the
year 2001 on the basis of the new curriculum designed to
general secondary education (grades 9 and 10). The general
secondary education certificate examination included 9
exams on academic subjects (i.e., Amharic, English,
Mathematics, Biology, Chemistry, Physics, Geography, History,
and Civics), 4 exams on regional languages (i.e., Tigrigna, Afan
Oromo, Harari and Anguak) and 2 others on Geez and French
language. This study focusses on the number of grade 10
students sitting for and passing the Ethiopian General
Secondary Education Certificate Examination (EGSECE)
10th grade national examination, which was typically
administered in May and June of each year. For each of nine subjects in the EGSECE on which students are tested, they are
assigned a score ranging from 0.0 to 4.0. To achieve a grade of
A or 4.0 for a single subject, for example, a student’s raw
score (number of questions answered correctly) must be at
least two standard deviations above the mean score achieved
for all students in that subject. A grade of B or 3.0 would be
given to a student whose score in a subject is between one
and two standard deviations above the mean. To determine
an overall Grade Point Average (GPA), scores in English and
mathematics, which are compulsory subjects, plus a student’s
five highest scores from among the other subjects are added
and then divided by seven. That process provides an overall
composite score, which also ranges from 0.0 to 4.0. A GPA of
2.0 represents a passing score on the EGSECE (Education,
2015). The EGSECE was thus a norm referenced assessment.
Such assessments indicate how a student has performed
relative to other students taking the same test but do not
indicate whether a student has achieved a particular level of
proficiency or competence in the subjects tested. Ethiopia’s
National Educational Assessment and Examinations Agency
(NEAEA) prepared the EGSECE each year. Scores on the
examination determine receipt of a grade 10 completion
certificates as well as eligibility for advancement to grade 11
and the university track. Even though the numbers of
secondary schools and EGSECE exams sitters in Amhara
regional state have increased from year to year, the numbers
of passers in EGSECE exams were decreased from time to
time. As per Figure 2 shows the promotion rate of the
students for both sexes have a decreasing trend. In 2015 from
all students taking EGSECE only 34% were got the access to
join the upper secondary school. Even there was a school only
3 students got pass mark in their EGSECE exams to join their
preparatory program. Since it is difficult to get direct causes
from students why they failed in their national exam the
researcher tries in investigating the hidden factors that
influences the students performance in their national exam
results indirectly [6-11].

Figure 2: Time series graph of the promotion rate of grade ten
students got pass mark for the EGSECE exam in Amhara region
2001 to 2016 by student sex.
As different researchers found in their study there are
different factors that deteriorates student results. MOE
stated that “the learning environment is determining
factor for student’s performance and survival at any given educational level.” Odaga and Heneveld argue that the school
environment, teachers attitude and pedagogy, and bias in
learning materials affect the performance and attainment of
students. The instructional materials such as text books,
modules, reference books, magazines, new audio visual
(plazma) and other equipment are very crucial in facilitations
effective learning. Moreover, instructional materials are
critical ingredient in learning and the intended curriculum
cannot be easily implemented without them. Tekeste has
stated the following: In Ethiopia school teachers have no
teaching materials designed to assist them and text book
which one load to students against payment are always in
short supply in most case several students share the text
books. Effective teaching is determined by teacher’s
knowledge of subject matter and mastery of pedagogical skill
which creates positive effect on student’s academic
performance. To show the impotence of qualified teachers,
Shibeshi, Frase and Hamman, et al. have indicated the
teachers play decisive role in the fulfillment of education
goals. Gemeda and Tynjala indicate that if teachers are well
qualified, well paid, motivated respected and get opportunity
to update his/her knowledge get prepare pedagogically and
content wise, then teachers can make a difference in
student’s academic performance in classrooms and initiated
to do things with their own effort. Physical environment in
which the formal teaching learning occur ranges relatively
from modern and well equipped to open air gathering place.
The school infrastructure that significantly affect the student
academic performance includes the class rooms, offices, toilet
rooms, water supply, electricity services, technology services,
computer laboratory, science laboratory, library, staff lounges,
attractive green area, swimming pool etc. In Ethiopia,
academic freedom has not guaranteed and as in many other
countries, governmental power has been used to turn the
educational system into an institution that largely serves the
interests of state power holders. There was a lack of
transparency in academic staffing decisions, with numerous
complaints from individuals in the academic community of
bias based on party membership. Moreover, in Ethiopia
academic freedom is more precarious. Incorporating political
interests in school decision making can make the business of
school difficult to manage [12-16].
Taking the above background information about EGSECE exam
sitters and passers, and the result of different researchers into
account this research would attempt to achieve the
accompanying objective: Extracting and naming the
constructs influencing the EGSECE exam results of Amhara
regional state students separated by the different
administrative zones, and would try to address the following
research questions.
• Are there latent variables that deteriorate the numbers of
the national examination passers in the region?
• If there, what are the factors that deteriorate the numbers
of the national examination passers in the region?
• Do the factors that deteriorate the numbers of the
national examination passers in the region have the same
influence across the different administrative zones?
• Is there correlation between the numbers of the national
examination passers size and the specific constructs?
• How much is the total influences of the constructs in
decreasing the numbers of the national examination
passers size in the different administrative zones of the
region?
Conceptual Framework
Based on the literature review, students academic
performance will be studied by adopting a multiple
perspective, which implies investigating the economic,
cultural and parental factors that influence the educational
outcomes in terms of assessment result in the study area.
According to Kavuma, the education of students is affected by
different factors such as economic, social, cultural, political,
and school factors. Therefore, the factors that affect the
academic performance and performances of students can be
classified in numerous ways. Some of these factors that affect
students education are related to economic, psychological,
family related and institutional factors. Thus, the particular
research study, the relationship and the influences of the
independent variables on the dependent variable will help to
analyze the valid results. Hence, the conceptual framework
diagram of this study is indicated in Figure 3.

Figure 3: The conceptual framework of factors that affect
students performance.
Materials and Methods
Data Source
Education administration in Ethiopia is generally controlled by the ministry of education at the federal level and education bureau at the regional levels. In Amhara Region schools are controlled by Woreda education offices; Woreda education offices in turn controlled by zonal education bureaus and zonal education bureaus are controlled by regional education bureau. So, for this research the data were obtained from zonal and regional education bureaus. In addition, the researcher has got data from Amhara mass media agency (ATV) and Ethiopian Television (ETV) news.
Sampling Design
Based on the nature of the study population in this research, the researcher adopted the multi stage cluster random sampling where the stages were the administrative zones, schools and the students even if the researcher did not consider the school effects. Students were the primary units while their administrative zone where their schools found were the secondary units. All grade ten students registered to take the EGSECE exam in each year in several high schools found in the different administrative zones of the region were the sample.
Research Design
In fact, the research design is the conceptual structure within which research is conducted; it constitutes the blueprint for the collection, measurement and analysis of data. As such the design includes an outline of what the researcher will do from writing the hypothesis and its operational implications to the final analysis of data. Since the researcher has not had any intervention anything for subjects and has not made comparison between or among groups, the research design it adopts in this research is descriptive research design.
Method of Data Analysis
For this study to analyze the data the researcher has used the following statistical method.
Exploratory factor analysis: Factor Analysis (FA) was originally developed as a procedure for ‘‘disclosing’’ (discovering) unobserved traits or latent traits, typically referred to as factors, which presumably underlie subjects performance on a given set of observed variables and explain their interrelationships. These factors are not directly measurable, but are instead latent or hidden random variables or constructs, with the observed measures being their indicators or manifestations in overt behavior. Statistically, a goal of FA is to explain the manifest (observed) variable interrelationships that is, the pattern of manifest variable interrelations with as a few as possible factors. Thereby, the factors are expected to be substantively interpretable and to explain why certain sets (or subsets) of observed variables are highly correlated among themselves. Last but not least, if needed, one can also provide estimated subject scores for each of these factors, which are akin to the principal component scores and may similarly be used in subsequent statistical analyses. More specifically, the aims of FA can be summarized as follows: (a) To determine if a smaller set of factors can explain the interrelationships among a number of original variables (a similar data reduction concern as in Principal Component Analysis (PCA); (b) To find out the number of these factors; (c) To interpret the factors in subject-matter terms; as well as possibly (d) To evaluate the studied persons on the factors, by providing estimates of their individual factor scores that could be used in subsequent analyses. FA has a long history. In terms of systematic treatments, it is the English psychologist Charles Spearman who is generally credited with having developed it into a form that resembles closely the method used today in the behavioral and social sciences. The strongest impetus for the early development of FA came from psychology, in particular in connection with the study of human intelligence. Charles originally introduced the FA idea in his seminar article ‘‘general intelligence: Objectively determined and measured,’’ published in the American journal of psychology [17-18].
Model of factor analysis: A characteristic feature of FA, especially when compared to PCA, is that FA is based on a specific statistical model. Broadly speaking, a statistical model typically consists of (a) A set of equations defining formally the assumed variable relationships, and (b) Associated distributional assumptions concerning involved variables. To define the FA model, let us denote a vector of p observed variables by by X̲=(X1,X2,X3,…,Xp) '
The FA model is then defined as follows:
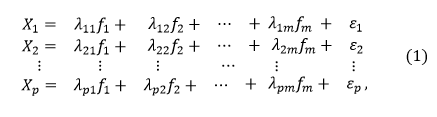
Where f1,f2…,fm (typically with m
λij are called factor loadings (viz. of the ith observed measure on the jth factor); i=1,2,…,p and j=1,2,…,m
ε1,ε2,…,εp are the error terms also occasionally called residual terms or alternatively uniqueness terms or uniqueness factors.
The error terms contain both random error of measurement and what is called variable specificity. Variable specificity comprises all sources of variance (other than pure measurement error) in the pertinent observed variable, which do not originate from the factors. Variable specificity is often also referred to as specificity factor. Its variance is the amount of variability in a given manifest variable, which is not shared with the other observed variables in the model and is unrelated to that of random measurement error for this variable.
Equations 1 in the compact form are given by:
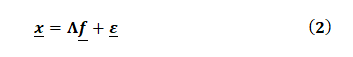
Where x̲ is the p × 1 vector of observed or manifest variables,
Λ=(λij) is the p × m matrix of factor loadings, f is the m × 1 vector of factors, and ε is the p × 1 vector of error terms assumed unrelated among themselves and with the factors in f , as well as with zero mean.
Assumption of factor analysis model: In addition ot its equations in equation we assume a) Ε(εi)=0 and Ε(fj)=0 (where Ε(.) denotes mean or expectation); (b) The two vectors ε and f of error terms and factors are uncorrelated; and (c) The covariance matrix ψ of the residuals is diagonal (i.e., no two error terms are correlated), with diagonal elements denoted Ψi
Var (εi) (with i,j=1,2,...,p or m, respectively, and Var(.) standing for variance). When it comes to testing hypotheses within the framework of FA, we also assume normality for the random variables in the model. For the development of the estimation approach underlying FA, however, it is not necessary to assume any particular manifest variable distribution.
Looking at equation 2, we see that there is no way that we could obtain directly the ƒ from the observed variables x̲ since we do not know the error terms ε. Note also that, strictly speaking, the errors are latent variables as well, since they are not directly observed or measured. We, however, keep referring to them as errors (or error terms, residuals, or uniqueness factors), to separate them from the variables of actual interest the ‘‘proper’’ latent variables collected in the vector f. In this regard, the equations in equation 3.4 and some reflection upon them reveal that there is no linear combination of the observed variables in x̲ that can furnish any factor in f. That is, the factors are not linear combinations of the observed variables.
Computer software used to analyses the data: Data analysis software is a tool that is used to process and manipulate information, analyse the relationship and correlation between the dataset by providing quality analysis like transcription analysis, discourse analysis, grounded theory methodology and content analysis, and decision-making methods using the statistical and analytical capabilities. For this research data analysis, the researcher has used excel and R software version 4.0.3.
Results
Factor analysis is one of a “data reduction” or “dimension
reduction” technique. What this basically means is that we
start off with a set of variables, and then by the end of the
process we have a smaller number but which still reflect a
large proportion of the information contained in the original
dataset. The way that the ‘information contained’ is measured
by considering the variability within and co variation across
variables, that is the variance and co variance (i.e.,
correlation). Either the reduction might be by discovering that
a particular linear combination of our variables accounts for a
large percentage of the total variability in the data or by
discovering that several of the variables reflect another latent
variable.
A factor in this context (its meaning is different to that found
in analysis of variance) is equivalent to what is known as a
latent variable which is also called a construct. A latent
variable is a variable that cannot be measured directly but is
measured indirectly through several observable variables
(called manifest variables). In this research the manifest
variables were the promoted numbers of grade ten regular
students who took the EGSECE exam in Amhara region from
2001 to 2016 separated by their administrative zone
where their schools found (Table 1).
| East Gojam |
| East Gojam |
1 |
|
|
|
|
|
|
|
|
|
|
| Awi |
0.93 |
1 |
|
|
|
|
|
|
|
|
|
| West Gojam |
0.91 |
0.95 |
1 |
|
|
|
|
|
|
|
|
| Bahir dar city |
0.51 |
0.41 |
0.56 |
1 |
|
|
|
|
|
|
|
| North Gondar |
0.9 |
0.93 |
0.85 |
0.36 |
1 |
|
|
|
|
|
|
| South Gondar |
0.82 |
0.84 |
0.87 |
0.48 |
0.83 |
1 |
|
|
|
|
|
| North Wollo |
0.35 |
0.23 |
0.36 |
0.95 |
0.21 |
0.31 |
1 |
|
|
|
|
| Waghmra |
0.81 |
0.81 |
0.83 |
0.43 |
0.83 |
0.83 |
0.29 |
1 |
|
|
|
| South Wollo |
0.5 |
0.38 |
0.49 |
0.96 |
0.37 |
0.41 |
0.97 |
0.42 |
1 |
|
|
| Oromia zone |
0.81 |
0.79 |
0.78 |
0.43 |
0.82 |
0.73 |
0.35 |
0.84 |
0.44 |
1 |
|
| Semen Shoa |
0.75 |
0.73 |
0.79 |
0.65 |
0.67 |
0.7 |
0.5 |
0.8 |
0.65 |
0.63 |
1 |
Table 1: Correlation matrix of the promoted numbers of grade ten regular students in Amhara region separated by zone their schools found 2001 to 2016.
The starting point for all factor analysis techniques is the
correlation matrix. All factor analysis techniques try to clump
subgroups of variables together based upon their correlations
and often you can get a feel for what the factors are going to
be just by looking at the correlation matrix and spotting
clusters of high correlations between groups of variables. For
this research data the correlation matrix looks like the data
given in Table 1.
Tabachnick and Fidell saying that if there are few correlations
above 0.3 it is a waste of time carrying on with the factor
analysis, clearly Table 1 shows that in this research data there
was not have that problem. While eyeballing is a valid method
of statistical analysis obviously some type of statistic,
preferably with an associated probability density function to
produce a p value, would be useful to help us make this
decision. Two such statistics are the Bartlett test of sphericity
and the Kaiser-Meyer-Olkin measure of sampling adequacy (usually called the MSA). The Bartlett test of sphericity
compares the correlation matrix with a matrix of zero
correlations (technically called the identity matrix, which
consists of all zeros except the 1’s along the diagonal). In
addition, this test compares the null hypothesis of there are
no common factors against the alternative hypothesis of there
are at least one common factor that affect the promoted sizes
of the national examinees. From this test we are looking for a
small p value indicating that it is highly unlikely for us to have
obtained the observed correlation matrix from a population
with zero correlation and this indicates that there was at least
one common factor. The MSA does not produce a P value but
we are aiming for a value below 0.5 is considered to
be miserable (Table 2).
| The overall Kaiser-Meyer-Olkin measure of sampling adequacy |
0.78 |
| Kaiser-Meyer-Olkin measure of sampling adequacy of each item |
Zone |
MSA |
| East Gojam |
0.91 |
| Awi |
0.8 |
| West Gojam |
0.82 |
| Bahir Dar |
0.82 |
| North Gondar |
0.74 |
| South Gondar |
0.86 |
| North Wollo |
0.57 |
| Oromia Liyu zone |
0.85 |
| Waghemra |
0.81 |
| South Wollo |
0.63 |
| Semen Shoa |
0.74 |
| Bartlett’s test of sphericity |
Approximate Chi-square |
degree of freedom |
P value |
| 2346.749 |
55 |
0 |
Table 2: Bartlett’s test of sphericity and kaiser-meyer-olkin measure of sampling adequacy.
The result in Table 2 shows that the research data had good
values for all variables for the MSA and the overall value was
0.78, and Bartlett’s test of sphericity had an associated P value of 0.000! So, from the above results the researcher
knew that it could now continue and perform a valid factor
analysis (Figures 4 and 5).

Figure 4: Parallel analysis scree plots.

Figure 5: Scree plot of Eigen values.
After checking that there were common latent variables
affecting the deteriorated size of the promoted numbers of
the examinee students in the region separated by administrative zone where their high schools found the
researcher has to determine how many factors need to
consider. To do this the researcher used the scree plot and the
parallel analysis. As shown in Figures 4 and 5, the
parallel analysis and the scree plot suggests that there
were two latent common variables and two components
in the year 2001 to 2016 that deteriorates the promoted
sizes of grade ten national examination examinees in the
region grouped by their administrative zones. Parallel
analysis also suggested that the number of factors were
two and the number of components were also two.
When the researcher come to factor extraction step, an initial
attempt was made to disclose one or more latent variables
that are able to explain the interrelationships among a given
set of observed variables (or measures). Although to date
there are several different algorithms like principal
component analysis, unweighted least squares, generalized
least squares, maximum likelihood, miners (ordinary least
square), principal axis factoring, alpha factoring, and image
factoring that can be used to carry out factor extraction, in
this research the researcher used the principal axis factoring
method with varimax rotation and the results are shown
in Table 3.
| Zone |
Factor loadings |
Communality |
Uniqueness |
Complexity |
| Factors |
| PA1 |
PA2 |
| East Gojam |
0.91 |
0.26 |
0.89 |
0.11 |
1.2 |
| Awi |
0.95 |
0.13 |
0.93 |
0.07 |
1 |
| West Gojam |
0.91 |
0.28 |
0.91 |
0.09 |
1.2 |
| Bahir dar city |
0.3 |
0.94 |
0.96 |
0.04 |
1.2 |
| North Gondar |
0.94 |
0.1 |
0.89 |
0.11 |
1 |
| South Gondar |
0.86 |
0.22 |
0.79 |
0.21 |
1.1 |
| North Wollo |
0.11 |
0.98 |
0.97 |
0.03 |
1 |
| Waghmra |
0.88 |
0.2 |
0.82 |
0.18 |
1.1 |
| South Wollo |
0.27 |
0.95 |
0.98 |
0.02 |
1.2 |
| Oromia Zone |
0.82 |
0.22 |
0.72 |
0.28 |
1.1 |
| Semen Shoa |
0.71 |
0.46 |
0.71 |
0.29 |
1.7 |
| Mean item complexity |
1.2 |
Table 3: Factor loadings, communalities, uniqueness and complexity of the factor model using principal axis method with varix rotation of the promoted size of grade ten students taking the EGSECE exam separated by their zonal area 2001 to 2016.
Factor loadings for the principal axis factoring are the
correlation between the specific observed or manifest variable and a specific factor. Higher values mean a closer
relationship. They are equivalent to standardized regression coefficients in multiple regressions. The higher the value of
factor loadings the better. For this research data as Table 3 tells us the deteriorated promoted size of grade ten students
taking the EGSECE exam from 2001 to 2016 in East and West
Gojam, Awi, North and South Gondar, Waghemra, and Oromia
Liyu zone had strong relationship with the first extracted
factor analysis model while the deteriorated promoted size of
the students in Bahir dar city, and North and South Wollo
zone had strong relationship with the second extracted factor.
Further Table 3 reveals that in the year 2001 to 2016 the
declined promoted size of grade ten regular students taking
the EGSECE exam in Semen Shoa zone had strong relationship
with the two factors extracted by the factor analysis model.
Communality for the principal axis factoring is the total
influence on a single observed variable from all the factors
associated with it. It is equal to the sum of all the squared
factor loadings for all the factors related to the observed
variable and this value is the same as r square in multiple
regressions. The value ranges from zero to one where 1
indicates that the variable can be fully defined by the factors
and has no uniqueness. In contrast a value of 0 indicates that
the variable cannot be predicted at all from any of the factors.
The communality can be derived for each variable by taking
the sum of the squared factor loadings for each of the factors
associated with the variable. So, as Table 3 shows for
example, for East Gojam its communality was computed as
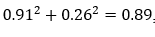
and for the other zones their communalities were similarly
calculated accordingly. These communalities tell us the
percentage of the variability of the manifest variables
explained by the latent variables. We want these values to be
as high as possible, nearer to one the better.
Uniqueness for each observed variable is that portion the
variability of the observed variable that cannot be predicted
from the latent variables. Its value is one minus communality.
Subsequently, for example, as Table 3 indicates for Semen
Shoa zone we had 1-0.71=0.29 of uniqueness and as the communality can be interpreted as the percentage of the
variability that is predicted by the model, we can say this is
the percentage of variability in a specific observed variable
that is not predicted by the model. This means that we want
this value for each observed variable to be as low as possible.
Variable complexity or complexity by row is the number of
non-vanishing entries in its associated row of a factor matrix.
Specifically, it is the number of factors describing a variable in
a particular factor solution. Turnstone indicates that one of
the objectives of factor analysis is that finding the smallest
numbers of factors for describing each variable and that
variables which are of low complexity are good indices of the
nature of a factor. For our research as Table 3 indicates
the mean item complexity was 1.2 and this showed that for
the year 2001 to 2016 on average two influencing factors
were found to predict the depreciated promoted size of
grade ten regular students taking the EGSECE exam in
the region separated by their zonal area.
Total variance explained indicates how much of the variability
in the data has been modeled by the extracted factors.
As Table 4 points out 57 percent of the variation of
the promoted size of grade ten regular students taking
the EGSECE exam separated by their zonal area in Amhara
region were explained by the first extracted factor, 30 percent
by the second extracted factor and the rest 13
percent were elucidated by the error or the
disturbance term or the uniqueness of the factor model.
Besides Table 4 reveals that 87 percent of the variations of
the deteriorated promoted size of grade ten regular
students taking the EGSECE exam separated by their
zonal area in Amhara region were modeled by the two
extracted factors. Of these 87 percent of variations 66
percent were explained by the first extracted factor and
the rest 34 percent by the second factor of the factor analysis
model.
| Extraction sums of squared loadings |
Factors |
| PA1 |
PA2 |
| Total |
6.3 |
3.27 |
| Proportion of total variance explained by |
0.57 |
0.3 |
| Cumulative proportion of total variance explained by |
0.57 |
0.87 |
| Proportion explained variance by |
0.66 |
0.34 |
| Cumulative proportion explained variance by |
0.66 |
1 |
Table 4: Total variance explained by the factor model using principal axis method with varimax rotation of the promoted size of grade ten students taking the EGSECE exam separated by their zonal area 2001 to 2016.
In giving the extracted factors meaning it is essential to use
different rotation. In this research data the researcher used
varimax and promax rotation. Varimax rotation demanded
that the factors are orthogonal while promax rotation
assumes the factors are correlated. The factor loadings with varimax rotation are shown in Table 3. As shown in Table 5 by
allowing the two latent variables to correlate which has
resulted in a correlation of 0.47 the factor loadings have
changed little.
| Factor |
Factor |
| PA1 |
PA2 |
| PA1 |
1 |
0.47 |
| PA2 |
0.47 |
1 |
Table 5: Factor correlation matrix using Principal Axis (PA) factoring method with promax rotation.
As education researcher, the researcher suggested that the
first latent variable that affected the promoted sizes of grade
ten regular students taking the EGSECE exam separated by
their zonal area in Amhara region was school factor while the
second construct was out school factor.
Discussion
Academic performance is the measurement of student’s
achievement across various academic subjects. Teachers and
education officials typically measure achievements using
classroom performance, graduation rates, and results from
standardized tests. In Ethiopia from 2001 to 2019, EGSECE
exams were one of the standardized national exams given to
grade ten students for each year, usually on the end of May or
on the beginning of June.
In the study the result by factor analysis with varimax and
promax rotation methods on the promoted size of grade ten
students taking the EGSECE exam from 2001 to 2016
separated by their zonal area in Amhara region revealed two
latent constructs, and the researcher named these two
constructs as in school and out school factors. The in school
factors that affect student’s performance include the school
environment, instructional materials, school facilities, and
characteristics of teachers. While the out school factors
influencing the students result comprises family related, socio
economic, political interference and psychological reasons.
The correlation between the numbers of national exam
passers and the latent variables and the total influences of the
constructs in deteriorating the numbers of exam passer
students in the different zones of the region were very high.
The promoted size of grade ten students taking the EGSECE
exam from 2001 to 2016 in East and West Gojam, Awi, North
and South Gondar, Waghemra, and Oromia Liyu zone were
largely affected by the first latent variable while the promoted
size of the students in Bahir dar city, and North and South
Wollo zone were highly influenced by the second extracted
factor. The study results further revealed that in the year 2001
to 2016 the promoted size of grade ten students taking the
EGSECE exam in Semen Shoa zone was strongly affected with
the two factors extracted by the factor analysis model. The
result also pointed out 57 percent of the variation of the
promoted size of grade ten students taking the EGSECE exam
separated by their zonal area in Amhara region were
explained by the first extracted factor, 30 percent by the
second extracted factor and the rest 13 percent were
elucidated by the error or the disturbance term or the uniqueness of the factor model. This implied that 87 percent
of the variations of the promoted size of grade ten regular
students taking the EGSLCE exam in the specified period
separated by their zonal area in Amhara region were modeled
by the two extracted factors. Of these 87 percent of variations
66 percent were explained by the first extracted factor and
the rest 34 percent by the second factor of the factor analysis
model. As MOE stated that “the learning environment is
determining factor for student’s performance and survival at
any given educational level.” But in Amhara region as the
Regional Bureau stated in November 2019 report disclosed by
the Ethiopian Television (ETV) news discovered only 16
percent of its schools fulfill such condition. Odaga and
Heneveld argue that the school environment, teacher’s
attitude and pedagogy, and bias in learning materials affect
the performance and attainment of students. Further Griffith
indicated both home and school environments have a strong
influence on performance of students. While Heyneman and
Loxley argued in their study school characteristics have
minimal effects on school outcomes. The instructional
materials such as textbooks, modules, reference books,
magazines, new audio visual (plazma) and other equipment
were very crucial in facilitations effective learning and to
improve the quality of education. Tekeste stated that in
Ethiopia school teachers have no teaching materials designed
to assist them and text book which one load to students
against payment were always in short supply in most case
several students share the text books. This revealed that one
of the major problems in secondary school was shortage of
instructional materials which could affect both the work of
teachers and students. In support of the previous ideas based
on the data obtained from ministry of education in inspecting
the quality standard of schools by measuring school inputs,
process and outcomes in the country, the news of Ethiopian
television on the date November 27, 2019 revealed that 84
percent of schools found in Amhara region have instructional
materials deficiency and they are below the quality standard.
School facilities in which the formal teaching learning occur
ranges relatively from modern and well equipped to open air
gathering place. The school infrastructure includes the class
rooms, offices, toilet rooms, water supply, electricity services,
technology services, computer laboratory, science laboratory,
library, staff lounges, attractive green area, swimming pool
UNICEF. According to MOE school facilities includes water
supply, latrines (male and toilet) clinical laboratory, library,
pedagogical center, and laboratory. The facilities are required
to be proportion to the number of teachers and students in
the school for the provision of quality education in schools.
However, as the report of the regional education bureau on
the date November 2019 disclosed only 16 percent of schools
found in Amhara region have fulfilled the physical facility
standard in their book and study were concluded effective
teaching is determined by teachers knowledge of subject
matter and mastery of pedagogical skill which creates positive
effect on student’s academic performance. Nevertheless, due
to in and out school infrastructures, and in efficient salary
problems, as the regional council discussion on education
quality in April 2017 presented by Amhara television in
associated with the regional education bureau pointed out
that in Amhara region most of the subjects not covered timely
and the different subjects were covered by unrelated
professionals and even if they were professional their
education level were below the standard. Transportation,
electricity utility, internet facility, household economy, status
of role models, living cost of households and employment
opportunity of graduates have had a great role on students
performance. However, in Amhara region the road, electricity
and internet utility coverage were very low, the cost of living
of households were increased, the unemployment rate of
university, college and technical school graduates were high,
and there were small numbers of university graduate
entrepreneurs. These factors directly or indirectly impacted
the EGSECE exam results of the students in the region. Further
for students in addition to their elder brothers and sisters, and
their elder neighbor university graduates their teachers were
their role models. However, because of high inflation and less
monthly salary the living standard of their teachers were very
low and the unemployment rate of university graduates in the
region were very high and such causes inversely influenced
the students psychology to obtain pleasant results in their
EGSECE exam scores. The other out school factor that affects
student’s success was political interference. Allen, Human
Rights Watch (HRW) and Bureau of Democracy Human Rights
and Labor (BoDHRL) were concluded that in Ethiopia there
were political incorporation interests in school decision
making, lack of transparency in academic staffing decisions,
and numerous complaints from individuals in the academic
community of bias due to party membership. In line with this
the regional council concluded in their meeting on evaluating
the education quality during April 2017 presented by Amhara
television in the ‘Fnote Ewqet’ program in associated with the
regional education bureau, there were political interference in
schools and academic freedom was more precarious. And this
deteriorated the quality of education in the region.
Conclusion
Examinations are given to certify completion of a program at
a satisfactory level of achievement, and select candidates for
higher education, professional training, and thus, ultimately,
for employment. The prospect of the examination affects
student's motivation to achieve, influencing the quality of
his/her work; the test paper itself legitimizes the school's
course of study and shapes what teachers do in the
classroom; and the results form part of parents' evaluation of
their children's schooling. While not always conclusive,
examinations have powerful influences on individual’s success in adult life. They also serve as a gauge of the quality of a
nation's educational efforts and its workforce. Taxpayers and
politicians use the results to estimate how well national
resources have been spent, to measure the status and relative
progress of regional, social, or ethnic group relative to
another, and to compare their nation's educational level with
that of other nations.
The performance of grade ten students taking the national
examinations in Amhara region from 2001 to 2016 revealed
the quality and internal efficiency of the education
environment were deteriorated. For this worsen performance
of grade ten Amhara Region students in their national
examination results in the specified period the study
identified correlated hidden school and out school influencing
determinants. Some of the school factors that influences the
student’s performance were the school environments,
instructional materials, school facilities, and characteristics of
teachers while the out school hidden constructs that affect
the students result comprised family related, socio economic,
political interference and psychological reasons.
The deteriorated performance of the students in the national
examinations in the year 2001 to 2016 in some administrative
zones of the region were highly affected by the former hidden
factors and some others with the later construct. The
decrement of the promoted size of grade ten regular students
taking the EGSECE exams from 2001 to 2016 in East and West
Gojam, Awi, North and South Gondar, Waghemra, and Oromia
Liyu zone had strong relationship with the first extracted
factor analysis model while the decline of the promoted size
of the students in Bahir dar city, and North and South Wollo
zone had strong relationship with the second extracted factor.
Meanwhile the deterioration of the promoted size of grade
ten students taking the EGSECE exams in Semen Shoa zone in
the specified periods had strong relationship with the two
constructs extracted by the factor analysis model.
Most of the variations of the decrement of the promoted size
of grade ten regular students taking the EGSECE exams from
2001 to 2016 in the region were explained by the two hidden
factors. 57 percent of the variation of the deterioration of the
promoted size of grade ten regular students taking the
EGSECE exams separated by their zonal area in Amhara region
were explained by the first construct, 30 percent by the
second extracted factor and the rest 13 percent were
elucidated by the error or the disturbance term or the
uniqueness of the factor model. This implied that 87 percent
of the variations of the promoted size of grade ten regular
students taking the EGSECE exam in the specified period
separated by their zonal area in Amhara region were modeled
by the two extracted factors. Of these 87 percent of variations
66 percent were explained by the first extracted factor and
the rest 34 percent by the second factor of the factor analysis
model.
There were many researches done on student’s performance
in schools. Nevertheless, in Amhara region little information
exists on hindering latent constructs that affect their EGSECE
exam results. Generating valid indicators help for policy
makers and officers who permit them for evaluation and monitoring of schools, teachers, programs, and students.
Identifying latent variables that affect student’s performance
in national examinations in the region will help education
bureaus and offices, policy makers, planners, teachers,
education supervisors, communities, and students alleviate
their influences in students’ future national exam results.
School principals, unit leaders, teachers, families and
communities are very important for the success of students in
their national exams. However, because of time and budget
constraint for this research the researcher does not collect
data from them directly. Also, budget allocated for education,
political and financial corruption, political instability of the
region, English language knowledge of students, passing cut
point of the exam in each year, drug addiction behavior of
students, students cheating behavior in exams,
unemployment rate in the region, living cost of households,
and availability of electricity and road facilities impacted the
students’ performance in their EGSECE results. Yet in this
research the researcher has not seen their direct influences.
In this research during analyzing the data using factor analysis
model since Gondar and Dessie city administrations were
started their zonal equivalence administrations in the region
in 2011/2012 the researcher ignores their effects and
included the registered, examined and promoted grade ten
students in the cities respectively in North Gondar and South
Wollo zones. Further in this research during analyzing the
data using factor analysis the researcher has ignored the time
effects, and the researcher analyze the data by adopting
indirect methods. So, for future studies the researcher
recommends other models like panel data analysis techniques
to see the time and spatial effects on the student’s national
examination results.
Acknowledgements
The researcher is particularly grateful to the Amhara region
and the zonal education bureau personnel for their
cooperation in providing the research data. The researcher
would like to express his deeper appreciation to Wollo
University for its support in providing the research fund. The
researcher’s special thanks are due to the staffs of college of
natural science for their valuable comments in the research
advancement. Finally, the researcher would like to express his
appreciations and special thanks to Mr. Yelay Birhan for his
valuable and honest grammar and spelling checks and general
comments for the manuscript betterment.
Compliance with ethical standards
Disclosure of potential conflicts of interest: No potential
competing interest was reported by the author.
References
- Charles S (1904) General intelligence: Objectively determined and measured. Am J Psychol. 15(2):201-293.
[Google Scholar][Indexed]
- Education C (2015) Evaluation of the pilot project of results based aid in the education sector in Ethiopia. Int Aid Develop. 2:1-70.
- Frase LE (1992) Maximizing People Power in Schools: Motivating and Managing Teachers and Staff. Successful Schools: Guidebooks to Effective Educational Leadership. Edu resour info center. 5:1-160.
[Google Scholar]
- Fuller B, Heyneman SP (1989) Third world school quality: Current collapse, future potential. Educ Res. 18(2):12-19.
[Crossref][Google Scholar][Indexed]
- Gemeda FT, Tynjala P (2015) Exploring teachers motivation for teaching and professional development in Ethiopia: voices from the field. Int J Sci Educ. 5(2):169-186.
[Crossref]Google Scholar][Indexed]
- Hamman D, Berthelot J, Saia J, Crowley E (2000) Teachers coaching of learning and its relation to students' strategic learning. J Educ Psychol. 92:342-348.
[Google Scholar][Indexed]
- Hebbert M (1992) Town planner as social scientist: The case of the LSE programme. Environ Plann B Plann Des. 19:403-412.
[Crossref][Google Scholar][Indexed]
- Heyneman SP, Loxley WA (1983) The Effect of Primary School Quality on Academic Achievement Across Twenty nine High and Low Income Countries. Am J Sociol. 88(6): 1162-1194.
[Crossref][Google Scholar][Indexed]
- Laura K (2003) Ethiopia: Lessons in Repression: Violations of Academic Freedom in Ethiopia. Hum Right Wat. 8:1-29.
[Google Scholar]
- Oliver M, McConney A, McConney WA (2021) The efficacy of inquiry-based instruction in science: A comparative analysis of six countries using PISA 2015. Res Sci Educ. 51:595-616.
[Google Scholar][Indexed]
- Shala A, Grajcevci A (2018) Kosovo’s low performance in PISA 2015: An explanation from a socioeconomic perspective. Int J Educ. 7:48. [Crossref][Googlescholar][Indexed]
- Dinca G (2020) Investments in Education. Bulletin of the Transilvania University of Brasov. Series V: Economic Sciences. 12:79-86.
[Crossref]Google Scholar][Indexed]
- Fernandez NG, Mediavilla M (2018) Do information and communication technologies (ICT) improve educational outcomes? Evidence for Spain in PISA 2015.
[Crossref][Google Scholar][Indexed]
- Dimiski A (2021) Factors that affect Students’ performance in Science: An application using Gini-BMA methodology in PISA 2015 dataset. Rev Econ Stud. 13:157-211.
[Crossref][Google Scholar][Indexed]
- Tang X, Zhang D (2020) How informal science learning experience influences students’ science performance: a cross-cultural study based on PISA 2015. Int J Sci Educ. 42:598-616.
[Crossref][Google Scholar][Indexed]
- Kastberg D, Chan JY, Murray G (2016) Performance of US 15-Year-Old Students in Science, Reading, and Mathematics Literacy in an International Context: First Look at PISA 2015. NCES 2017-048. National Center for Education Statistics.
[Google Scholar]
- Shala A, Grajcevci A, Latifi F (2021) Does Socioeconomic Status Influence Achievement? An analysis of the Performance of Kosovar Students on the 2015 and 2018 PISA Assessment. Int J Elem Educ. 14:393-408.
[Crossref][Google Scholar][Indexed]
- Tahirsylaj A (2021) Placing Kosovo in the didaktik-curriculum continuum: A quantitative, international comparative perspective. Issues Educ Res. 31:255-273.
[Google Scholar][Indexed]
Citation: Alemu KA (2022) Constructs Influencing Performance of National Examinations Examinees: The Case of Grade Ten
Amhara Regional State Students. Br J Res. 9:115.
Copyright: © 2022 Alemu KA. This is an open-access article distributed under the terms of the Creative Commons Attribution
License, which permits unrestricted use, distribution, and reproduction in any medium, provided the original author and source
are credited.