Keywords
Brain tumor perfusion; MRI ASL DSC
Introduction
For many years, MRI has played a central role in the diagnosis and follow-up of brain tumors. T1 weighted sequences after Gd based contrast medium have first been adopted for this purpose, as they are very sensitive for contrast leakage into the interstitial space due to blood brain barrier break down in brain tumors. Later, with the increasing evidence of the role of angiogenesis as a determining factor of tumor growth potential, perfusion weighted MRI sequences have been developed.
To assess the vascularization et angiogenesis of brain tumors, it has been proposed to use the signal drop in dynamic T2*-weighted sequences during the first pass of a paramagnetic contrast agent (Gadolinium) that was injected intravenously (Dynamic Susceptibility Contrast, DSC) [1]. DSC helps in guiding stereotactic biopsy of brain tumors and in differentiating recurrent tumor from radiation necrosis after radiation therapy [2] and facilitates the prediction of tumor progression in conjunction with histopathology [3].
Relative cerebral blood volume (rCBV) is a commonly used perfusion magnetic resonance imaging parameter for the evaluation of tumor grade. Relative cerebral blood flow (rCBF) has been less studied. Some studies showed however a strong correlation between the rCBV and rCBF [4].
Other approaches have been developed to acquire perfusion weighted MR images with no need to inject exogenous contrast medium, namely arterial spin labeling (ASL) [5-7]. This technique uses arterial blood as an endogenous tracer. ASL-based perfusion studies show consistently higher cerebral blood flow (CBF) values in high-grade than low-grade gliomas [8,9] in the same way as DSCbased perfusion studies [4,10]. A recent study showed that ASL improves the diagnostic accuracy of DSC perfusion MRI in differentiating early tumor progression from pseudoprogression, which is an increase of the contrast-enhancing lesion size followed by subsequent improvement [11]. However, ASL-based perfusion techniques have not been widely adopted in clinical practice because of their intrinsic low signal-to-noise ratio and long scan time. The growing availability of 3T scanners has given new opportunities for the development of ASL techniques, based upon the intrinsically higher signal to noise ratio and the longer tagging persistence due to increased T1 values as compared to 1.5T [12] Also, a new variant of ASL has been introduced, called pseudo-continuous ASL (pCASL), that combines the advantages of continuous ASL (CASL) and pulsed ASL (pASL): superior SNR and higher tagging efficiency ensured by a discrete RF pulse train that mimics continuous tagging, with no need for any supplementary hardware [13].
Because of its increased efficiency with respect to pulsed ASL techniques, pCASL may offer an equivalent diagnostic performance as compared to DSC in the diagnosis and follow-up of brain tumors, or at least offer a viable alternative in cases where contrast agent injection is contraindicated, for instance renal failure. To investigate this hypothesis, a few studies [3,14,15] have compared pCASL and DSC in brain tumors. In references [3] and [14], the authors found a similar lesion detection ability for pCASL and DSC, and a good correlation between pCASL and DSC quantitative perfusion parameters. Reference [3] also reports lower susceptibility artefacts with pCASL than with DSC. More recently, it has been shown that pCASL and DSC may provide globally similar but locally different measurements of CBF [15].
To date, clinical validation of pCASL and comparison with established standards has been limited to 3D FSE and GRASE variants of pCASL. No such report is available for multi-slice Echo-Planar Imaging (MS-EPI) based pCASL implementations, which offer an interesting alternative in terms of scanning efficiency. Therefore, the aim of the present study is to compare the outcomes of MS-EPI-based pCASL and dynamic susceptibility contrast imaging (DSC) at 3.0 Tesla in diagnosis and follow up of brain tumors. The comparison criteria are visual and semi-quantitative enhancement levels, as well as the severity of susceptibility artefacts.
Materials and Methods
Patients
Approval for this retrospective study was obtained from the Ethics Committee of the Hospital, “Comité d’Ethique Médicale (CEM) des Cliniques Saint Joseph”.
We reviewed 56 exams of 43 patients (21 women and 22 men with a mean age of 56 years, range 18-87 years) referred to MRI for initial diagnosis or follow up of one or more brain histologically proven tumor(s), where pCASL was applied before the routine DSC and post-GD T1-weighted sequences from February 2011 to March 2013. 5 patients had 2 exams, 1 patient had 4 exams, 1 patient had 5 exams for follow-up, and the other 37 patients only had 1 exam included in the study.
Histological analysis had been performed at stereotactic biopsy or at surgical resection according to the criteria of the WHO classification (Table 1). Tumor localisations are given in Table 2.
| Histological diagnosis-who classification |
Number of patients |
| Glioblastoma multiforme - grade IV |
16 |
| Anaplastic astrocytoma - grade III |
1 |
| Pilocytic astrocytoma - grade I |
1 |
| Pleomorphic xanthoastrocytoma -grade II |
1 |
| Subependymal giant cell astrocytoma- grade I |
1 |
| Primary CNS lymphoma |
3 |
| Hemangioblastoma- grade I |
1 |
| Metastasis |
12 |
| Meningioma- grade I (four cases) and grade II (two cases) |
6 |
| Undetermined diagnosis (lymphoma-glioblastoma) |
1 |
Table 1: Histological diagnosis and number of patients.
| Tumor Localisations |
Number of Patients |
| Frontal |
17 |
| Parietal |
7 |
| Temporal |
4 |
| Occipital |
1 |
| Multiple (parietal,occipital,brainstem,posterior fossa) |
1 |
| Intraventricular -Frontal |
1 |
| -Fronto-temporo-parietal |
1 |
| Juxtaventricular -Fronto-temporo-parietal |
1 |
| Basal ganglia -Lenticular nucleus |
1 |
| Thalamus |
1 |
| Posterior fossa |
8 |
Table 2: Tumor localisations and number of patients.
MR image acquisition and processing
All exams were performed on a Philips Achieva 3T TX MR scanner equipped with a 16-channel neurovascular coil. Pseudo-continuous arterial spin labeling (pCASL) and DSC
(Dynamic Susceptibility Contrast) imaging were performed for all the patients besides morpho-logical and contrastenhanced T1-weighted sequences.
pCASL was implemented as described in reference [8]. The label duration was 1650 ms and the post-label delay (i.e., the delay between the end of the labeling pulse and the excitation pulse) was 1600s. The acquired voxel size was 2.73 mm × 2.73 mm × 7 mm, (read, phase, slice). The field-of view was 240 mm in both in-plane directions and the number of slices was
13. A single shot gradient-echo EPI readout with TE=18 ms was used. TR was 4s, and 30 pairs of control/label images were acquired. The total scan time was 4 minutes. Postprocessing of pCASL was automatically performed by the system immediately after the acquisition. It includ-ed motion correction, cumulation of control (respectively label) images, and subtraction of the average label image from the average control image, which produced pCASL signal difference maps.
The DSC MRI was performed using a multi-slice single-shot gradient echo EPI sequence. The acquired voxel size was 2.3 mm × 2.3 mm × 4 mm (read, phase, slice). The field-of view was
230 mm in both in-plane directions, 25 slices were acquired per TR interval. TR/TE =
1663 ms/40 ms, SENSE factor=2.3, spectral fat suppression (SPIR). 40 dynamic scans were ac-quired during injection of contrast medium, being Gadobutrol (Gadovist, Bayer) or gadoterate meglumine (Dotarem, Guerbet) at a dose of 0.1 m mol /kg, and an injection rate of 5ml/sec. The scan duration was 1’07’’. rCBV and rCBF maps were generated using the Extend-ed MR WorkSpace (EWS) workstation from Philips Healthcare, according to well established methodology [16].
Qualitative evaluation
A qualitative evaluation was performed by an experienced neuroradiologist:
Maximum tumor signal enhancement was scored visually for rCBV and pCASL maps as follows: 0=no enhancement, 1=intermediate enhancement, 2=high enhancement.
The degree of susceptibility artifacts was scored for rCBV and pCASL maps as follows: 0=no artifact, 1=moderate artifact which does not affect the delineation of boundaries of the tumor, 2=high artifact which affects the delineation of boundaries of the tumor.
The correlation between rCBV and pCASL enhancement scores was assessed by a Spearman cor-relation test. The artifact level scores in rCBV and pCASL maps were compared by means of a Wilcoxon signed rank test.
Semi-quantitative evaluation
A semi-quantitative analysis was performed, correlating pCASL signal differences with DSC-based regional blood flow (rCBF) and regional blood volume (rCBV) parameters. To account for possible variations in scanner gain settings, pCASL and DSC signal ratios, i.e., normalized signal intensities, were obtained as follows:
-All images were transferred to a third-party workstation (Brain Magix - Imagilys)
-Regions of Interest (ROI’s) were drawn on color-coded rCBV maps around the area of maxi-mum enhancement in the tumor. In case of multiple enhancement areas, the region with maxi-mum rCVB was chosen.
-ROI’s were drawn in the central part of the thalamus, using all available image contrasts to avoid including any surrounding structure. Left or right thalamus was chosen such as to maxim-ize the distance to the tumor.
-The ROI’s were copied to rCBF and pCASL signal difference maps.
-Average parameters (pCASL signal difference, rCBV and rCBF) in these ROI were computed
-Signal ratios were obtained by dividing the mean value in the tumor ROI by the corresponding value in the thalamus ROI.
The correlation between pCASL- and DSC-based signal ratios was assessed by a Spearman correlation test.
Statistical analysis of both qualitative scores and semiquantitative measurements has been per-formed using the public domain package R.
Results
All tumours included in this study showed signal enhancement on post-Gd T1-weighted sequences.
Typical examples of pCASL images are shown in Figure 1 (right frontal glioblastoma) and Figure 2 (left frontal metastasis) along with corresponding rCBV maps and post-contrast 3D T1 gradient echo images.
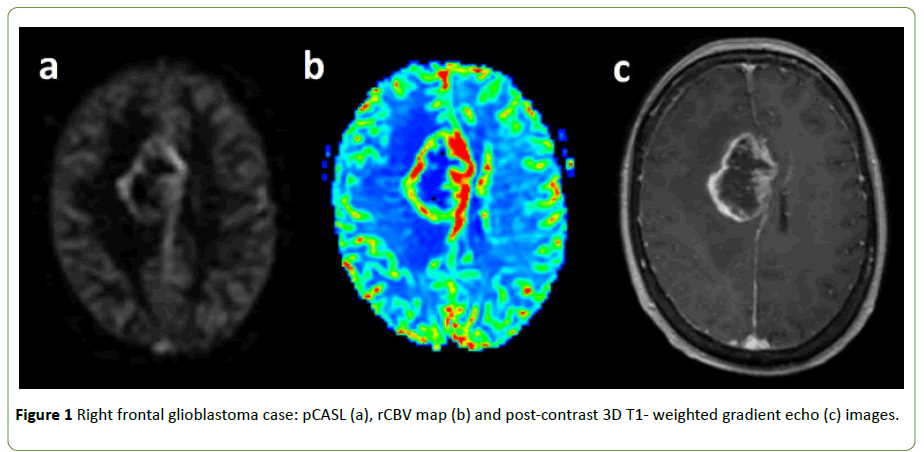
Figure 1: Right frontal glioblastoma case: pCASL (a), rCBV map (b) and post-contrast 3D T1- weighted gradient echo (c) images.
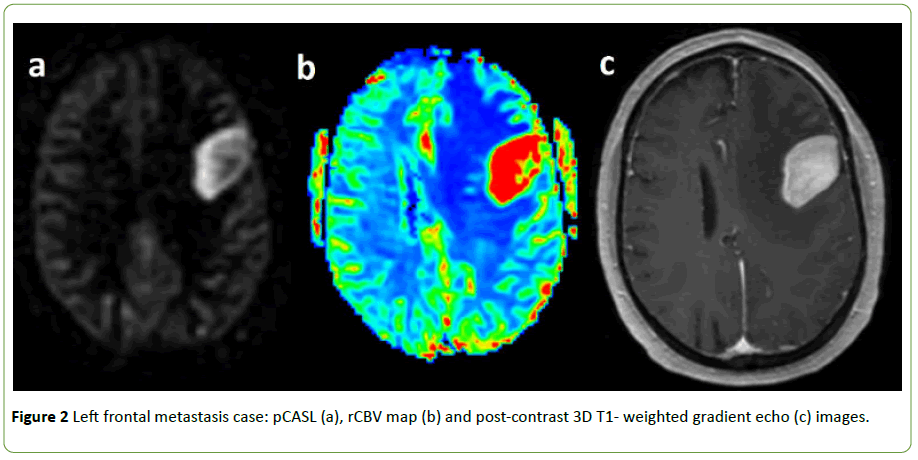
Figure 2: Left frontal metastasis case: pCASL (a), rCBV map (b) and post-contrast 3D T1- weighted gradient echo (c) images.
Qualitative evaluation
We observed similar enhancement patterns between pCASL, rCBV and rCBF maps, except in four patients: one high grade glioblastoma and three patients with a supratentorial meningioma (two meningioma grade I and one meningioma grade II). In these four cases, the hyperintensity in pCASL maps was heterogeneous, while the enhancement in rCBV and rCBF maps was homogeneous. Figure 3 illustrates of the mismatch between DSC and pCASL observed in the high-grade glioblastoma case. A shorter time-to-peak can be seen at the periphery of the tumor, which is compatible with peripheral hypointensity in the early post-contrast DSC image.
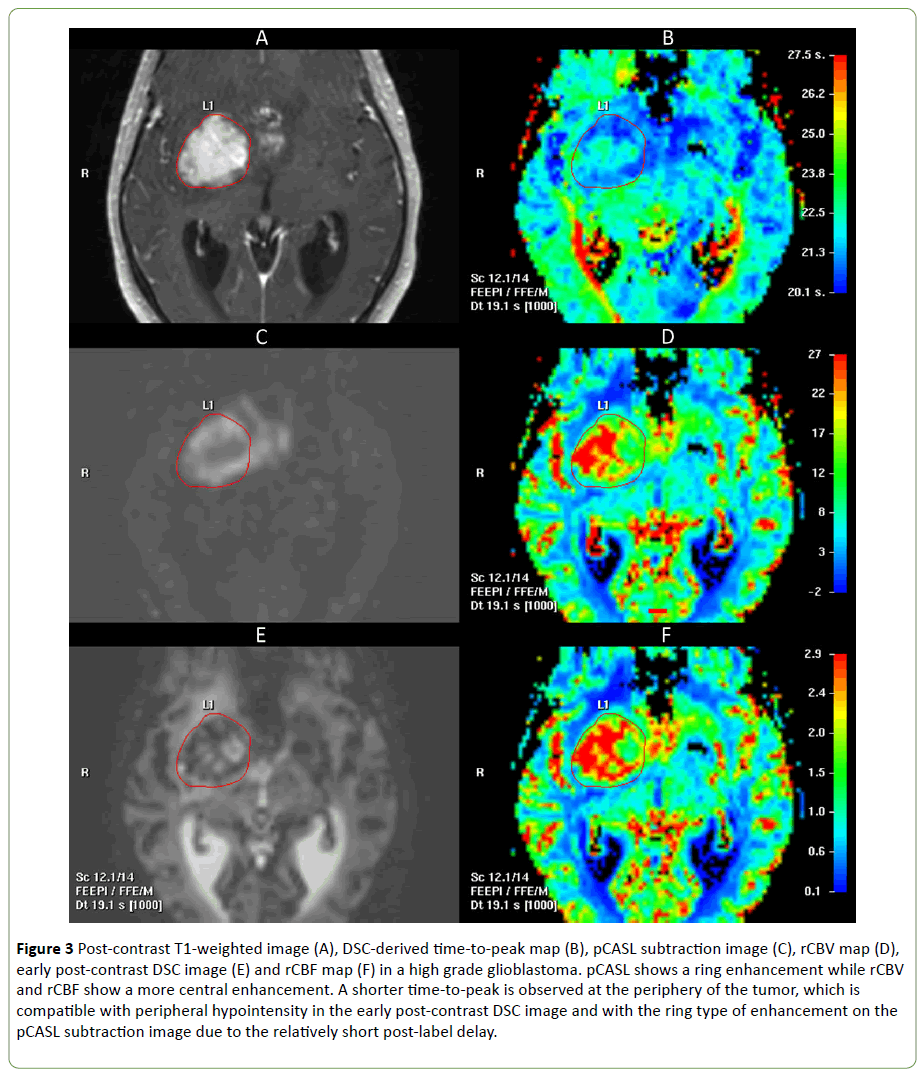
Figure 3: Post-contrast T1-weighted image (A), DSC-derived time-to-peak map (B), pCASL subtraction image (C), rCBV map (D), early post-contrast DSC image (E) and rCBF map (F) in a high grade glioblastoma. pCASL shows a ring enhancement while rCBV and rCBF show a more central enhancement. A shorter time-to-peak is observed at the periphery of the tumor, which is compatible with peripheral hypointensity in the early post-contrast DSC image and with the ring type of enhancement on the pCASL subtraction image due to the relatively short post-label delay.
Enhancement scores: Table 3 shows the distribution of visual enhancement scores, expressed as percentage of the total number of observations.
| pCASL |
rCBV |
| 0 |
1 |
2 |
| 0 |
1,8 |
8,9 |
1,8 |
| 1 |
0,0 |
17,9 |
17,9 |
| 2 |
0,0 |
1,8 |
50,0 |
Table 3: Distribution of visual enhancement scores as percent of the total number of examinations. pCASL=pseudo-continuous arterial spin labeling; rCBV=relative cerebral blood volume.
The correlation between pCASL and rCBV enhancement scores was significant at p<0.00001, with a Spearman correlation coefficient of 0.69.
Severity of susceptibility artifacts: Table 4 shows the distribution of susceptibility artifact scores, expressed as percent of the total number of observations.
| pCASL |
rCBV |
| 0 |
1 |
2 |
| 0 |
66,1 |
28,6 |
1,8 |
| 1 |
1,8 |
1,8 |
0,0 |
| 2 |
0,0 |
0,0 |
0,0 |
Table 4: Distribution of susceptibility artifact scores as percent of the total number of examinations. pCASL=pseudo-continuous arterial spin labeling; CBV=relative cerebral blood volume.
The artifact scores are significantly lower with pCASL subtraction images than with rCBV maps: p<0.001, Wilcoxon signed rank test for paired samples.
These results are well illustrated by Figure 4, showing a pCASL subtraction image and the corresponding rCBV map in a grade 1 meningioma located near the skull base. Lower susceptibility artifacts are observed in the anterior part of the tumor with pCASL than with DSC, which increases image conspicuity and allows a better evaluation of tumor extension.
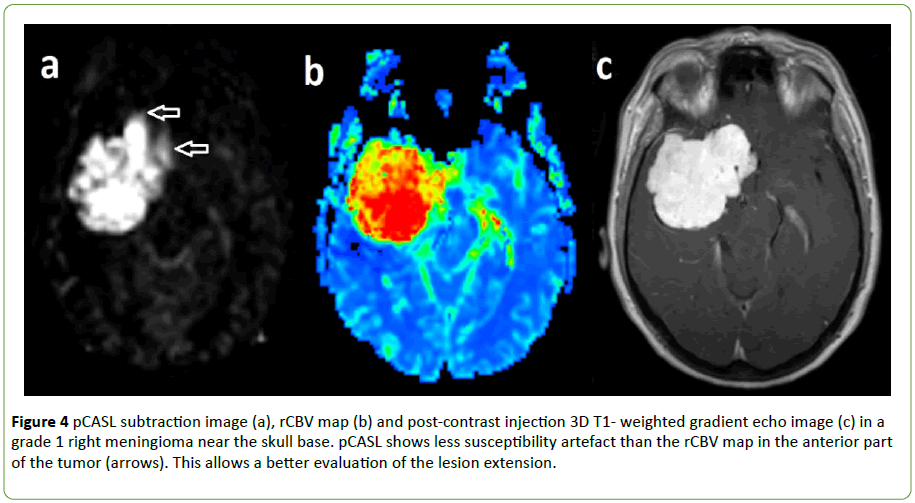
Figure 4: pCASL subtraction image (a), rCBV map (b) and post-contrast injection 3D T1- weighted gradient echo image (c) in a grade 1 right meningioma near the skull base. pCASL shows less susceptibility artefact than the rCBV map in the anterior part of the tumor (arrows). This allows a better evaluation of the lesion extension.
Semi-quantitative evaluation
Figure 3 shows the placement of the ROI in the most intense area of a high grade glioblastoma on the rCBV map and the same ROI copied to the pCASL subtraction image.
Note the difference in enhancement pattern between rCBV and pCASL maps with a more central contrast uptake displayed in the rCBV map and a more peripheral hyperintensity in the pCASL map.
Figure 5 illustrates the placement of a ROI in the thalamus for normalization purposes, as described in the Material and Methods section.
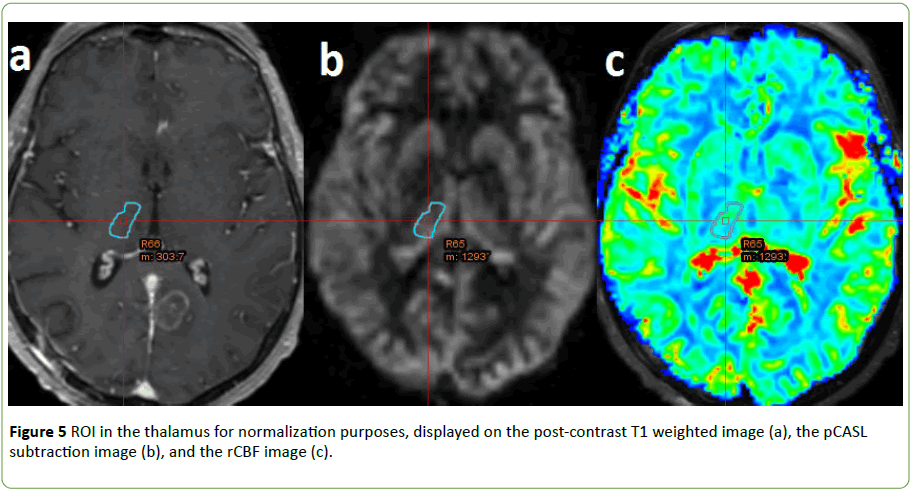
Figure 5: ROI in the thalamus for normalization purposes, displayed on the post-contrast T1 weighted image (a), the pCASL subtraction image (b), and the rCBF image (c).
We found a highly significant correlation between pCASL and CBV signal ratios: Spearman correlation coefficient 0.64, p<0.0001. We also found a highly significant correlation between pCASL and CBF signal ratios: Spearman correlation coefficient 0.68, p<0.0001, as illustrated by Figure 6.
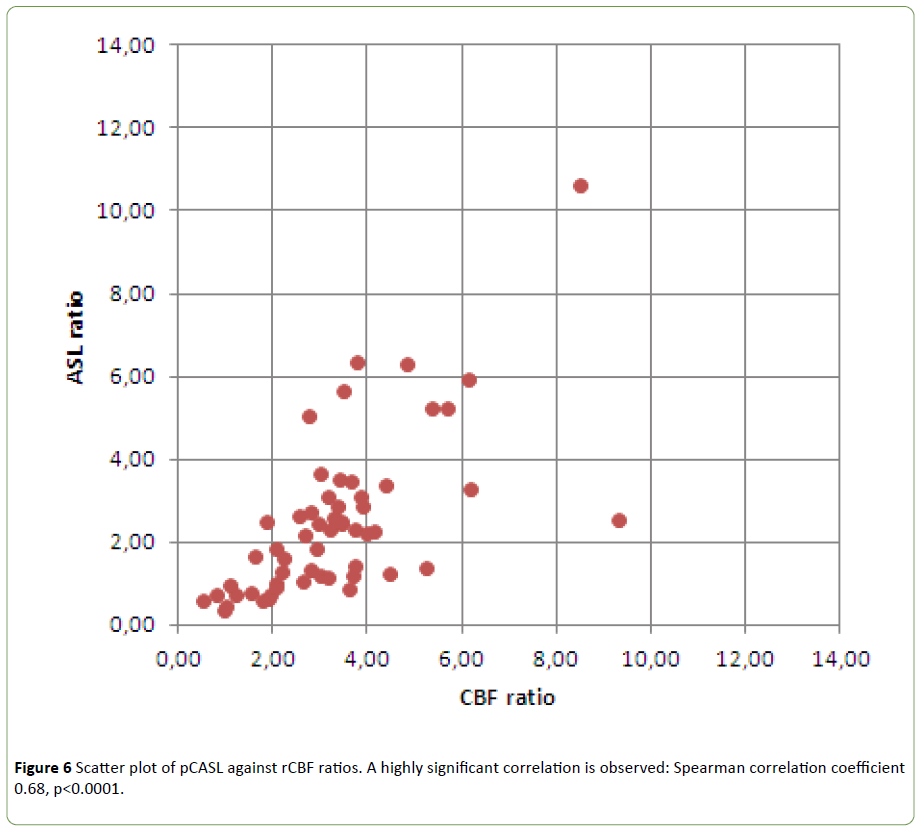
Figure 6: Scatter plot of pCASL against rCBF ratios. A highly significant correlation is observed: Spearman correlation coefficient 0.68, p<0.0001.
A Bland-Altman analysis of pCASL signal ratios and DSCbased CBF ratios (see Figure 7) revealed a mean difference of 0.79 (CBF ratios being larger than pCASL ratios). The 95% limits of agreement were -3.81 and 2.23.
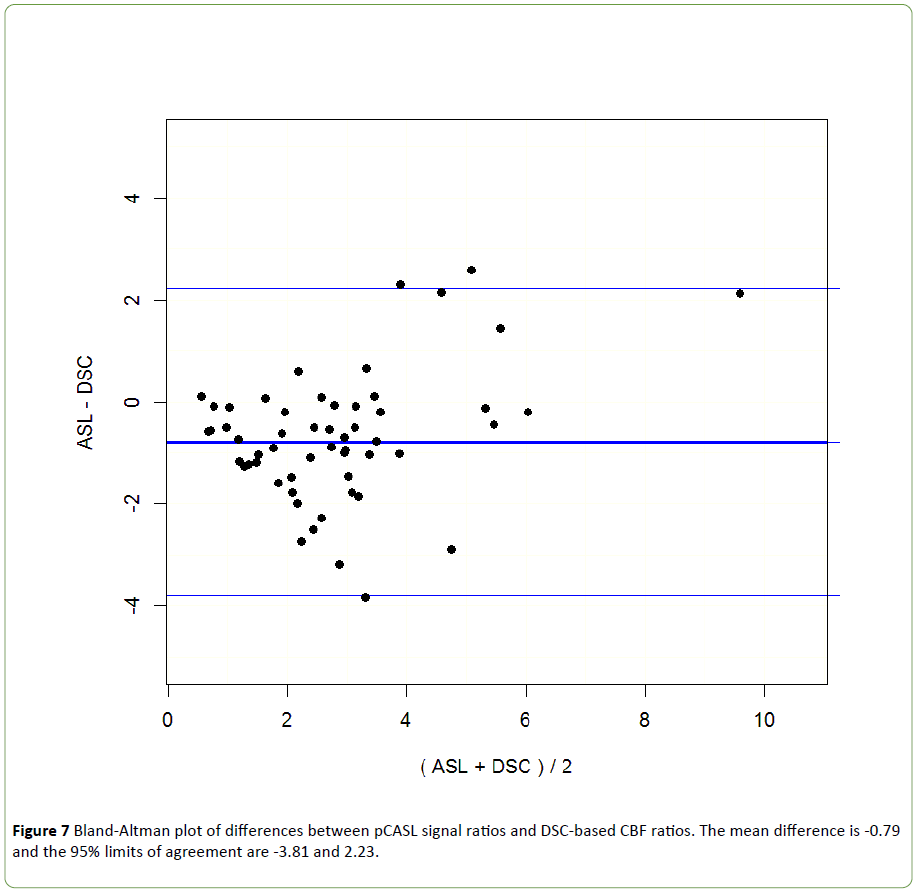
Figure 7: Bland-Altman plot of differences between pCASL signal ratios and DSC-based CBF ratios. The mean difference is -0.79 and the 95% limits of agreement are -3.81 and 2.23.
Discussion
Enhancement scores with multi-slice EPI-based pCASL significantly correlated with those observed with DSC studies, including rCBF and rCBV. These results are consistent with earlier comparative studies conducted with 3D FSE-based pCASL implementations [3,14].
Interestingly, even though our pCASL sequence uses a gradient-echo EPI readout and is therefore intrinsically more sensitive to susceptibility effects than FSE-based methods [3,14], leading to more signal loss and image distortion, we also find that susceptibility artifacts are less severe with pCASL than with DSC, especially at the base of the skull [17]. This allows a better delineation of tumors boundaries, as discussed previously in the literature [3,14]. The stronger susceptibility artefacts with DSC can be explained by the larger echo time used. A longer echo time (typically 30 ms or greater) is required for DSC imaging to ensure sufficient sensitivity to the passage of contrast agent, while the shortest possible echo time can be used for pCASL, as the source of contrast is different. This is an intrinsic advantage of the pCASL approach above DSC.
Another factor influencing susceptibility effects is voxel size, which was 52 mm3 for pCASL and 21 mm3 for DSC in this study. However, this cannot explain the difference in susceptibility effects between pCASL and DSC in our study. Indeed, if the voxel size of DSC would have matched the voxel size of pCASL, signal losses due to B0 inhomogeneity within each voxel would be even further increased in DSC as compared to pCASL. The larger voxel size of pCASL was compatible with the recent recommendations of the ISMRM perfusion study group [12] and compensates for the intrinsically lower signal-to-noise ratio of pCASL as compared to DSC.
We found a good agreement between pCASL and DSC signal ratios (CBV and CBF), similar to previous studies [3,14]. This suggests that pCASL may be an acceptable alternative to DSC in cases where no contrast agent can be injected.
Our patient population did not include any non-enhancing tumour on T1-weighted. This is a limitation of our study, as enhancement does not always correlate with tumor grade [18], so in non-enhancing tumors perfusion studies may be useful for guiding biopsies or identifying higher grade components [19]. Larger patient cohorts would allow to further study the possible correlation between pCASL and DSC in non-enhancing tumors.
The main limitation of our study is the lack of absolute quantification in our pCASL implementation. Because we used perfusion-weighted subtraction images rather than Cerebral Blood Flow (CBF) maps, the pCASL-based results are not fully comparable with DSC-based rCBF maps. This is confirmed by our Bland-Altman analysis, which shows that the pCASL signal ratio is systematically lower than the DSC-based CBF ratios. As shown in the Figure 3 example, discrepancies between the DSC-based CBF map and the pCASL subtraction image can occur in regions without any CBF elevation but presenting a shorter time-to-peak. We hypothesize that the associated hypersignal in the pCASL subtraction image results from the shorter transit time from labeling to imaging plane in these regions, and the relatively short post-label delay we have used [12]. These limitations might have been overcome by applying a model-based CBF calculation to the pCASL data [12]. However, this would have required the acquisition of additional reference data and dedicated post-processing software, while we have deliberately chosen for a short acquisition technique, as well as a simple and widely available post-processing method, making it clinically feasible. The semi-quantitative index that we have proposed may be sufficient for clinical decision purposes in focal lesions such as brain tumors, while quantitative approaches may be more useful in global diseases [12]. Note that authors who have performed a quantitative analysis [14,15] also observed lower CBF ratios with pCASL than with DSC. As quantitation modules are becoming more widely available on modern scanners, further studies should be conducted to establish whether quantitative perfusion parameters do better correlate with DSC based rCBF estimates, and possibly provide more diagnostic confidence in brain tumors.
A potential bias of our semi-quantitative analysis is the choice of the reference region. The thalamus was chosen as reference structure as it allows large homogeneous ROI’s to be drawn and presents a relatively high perfusion signal (as compared to white matter, for example), thereby ensuring reproducible measurements. The thalamus has also been chosen as reference because it is located at a distance of most of the observed tumors (see Table 2). The left or right thalamus was chosen such that the distance to the tumor is maximized. So, when the tumor was near the thalamus (1 tumor in the lenticular nucleus) or within the thalamus (only 1 case), the reference was chosen in the contralateral thalamus. However, the delineation of this anatomical structure may be complicated by the lack of contrast in the available clinical images with the surrounding structures like white matter in the internal capsule, leading to partial volume effect.
Conclusion
These results suggest that multi-slice EPI-based pCASL may be an alternative to DSC in cases where no contrast agent can be injected. pCASL provides two advantages: absence of injection of a contrast agent and reduction of susceptibility artifacts. Absence of injection of a contrast agent allows increasing the frequency of controls in patients with renal failure or at high risk of rapid tumor recurrence. Reduction of susceptibility artifacts contributes to good quality exams of some tumors near the skull base.
Our data show regional differences between DSC perfusion maps and pCASL in some patients. At least in some cases, this mismatch can be explained by the relatively short post-label delay used for pCASL in our study. However, more cases would be needed to investigate these effects in more detail.
References
- Romano A, Rossi Espagnet MC (2012) Clinical applications of dynamic susceptibility contrast perfusion-weighted MR imaging in brain tumors. Radiol Med. 117: 445-460.
- Matsusue E, Fink JR, Rockhill JK, Ogawa T, Maravilla KR (2010) Distinction between glioma progression and post radiation change by combined physiologic MR imaging. Neuroradiology. 52: 297-306.
- Järnum H, Steffensen EG, Knutsson L (2010) Perfusion MRI of brain tumors: a comparative study of pseudo-continuous arterial spin labeling and dynamic susceptibility contrast imaging. Neuroradiology. 52: 307-317.
- Hakyemez B, Erdogan C, Ercan I (2005) High-grade and low grade gliomas differenciation by using perfusion MR imaging. Clin Radiol 60: 493-502.
- Warmuth C, Gunther M, Zimmer C (2003) Quantification of blood flow in brain tumors: Comparison of arterial spin labeling and dynamic susceptibility-weighted contrast-enhanced MR imaging. Radiology 228: 523-532.
- Weber MA, Thilmann C, Lichy MP (2004) Assessment of irradiated brain metastases by means of arterial spin-labeling and dynamic susceptibility-weighted contrast-enhanced perfusion MRI: initial results. Invest Radiol. 39: 277-287.
- Weber MA, Kroll A, Günther M (2004) Noninvasive measurement of relative cerebral blood flow with the blood bolus MRI arterial spin labeling: basic physics and clinical applications. Radiologe. 44: 164-173.
- Tourdias T, Rodrigo S, Oppenheim C (2008) Pulsed arterial spin labeling applications in brain tumors : practical review. J Neuroradiol. 35: 79-89.
- Noguchi T, Yoshiura T, Hiwatashi A (2008) Perfusion imaging of brain tumors using arterial spin-labeling: correlation with histopathologic vascular density. AJNR Am J Neuroradiol. 29: 688-693.
- Shin JH, Lee HK, Kwun BD (2002) Using relative cerebral blood flow and volume to evaluate the histopathologic grade of cerebral gliomas: preliminary results. AJR Am J Roetgenol 179: 783-789.
- Choi YJ, Kim HS, Jahng GH (2013) Pseudoprogression in patients with glioblastoma: added value of arterial spin labeling to dynamic susceptibility contrast perfusion MR imaging. Acta Radiol. 54: 448-454.
- Alsop DC, Detre JA, Golay X (2015) Recommended Implementation of Arterial Spin-Labeled Perfusion MRI for Clinical Applications: A Consensus of the ISMRM Perfusion Study Group and the European Consortium for ASL in Dementia. Magn Reson Med. 73: 102-116.
- Wu WC, Fernandez-Seara M, Detre JA, Wehrli FW, Wang JA (2007) Theoretical and experimental investigation of the tagging efficiency of pseudocontinuous arterial spin labeling. Magn Reson Med. 58: 1020-1027.
- Lehmann P, Monet P, de Marco G (2010) A comparative study of perfusion measurement in brain tumors at 3 Tesla MR: Arterial spin labeling versus dynamic susceptibility contrast-enhanced MRI. Eur Neurol. 64: 21-26.
- White CM, Pope WB, Zaw T (2014) Regional and voxel-wise comparisons of blood flow measurements between dynamic susceptibility contrast magnetic resonance imaging (DSC-MRI) and arterial spin labeling (ASL) in brain tumors. J Neuroimaging. 24: 23-30.
- Rosen BR, Belliveau JW, Vevea JM, Brady TJ (1990) Perfusion imaging with NMR contrast agents. Magn Reson Med. 14: 249-265.
- Jiang J, Zhao L, Zhang S (2014) Comparative analysis of arterial spin labeling and dynamic susceptibility contrast perfusion imaging for quantitative perfusion measurements of brain tumors. Int J Clin Exp Pathol. 7: 2790-2799.
- Roy B, Awasthi R, Bindal A (2013) Comparative Evaluation of 3- Dimensional Pseudocontinuous Arterial Spin Labeling With Dynamic Contrast-Enhanced Perfusion Magnetic Resonance Imaging in Grading of Human Glioma. J Comput Assist Tomogr. 37: 321-326.
- Sahin N, Melhem ER, Wang S (2013) Advanced MR imaging Techniques in the Evaluation of Nonenhancing Gliomas : Perfusion-Weighted Imaging Compared with Proton Magnetic Resonance Spectroscopy and Tumor Grade. The Neuroradiology Journal. 26: 531-541.