Key words
wheat substitution lines, screening techniques, drought tolerance, chromosomal localization
Introduction
Drought stress currently limits wheat productivity in most of semi-arid regions and, as a result of climate change,
will increasingly affect wheat production globally. Therefore, improving drought resistance is a major objective in
plant breeding programs for rain-fed agriculture in semi-arid regions [1,2]. The most widely used criteria for
selecting high yield performance are mean yield, mean productivity (average yield performance under stress and non
stress conditions) and relative yield performance in drought-stressed and more favourable environments. Relative
yield (yield of an individual genotype under drought relative to that of the highest yielding genotype in the
population) could be used to assess the yield potential of a genotype under water stress conditions [3]. The best
criteria for finding drought tolerant genotypes in semi-arid regions are yield stability and comparison of yield in
stress and non-stress conditions, because, dispersion of rainfall is unsuitable, in these regions [4]. Genotypes can be
categorized into four groups based on their performance in stress and non-stress environments: genotypes express
uniform superiority in both stress and non-stress environments (Group A); genotypes perform favorably only in nonstress
environments (Group B); genotypes yield relatively higher only in stress environments (Group C); and
genotypes perform poorly in both stress and non-stress environments (Group D). The optimal selection criterion
should distinguish Group A from the other three groups [5]. Several drought resistance indices were proposed based
on genotypes performance in stress (Ys) and non-stress (Yp) conditions. Rosielle and Hamblin [6] defined tolerance
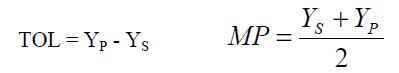
(TOL) index as the difference in yield between the non-stress and stress conditions and mean productivity (MP)
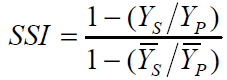
index as the yield mean of stress and non-stress environments. Fischer and Maurer (1978) proposed a stress susceptibility (SSI) index as relative yield performance in stress and non-stress conditions. Fernandez [5] defined
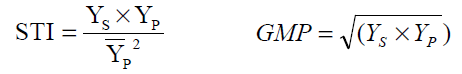
stress tolerance index (STI), which can be used to identify genotypes high performance high in stress and non stress
conditions. The geometric mean productivity index (GMP) introduced by Fernandez [5], which often used by
breeders interested in relative performance, since drought stress can vary in severity in field environment over years
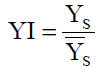
[7]. Gavuzzi et al. [8] defined yield index (YI), by genotype yield on average yield of stress condition. Other yield
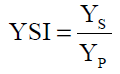
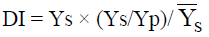
based estimates of drought tolerance are drought resistance index (DI) and yield stability index (YSI), which
introduced by Lan [9] and Bouslama & Schapaugh [10], respectively. In recent years several drought resistance
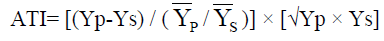
indices were suggested based on genotypes performance in stress (Ys) and non-stress (Yp) conditions, consisted of
abiotic tolerance index (ATI), stress susceptibility percentage index (SSPI) and stress non-stress production index
(SNPI) [11].
On the other hand, knowledge about the chromosomal location of QTLs controlling drought tolerance is the most
important step in breeding programs for genetic improvement of drought resistance through gene transfer. Thus, the
success of any selection based on classical and/or molecular methods for developing drought tolerant varieties
depends on our information about QTLs controlling drought tolerance. Drought tolerance is a complex trait,
expression of which depends on action and interaction of different morphological, physiological and biochemical
characters. Identification of the genes responsible for morphological and physiological traits related to drought, their
location on chromosomes and their inheritance pattern have been reported [12,2].
Genetic materials such as alien additions, substitutions, translocations, deletions, monosomes, ditelosomes, and
nullisomes are valuable genetic resources for both plant breeding and basic research [13]. Substitution lines are
justified for many purposes: 1) to study the location of the individual chromosomes or genes and determine their
effect in genotypes with different genetic backgrounds, 2) to improve the agronomic value of cultivated wheat
varieties by incorporating a character and 3) to study the hybrid vigor [14].
The objectives of the present investigation were locating QTLs controlling drought tolerance in wheat and screening
quantitative indicators of drought tolerance.
Materials and Methods
To locate QTLs controlling quantitative indicators of drought tolerance, 23 genotypes consists of 21 substitution line
series of Cheyenne (as donor) into the genetic background of Chinese Spring (as recipient) and their parents were
kindly provided from the gene bank of the Agricultural Research Institute of the Hungarian Academy of Sciences.
The experiment was conducted in a randomized complete block design with three replications under two different
environments (irrigated and rainfed) at the experimental farm of College of Agriculture, Razi University,
Kermanshah, Iran (47° 20´ N latitude, 34° 20´ E longitude and 1351.6 m altitude). Climate in the region is classified
as semiarid with mean annual rainfall of 378 mm. Minimum and maximum temperature at the research station were
-27°C and 44°C, respectively. Each replication consisted of 23 genotypes with 1.5 m length and 0.5 m wide and the
distance between two plots was 30 cm. Single seeds were planted in two rows with 25 cm distance; in other word,
harvest area was 0.75m2 per plot.
Calculation of drought tolerance indices
Drought tolerance indices were calculated based on grain yield per plot for stress (Ys), non-stress (Yp) and total
mean of grain yield for stress  and non-stress
 conditions as follows:
1- Stress susceptibility index (SSI) [15]:
2- Tolerance (TOL) and mean productivity (MP) [6]:
3- Stress tolerance index (STI) and geometric mean productivity (GMP) [5]:
4- Yield index (YI) [8]:
5- Yield stability index (YSI) [10]:
6- Drought resistance index (DI) [9]:
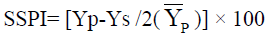
7- Abiotic tolerance index (ATI), stress susceptibility percentage index (SSPI) and stress non-stress production
index (SNPI) [11]

Statistical analysis
Analysis of variance, mean comparison using Duncan,s multiple range test (DMRT), correlation analysis between
mean of the characters measured and principal component analysis (PCA), based on the rank correlation matrix were
performed by MSTAT-C, SPSS ver. 16 and STATISTICA ver. 8.
Results and Discussion
Interrelationship among indices with grain yield
To determine the most desirable drought resistance criteria, Spearman's rank correlation between yield under stress
and non-stress conditions and indices of drought resistance were calculated (Table 1). The results indicated that MP,
STI and GMP had a significant (P<0.01) positive correlation with yield under non-stress condition, while TOL, ATI
and SSPI showed a significant (P<0.01) negative correlation. The indices SSI, MP, STI, GMP, YI, YSI, DI and
SNPI revealed a significant (P<0.01) positive correlation with yield under stress condition, therefore only three
indices MP, STI and GMP exhibited positive significant correlation with yield under both stress and nonstress
conditions. Some researchers believe in selection based on only favorable condition [16], and/or only stress
condition [8], but others have chosen a mid-point and believe in selection based on both favorable and stress
conditions [5,17]. Farshadfar et al. [18] believe that most suitable indices for selection of drought resistance
cultivars, is an indicator which has a relatively high correlation with grain yield in both conditions. Fernandez [5]
reported that MP fails to distinguish between group A and group B, but according to our results STI, MP and GMP
displayed significant correlation with each other and with Ys and Yp (Table 1; Figure 2), hence they are expected to
discriminate group A from group B and group C. Accordingly, STI, GMP and MP discriminate drought tolerant
genotypes with high grain yield under both stress and nonstress conditions (group A). The results of this
investigation were in close agreement with the findings of Fernandez [5], Farshadfar et al. [18], Talebi et al. [19] and
Nouri, et al. [20] .
Table 1. Spearman’s rank correlation between drought resistance indices and yield of stress and non-stress conditions
Assessment of drought tolerant genotypes
The results of analysis of variance for Yp, MP, STI, GMP, ATI Ys, TOL, YI, and SSPI indicated significant
differences between drought tolerance criteria (Table 2) indicating the presence of genotypic variation for indices
and yield which can be due to substituted chromosomes from donor parent (Cheyenne) into the genetic background
of recipient parent (Chinese Spring). Farshadfar et al. [2] significant differences for drought resistance indices
reported in bread wheat. The indices SSI, YSI, DI and SNPI didn’t show significant variation among genotypes.
Table 2. Mean squares for yield of stress and non-stress conditions and drought resistance indices
The results of mean comparison by LSD procedure at 5% and 1% probability levels and ranks of genotypes for
indices is given in Table 3. The results indicated that the identification of drought-resistance genotypes based on a
single index was contradictory in comparison with other indices, therefore genotype selection was done considering
correlation (Table 1) and grouping of indices regarding biplot analysis (Figure 2). The genotypes 5D, 3A, 2A, 2B, 4A
and Chinese Spring had the highest drought resistance based on SSI, TOL, DI, YSI, ATI, SSPI and SNPI, and the
genotypes 1D, 4B, 5B, 2A, 7B, 3B and 2D exhibited the most drought resistance based on GMP, STI and MP. The
genotypes 1D, 6B, 2D, 5B and 3B revealed the highest yield in non stress condition, while the highest yield in stress
condition were observed for 1D, 4B, 2A, 2B and Chinese Spring.
Table 3. Mean comparison based on yield of stress and non-stress conditions, drought resistance indices and genotypes ranks
for indices.
Ward’s hierarchical cluster analysis
Ward’s hierarchical clustering for grouping genotypes based on ranks of drought resistance indices and yield of
stress and non-stress conditions (Figure 1), confirmed the results of mean comparison, consequently based on
clustering classification four distinctive groups were identified. The first group consisted of genotypes 2A, 2B, 4B,
5B, 7B and 1D which had a desirable resistance to drought based on GMP, STI, MP and YI and the highest yield for
both stress and nonstress conditions. The second group included genotypes 3A, 4A, 5D and Chinese Spring, which
had a desirable resistance to drought based on SSI, TOL, YSI, DI, ATI, SSPI and SNPI with moderate yield in both
environments. The lowest group for measured indices and grain yield in two environments was the third group,
which consisted of 5A, 6A, 3D, 7D and Cheyenne. The fourth group displayed a moderate value for indices and
grain yield.
Figure 1. Dendrogeram of Ward’s hierarchical clustering of genotypes ranks based on drought resistance indices and yield of stress and
non-stress conditions
Biplot analysis
To better understand the relationships, similarities and dissimilarities among drought tolerance indices and
assessment of drought tolerant genotypes,, principal component analysis (PCA), based on the rank correlation matrix
was used. The main advantage of using PCA over cluster analysis is that each statistics can be assigned to one group
only [21].
Principal component analysis for two way table of genotypes ranks for drought resistance indices and grain yield in
two conditions showed that the first component explained 56.60% of the variation in the data matrix and indicated a
high correlation between Ys with all indices (except ATI) thus, the first component can be named as stress-resistant
component and it separates the stress-resistant genotypes from stress-susceptible genotypes [5]. The second
component explained 39.50% of total variability and revealed a high positive correlation between Yp with MP, GMP
and STI; therefore, the second component can be named as the yield potential component which separates the high
yielder from the low yielder genotypes [5]. Biplot for the first two components were properly explained and
confirmed the results of genotypes grouping based on cluster analysis and relationship among drought resistance
attributes with Ys and Yp (Figure 2), thus the genotypes 2A, 2B, 7B, 5B, 1D and 4B had the most desirable
performance for yield and drought resistance (group 1). The genotypes 4A, 3A, 5D and Chinese Spring displayed a desirable resistance to drought, but didn’t have a desirable production of grain yield. On the other hand, relationship
among GMP, MP, STI and YI with Ys and Yp were properly illustrated, considering the angles and the direction
between vectors of these attributes. The relationships among ATI, TOL, SSPI, SNPI, YSI, SSI and DI with Ys were
also observed by biplot.
Figure 2. Biplot of drought resistance indices in substitution lines based on two first components and grouping of genotypes
Conclusion
The overall judgement is that GMP, MP and STI are desirable indices for selection drought resistant genotypes with
high grain yield in both stress and nonstress conditions. Accordingly, genotype responses for these attributes are
similar, thus one of them can be used for genotypes selection. On the other hand, we obtained possibility of
chromosomal localization of the genes controlling drought resistance, because genetic variation for the drought
indicators can be due to substituted chromosomes from donor parent into the genetic background of recipient parent.
In addition, the results showed that most of the genes controlling quantitative criteria of drought resistance are
distributed in genome A (chromosome 2A), genome B (chromosome 2B, 4B, 5B and 7B) and genome D
(chromosome 1D).
References
- Ehdaie B, Waines JG, 1993. Crop Sci, 33: 294-299.
- Farshadfar E, Rasoli V, Teixeira da Silva JA, Farshadfar M, 2011. Aust J Crop Sci, 5 (7): 870-878.
- Ahmad R, Qadir S, Ahmad N, Hussain Shah K, 2003. Int J Agric & Biol, 5 (1): 7-9.
- Simane BP, Struik C, Nachit MM, Peacock MJ, 1993. Euphytica, 71: 211-219.
- Fernandes GCJ, 1992. In proceeding of on the sympo. Taiwan, 13–16 Aug. 1992. By: C. G. Kuo. AVRDC.
- Rosielle AT, Hambelen J, 1981. Crop Sci, 21: 943–946.
- Ramirez P, Kelly JD, 1998. Euphytica, 99: 127-136.
- Gavuzzi P, Rizza F, Palumbo M, Campaline RG, Ricciardi GL, Borghi B, 1997. Can J Plant Sci, 77: 523-531.
- Lan J, 1998. Acta Agric Boreali-occidentalis Sinica, 7: 85–87.
- Bouslama M, Schapaugh WT, 1984. Crop Sci, 24: 933-937.
- Moosavi SS, Yazdi Samadi B, Naghavi MR, Zali AA, Dashti H, Pourshahbazi A, 2008. Desert, 12: 165-178.
- Mitra J, 2001. Current Sci, 80(6): 758-763.
- Szakacs E, Molnar-Lang M, 2010. J Appl Genet, 51(2): 149-152.
- Khush GS, 1973. Cytogenetics of Aneuploids. Academic Press, New York, 301p.
- Fischer RA, Maurer R, 1978. Aust J Agric Res, 29: 897 – 912.
- Betran FJ, Beck D, Banziger M, Edmeades GO, 2003. Crop Sci, 43: 807-817.
- Byrne PF, Bolanos J, Edmeades GO, Eaton DL, 1995. Crop Sci, 35: 63-69.
- Farshadfar E, Ghannadha M, Zahravi M, Sutka J, 2001. Acta Agron Hungarica, 49(1): 59-66.
- Talebi R, Fayaz F, Naji AM, 2009. General and Appl Plant Physiol, 35(1-2): 64-74.
- Nouri A, Etminan A, Teixeira da Silva JA, Mohammadi R, 2011. Aust J of Crop Sci, 5 (1): 8-16.
- Khodadadi M, Fotokian MH, Miransari M, 2011. Aust J Crop Sci, 5(1): 17-24.