Keywords
Electrospinning; Adsorption; Chitosan/poly(vinyl alcohol) blend; Response surface methodology; Nanofibers; Phenol
Introduction
Organic pollutants have normally found in water and wastewater originating from many chemical and allied industries e.g., pesticide, paint, dyes manufacturing, petroleum refining, textile, pharmaceutical, timber, mining, paper, pulp and plastics industries [1]. Phenols and chlorinated phenols are considered as priority pollutants since they are harmful to organisms even at low concentrations [2].
Many methods including solvent extraction, catalytic degradation, biodegradation, chemical oxidation, membrane separation, and adsorption are employed for removal of phenol from wastewater [3]. However, all these technologies are energy intensive, time consuming and require post treatment that limiting their real life applications. Thus, there is a need to develop energy efficient and economical method for separation of these organic pollutants from industrial wastewater [4]. Among the available methods, adsorption is known as an efficient process for the removal of environmental pollutant such as phenol from aqueous solutions [5]. Adsorbent materials should have high erosion resistance, high thermal stability and small pore diameters, which results in higher exposed surface area and hence high capacity for adsorption.
Electrospinning is a robust and one of the most common techniques to produce fine fibers in the submicron-to-nanometer diameter range. Electrospinning technique makes use of electrostatic forces instead of mechanical forces. It involves applying an electric field between a polymeric solution and a collector. This applied electric field generates electrostatic forces at the surface of polymeric material. With the help of these forces, charged polymeric material can overcome the surface tension and able to travel from the feeding unit to the collector. When the polymer solution is used, solvent gradually evaporates and fiber forms during this movement. At the same time, fiber diameter is gradually decreased as a result of fast movement. Finally, continuous fibers are collected typically in the form of a nonwoven web.
Some of the advantages of electrospun fibers are their large surface area to volume or weight ratio and ability to provide small pore sizes in web structures. Application areas include but not limited to textile, filtration, electrical, optical, agricultural, composite, health care, biomedical, membrane technology, aerospace, defense, and security [6]. Therefore, electrospinning technique has gained great interest both from academia and from industry. Many of the studies on electrospinning have mainly focused on understanding the process-property relationship and determining optimum conditions to obtain uniform fine fibers with desired morphology and functionality from various polymers [7].
Chitosan is a polymer of the partial deacetylation of chitin, which has several valuable properties such as being nontoxic, polycationic, biocompatible and biodegradable. It is well known to be an excellent adsorbent because it contains hydroxyl (-OH) and amino (-NH2) groups that serve as metal binding sites.
However, chitosan has a low surface area, with weak chemical and mechanical properties. Therefore, physical and chemical modifications are necessary to overcome these limitations.
However, the electrospinning of chitosan due to low solubility and low mechanical properties is extremely difficult. Therefore, polymers such as poly(ethylene oxide), poly(vinyl alcohol) (PVA), cellulose, zein, poly(lactic acid), poly(caprolactone) and nylon-6 have been blended with chitosan (CS) to improve the mechanical properties and electrospinning of chitosan [8]. PVA is a non-toxic and water-soluble synthetic polymer. Because PVA has good fiber forming characteristics, many nanofibers of the blends of PVA and chitosan have been fabricated by electrospinning [9-11].
It is important to systematically investigate the effect of electrospinning parameters such a chitosan/PVA ratio, voltage, flow rate of solution and distance between needle and collector on the qualitative and quantitative characteristics of output nanofibers.
Design of experiments consist a regular program of studies that is done using statistical techniques. By applying this method, one can change the controllable inputs systematically and assess their effects on the output parameters [12]. Among different approaches, central composite design (CCD) is an appropriate experimental design method which provides high quality predictions in studying linear, quadratic and interaction effects of parameters that influence a system. Furthermore, one of the efficient techniques for obtaining the optimum conditions in a multivariable system is response surface methodology (RSM) [13]. Furthermore, one of the efficient techniques for obtaining the optimum conditions in a multivariable system is response surface methodology (RSM) [14].
In the present study, chitosan/PVA nanofibers were prepared by the electrospinning method to use as adsorbent for the removal of phenol from aqueous solutions. The effects of processing factors such as voltage, flow rate of solution injection, distance of needle to the collector, and volumetric ratio of chitosan/PVA have been investigated using response surface methodology to obtain the maximum adsorption capacity of phenol pollutant.
Materials and Methods
Materials
Chitosan (Medium Molecular Weight), ACS grade Acetic acid (CH3COOH) and Glutaraldehyde solution grade I, 25% water were purchased from Sigma-Aldrich Chemical Co. Poly(vinyl Alcohol) (Mw=120000) was obtained from Samchun Chemical Co., Ltd. (South Korea). Phenol, Sodium hydroxide (NaOH) and sulfuric acid (H2SO4) was obtained from Merck Company. All reagents were used without further purification, and all the aqueous solutions were prepared using deionized water.
Measurement of viscosity
The molecular weight of the chitosan and the hydrolyzed chitosan were measured using viscometer. Chitosan solutions in a NaCl 0.2 M + AcOH 0.1 M solvent system were prepared in three different concentrations of 0.001, 0.0005 and 0.00025 g L-1 for each sample. The dropping times of solvent and chitosan solutions through an Ubbelohde capillary tube were considered to be t0 and t1 respectively. The intrinsic viscosity was calculated using eqn. (1) extrapolated at C=0. This equation gives the reduced viscosity. Plotting the measured reduced viscosity against concentration provides a linear graph, intercept of which can be considered to be intrinsic viscosity:
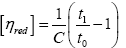 (1)
(1)
According to the Mark-Howink equation 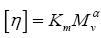 where Km and α are the constants for the selected solvent system and are equal to 1.8 × 10³ g/mol and 0.93, respectively. The molecular weight of used chitosan achieved 3.97 × 10⁵ g mol-1 [15].
Electrospinning of chitosan/PVA solution
Electrospinning solutions were prepared by dissolving PVA (1.5 g) in 10 mL aqueous acetic acid solution (90% v/v). The solutions were stirred at 70°C until PVA completely dissolved. Then 0.6 g hydrolyzed chitosan was dissolved in another 10 mL aqueous acetic acid solution (90% v/v). After cooling the PVA solution to room temperature, then these two solutions were mixed for additional 24 h. The final solution was loaded to a 1 mL plastic syringe with a needle tip (23 gauge=0.337 mm inner diameter). For, which were controlled by a micro syringe pump. Formed chitosan/PVA blend nanofiber was kept at room temperature for 2 min before being peeled off from the aluminum foil.
Crosslinking process
After electrospinning, the collected nanofibers on the foils were pasted on the wall of desiccator, and then a petridish containing glutaraldehyde was placed at the bottom of the desiccator and kept at 40°C. Four time intervals of 1, 3, 5 and 7 h were selected to optimize the degree of crosslinking of nanofibers. After every time intervals, the samples were weighted and then kept in distilled water for 72 h. Then, the samples were brought out from distilled water, dried and weighted again. Each experiment was performed in triplicates (Table 1).
Table 1: The amount of crystal diameters for adsorbent a) before and b) after crosslink.
β=4.5°=0.153 rad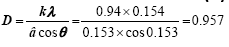 (a) (a) |
β=2°=0.0348 rad (b) (b) |
Experimental design
For which pollutants designed experimental models included 26 experimental trials. After performing a set of experiments to obtain outputs according to the experimental designs, the next step was to consider the vectors of variables (X) as can be seen in Table 2. A quadratic model, the complicated model that can be fit is the two-factor interaction model defined by:
Table 2: The variables and their levels for the central composite experimental design.
| Factor |
Name |
Units |
Min |
Max |
| X1 |
Volumetric ratio (Chitosan/PVA) |
---- |
25/75 |
75/25 |
| X2 |
Voltage |
kv |
15 |
30 |
| X3 |
Flow rate |
mL/h |
1 |
2 |
| X4 |
Distance |
cm |
10 |
20 |
 (2)
(2)
Single and double coefficients (β) and corresponding response (Y) developing an appropriate model. The response function representing the adsorption and independent input variables can be expressed as:
 (3)
(3)
Where Y=Adsorption is the desired response and f is the response function of A=flow rate of solution, B=voltage, C=distance between needle and collector, and D=Chitosan/PVA volumetric ratio. The polynomial regression equation (quadratic model) has been used to represent the response surface for the factors.
Phenol removal experiments
All batch experiments were carried out in 10 mL aqueous solution using 0.05 g blend nanofibers as adsorbent. Concentration of phenol in all samples was 50 ppm. They were performed statically at room temperature and shaking at 120 rpm. The concentration of phenol was determined using UV-vis spectrgraphy (Rayleeih UV-2601) model with quarts cells and λ=268.
Amount of pollutant adsorbed, qt (mg g-1), at time t and the percentage removal of pollutant were calculated using the following equations:
 (4)
(4)
Where C0 (mg L-1) is the initial concentration of pollutant, Ct (mg L-1) is the concentration of pollutant at time t, W is the weight of the adsorbent used (g), and V is the volume of pollutant’s solutions (L).
Optimization of adsorption parameters
Because of this journal is a polymer journal tried to decrease adsorption discussion and increasing the polymeric parts. For best adsorption after optimizing electrospinning parameters, three parameters of most important of adsorption such as pH, initial concentration and dose of adsorbent were optimized.
Characterization of prepared CS/PVA blend nanofibers
Scanning electron microscope (SEM) analyzing: The morphology of the nanofibers was examined using scanning electron microscope, SEM (TESCAN-VEGA3 SBU-Easy Probe model made in Czech Republic). Nanofibers diameter distribution was calculated using the Image J software from the SEM images. In order to obtain more reliable data, by microstructure measurement software, 60 points of each sample were analyzed and the average diameters were calculated.
Fourier transform infrared spectroscopy (FTIR) Analysis: Fourier transmission infrared spectroscopy, FTIR spectra (Tensor 27 model made in Germany) were measured at room temperature on the chitosan powder, PVA crystal, Chitosan/PVA blend nanofibrous mats and crosslinked Chitosan/PVA blend nanofibrous mats using Perkin Elmer 65 FTIR-ATR instrument. A total of scans were accumulated for the signal-averaging of each IR spectral measurement. The spectra of the samples were recorded over a wavenumber range of 600-4000 cm-1.
X-Ray diffraction analysis: X-ray diffraction technique is a powerful tool to analyze the crystalline nature of the materials. If the material under investigation is crystalline, well-defined peaks are observed while non-crystalline or amorphous systems show a hallow instead of well-defined peak [16]. As can be seen in Figure 1 it appears from the XRD pattern that both chitosan and PVA are crystalline in nature and show sharp peaks corresponding to 2θ=20 and 41.68 [17]. But after crosslinking (Figure 2c and 2d) and after adsorption the peaks were broad. Figure 2 shows the adsorption happened on the XRD patterns of nanofibers are characterized by a very distinct peak at around 20°. The average size of grains has been obtained from the X-ray Diffraction pattern by use of the Scherrer’s formula [18].
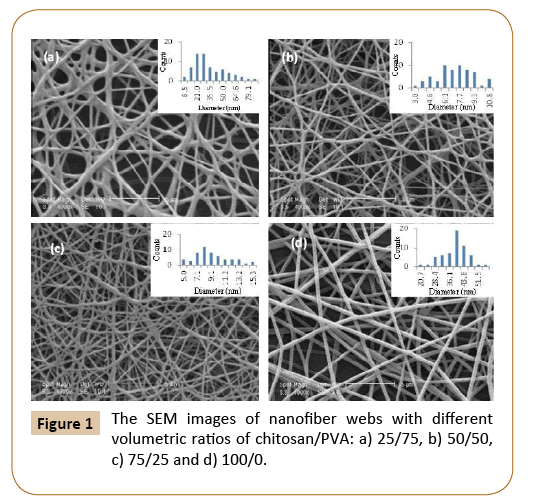
Figure 1: The SEM images of nanofiber webs with different volumetric ratios of chitosan/PVA: a) 25/75, b) 50/50, c) 75/25 and d) 100/0.
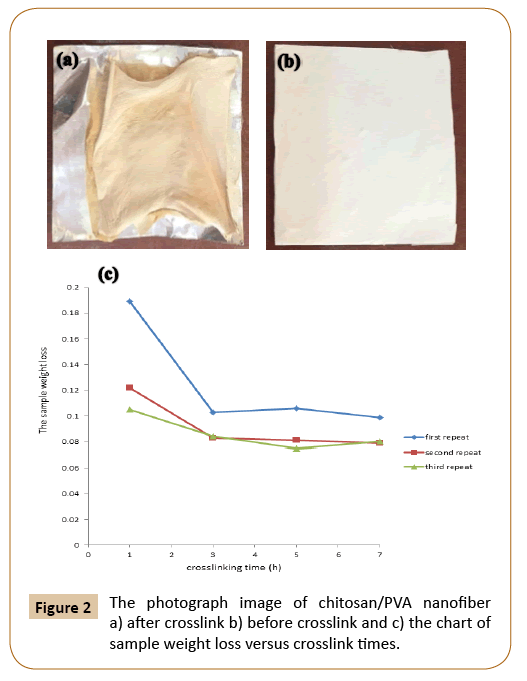
Figure 2: The photograph image of chitosan/PVA nanofiber a) after crosslink b) before crosslink and c) the chart of sample weight loss versus crosslink times.
 (5)
(5)
Where D is the distance between crystalline pages, k and λ are constants equal to 0.94 and 0.154, respectively. β is the full width at half maximum (FWHM) of the X-ray. As a result the crystallinity structures of these materials are decreasing, where amorphous diffraction peaks at 2θ=20° are indicating that crosslinking process of chitosan/PVA.
Thermo gravimetric Analysis: TGA was performed using a TGA/ SDTA 851e (Mettler Toledo) apparatus. Between 1 and 2 mg of sample was put in a ceramic pan, and measurements were performed by heating from 30°C to 800°C at 10°C min-1 under air atmosphere.
Results and Discussion
Determination of nanofiber diameter and morphology
All the samples were studied using SEM to determine their morphology and diameter distribution. Fibers were not formed for samples with 100% chitosan. Figure 3 shows of chitosan/ PVA. As can be seen in Figure 3 the diameter that shown by morphology of electrospun fibers were expected to be seriously decreased when the volumetric ratio of chitosan/PVA increased. Chitosan is a cationic polysaccharide with amino groups at the C2 position that are ionizable under acidic or neutral pH conditions. This polymer caused a higher charge density on the surface of the ejected jet that is formed during electrospinning. As the charges carried by the jet increase, higher elongation forces are imposed on the jet under the electrical field. It is known that the overall tension in the fibers depends on the self-repulsion of the excess charges on the jet. Thus, as the charge density increased, the diameter of the final fibers became smaller. The beads in mats occurred when the content of chitosan in the blended solution increased to 50% (Figure 3b). The nanofibers diameter in webs reduced and more beads were formed when the chitosan ratio in the blended solution increased to 75 wt% (Figure 3c). The diameter gradually decreased with increasing chitosan content in the blend, and more beads were obtained in the blend. This indicates that the repulsive forces between ionic groups in the chitosan backbone obstructed the formation of continuous fiber during electrospinning [19]. Therefore, the morphology and diameter of electrospun fibers were expected to be seriously affected by the volumetric ratio of chitosan/PVA. Generally Maximum fiber length and fiber diameter increased with increasing polymer concentration [15].
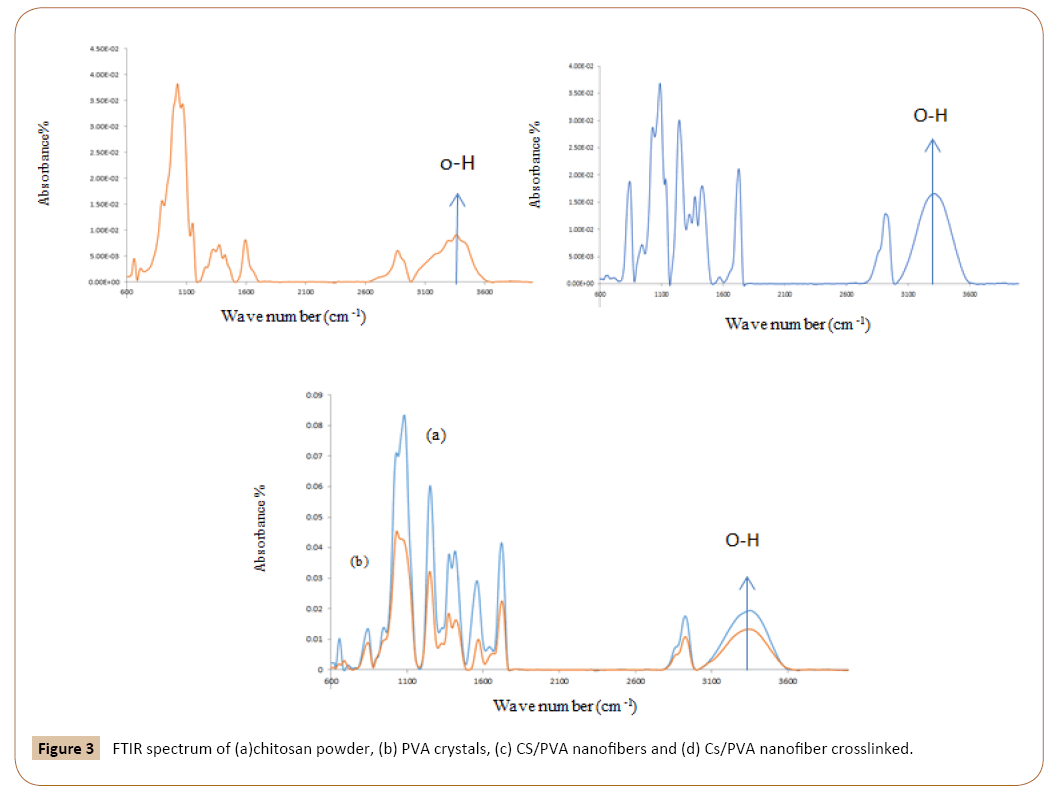
Figure 3: FTIR spectrum of (a)chitosan powder, (b) PVA crystals, (c) CS/PVA nanofibers and (d) Cs/PVA nanofiber crosslinked. -9
As can be seen in Figure 4 after crosslinking tests, results show that after 3 h crosslinked process there wasn’t any weight loss to be observed.
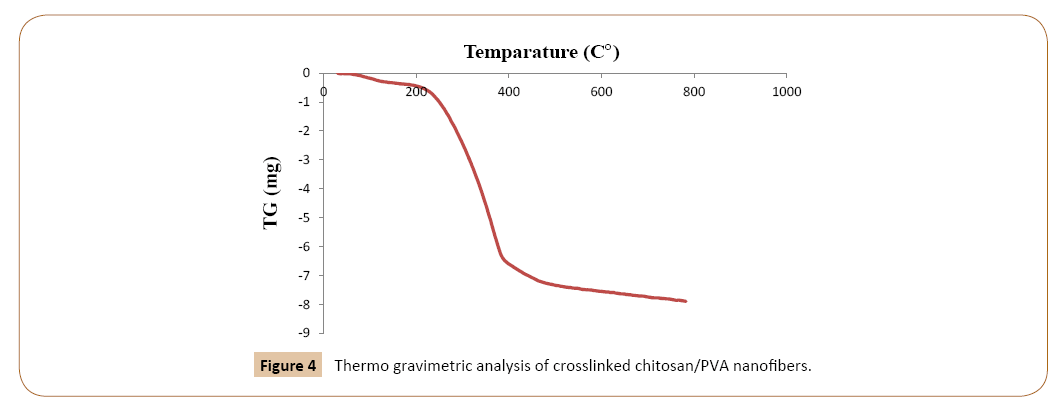
Figure 4: Thermo gravimetric analysis of crosslinked chitosan/PVA nanofibers.
This reduction on the nanofiber sizes indicated an apparent enhancement on the adsorption capacity of phenol. However, the reduction of the nanofibers is surmounted by reduction of the amine free on the surface of the polymer caused by the chitosan-glutaraldehyde interaction [20].
FTIR spectroscopic measurement
Fourier transmission infrared spectroscopy, FTIR-ATR spectra were measured at room temperature on the Chitosan/PVA blend nanofibers and crosslinked Chitosan/PVA blend nanofibers. The IR spectrum shows characteristic absorption bands of -OH groups at 3421 and 1096 cm-1 due to PVA. Characteristic peaks assignment of chitosan were as follows: 1597 cm (amide II band, NAH stretch), 2925 cm-1 (CAH stretch), and 3442 cm-1 (NAH stretch overlapped with OAH stretch). It was remarkable that the absorption peak of the amide I at 1650 cm-1 was weak in the IR spectrum of chitosan, indicating that the raw chitosan possesses higher deacetylation degree. The absorption bands of PVA at 2939 and 1419 cm-1 are attributed to the stretching vibration and bending vibration of C-H, respectively [21].
Broad bands at 3340-3400 cm-1 was assigned to O-H stretching vibration. Characteristic absorbance bands at ~940 and ~1116 cm-1 are associated with saccharine while strong bands at ~1737 and 1651 cm-1 are associated with amide and amine functionalities respectively for pure chitosan [22,23].
Adsorption bands at 3340-3400, 2937-2950, 1423-1436 and 1094-1095 cm-1 were respectively, due to stretching vibration of O-H, symmetric vibration of CH2, inplane bending of CH-O-H and stretching vibration of C-O. The broad bands of CH3 group and CH3-O group can be observed at 1004-1087 cm-1. Obviously found, a broad absorption band of -OH in the range of 3421-3443 cm-1 appeared in the spectrum of crosslinked Chitosan/PVA by Glutaraldehyde. This is attributed to the formation of strong hydrogen bonds.
As can be seen in Figure 5 before and after crosslink respectively there is not any peaks more or less but after crosslinking the peaks intensity were decrease. Usually it means either that the concentration or path length is higher in one of the samples. For transmission spectroscopy, the intensity of absorption is described by the Beer-Lambert law. In short, it depends on path length, concentration, and the strength of the absorption band [24].
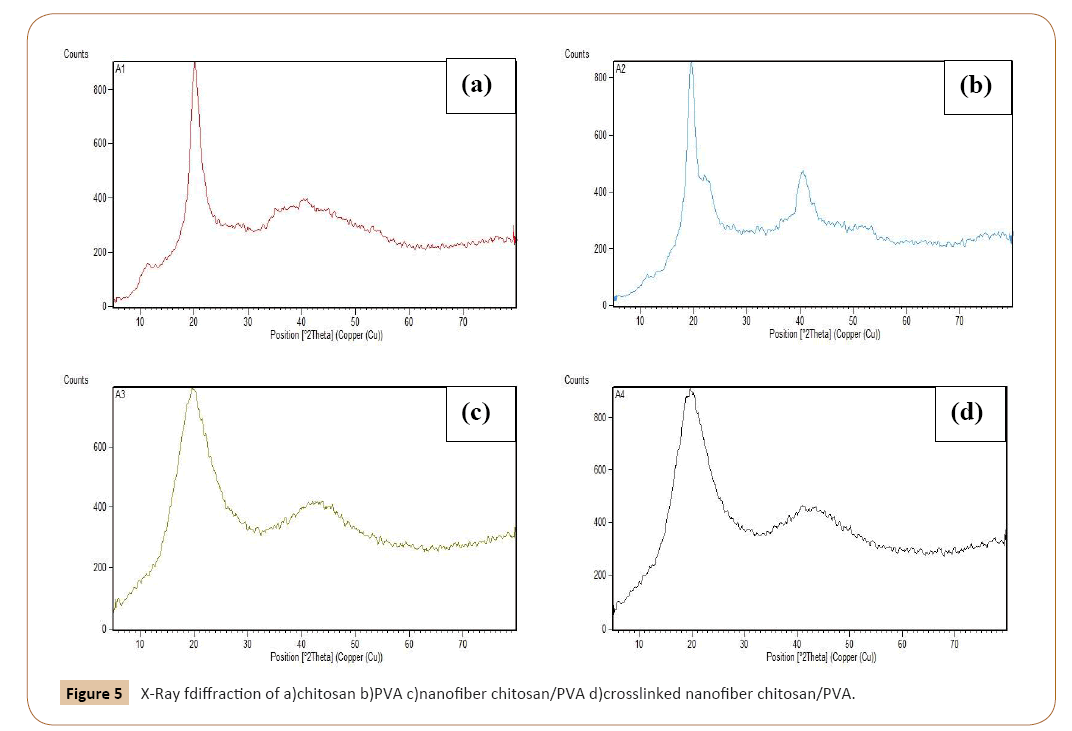
Figure 5: X-Ray fdiffraction of a)chitosan b)PVA c)nanofiber chitosan/PVA d)crosslinked nanofiber chitosan/PVA.
X-ray diffraction analysis
The XRD data of the adsorbate loaded carbon have an evidence of crystalline nature of carbon changing into amorphous nature after adsorption and this suggests that the phenol molecules diffuse into micropores and macropores and adsorb mostly by chemisorption with altering the structure of the carbon, as a result of the adsorption reaction. XRD studies show changes in the crystallinity of the adsorbent due to the adsorption reaction. According to part 2.8.4 the (a) Chitosan, (b) PVA (c) Chitosan/ PVA nanofibers and crosslinked Chitosan/nanofibers the peaks of chitosan and PVA would be broad.
In this work chitosan and PVA have a sharp peak at the 2θ=20° and have a lower peak at about 2θ=40°. The short and flat peaks indicative that the materials have a very low cristalinity while cristalinity is very sharp the peaks have a very high. As can be seen in Figure 2 adsorbent in pure form have sharp peaks, but after electrospinning and crosslinking the peaks were broad and short. This changing would be a good factor for adsorption, because the polymers in crystal forms have a higher strength and that’s would be lower the adsorption level.
Results of thermo gravimetric of adsorbent
The results at the specified conditions show that destruction of adsorbent starts at 200°C and will continue until reached to horizontal forms. At this condition adsorbent entirely constructed and changed to gas.
Optimization of electrospinning parameters CCD for phenol
As can be seen in Table 3, the application of response surface methodology yielded the eqn. (5) which is final Equations in terms of coded factors:
Table 3: Effect of phenol adsorption model.
| Effect |
Estimate |
F-Ratio |
P-Value |
| A:Rate |
10.51 |
8.92 |
0.0124 |
| B: Voltage |
3.46 |
0.97 |
0.3466 |
| C: Distance |
0.806 |
0.05 |
0.8231 |
| D: PVA/Cs |
14.65 |
17.32 |
0.0016 |
| AA |
-12.77 |
1.87 |
0.1985 |
| AB |
-2.012 |
0.29 |
0.6005 |
| AC |
-9.55 |
6.55 |
0.0266 |
| AD |
-8.29 |
4.93 |
0.0484 |
| BB |
-2.75 |
0.09 |
0.7732 |
| BC |
6.65 |
3.21 |
0.1005 |
| BD |
-11.43 |
9.38 |
0.0108 |
| CC |
21.35 |
5.23 |
0.0430 |
| CD |
-6.88 |
3.39 |
0.0925 |
| DD |
-38.67 |
17.16 |
0.0016 |
Y = −2.2×10⁵ +10.51A +14.65C − 9.55AC − 8.29AD −11.43BD + 21.35C2 − 38.67D2
The value of the coefficients is calculated by the regression method. Table 2 shows each of the estimated effects and interactions.
The response surface quadratic order model presented high correlation coefficient (R2=0.86) for phenol. These result shows variability in the adsorption for phenol 86.23%. Higher R2 (coefficient of correlation) indicates the goodness of fit for the model to the actual data and high statistical significance of the model. This percent indicates is relatively good correlations between the experimental and predicted values of adsorption (Figure 6).
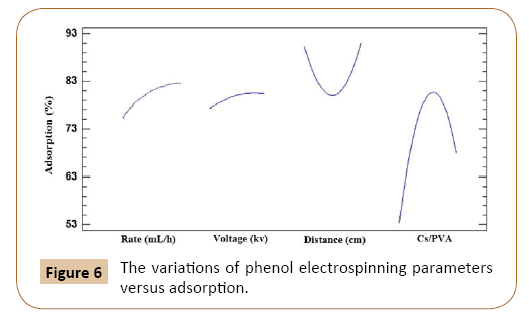
Figure 6: The variations of phenol electrospinning parameters versus adsorption.
Figure 1 shows the variation of adsorption versus all four parameters. As can be seen the voltage and flow rate are aligning together and as an expected these two parameters are very dependent in electrospinning because whatever the flow rate increased voltage must have the power to overcome the surface tension that flow rate needs [25].
The changes of polymer volumetric ratio have a maximum peak at about 50/50, because at this ratio the diameters are narrow, so the surface area became further and as a result the adsorption increased [26].
As can be seen in Figure 1 distance has a minimum amount. Most important parameter, volumetric ratio had a maximum amount for phenol adsorption. The optimum conditions for coefficients of phenol was obtained rate=1.48 ml/h, voltage=300 kv, chitosan/ PVA volumetric ratio=50/50 and distance=20 cm [27-34].
Optimization of phenol adsorption
After optimizing the electrospinning parameters, as can be seen in Figure 7 as predicted with increase of adsorbent and decrease of initial concentration of phenol adsorption percent would be increased. Also most adsorption accrued at high pH solution. The accurate amount were achieved at pH=12, initial concentration=10 and amount of adsorbent=0.01. At these optimum conditions adsorption capacity achieved 3700 mg g-1.
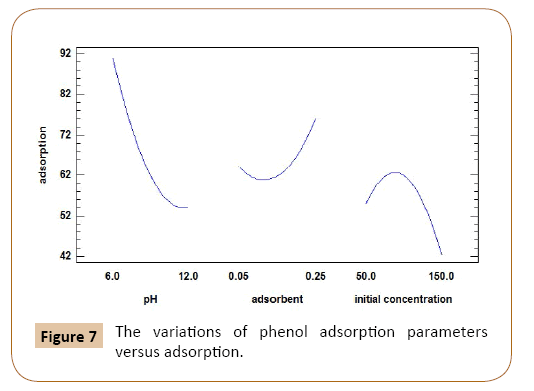
Figure 7: The variations of phenol adsorption parameters versus adsorption.
Conclusions
In the present study, chitosan/PVA nanofibers were prepared by the electrospinning method used as adsorbent for removal phenol pollutant from aqueous solutions. The effects of processing factors such as voltage, flow rate of solution injection, distance of needle to the collector, and volumetric ratio of chitosan/ PVA in the electrospinning solution have been investigated using response surface methodology to obtain the maximum adsorption capacity of phenol.
When percentage of chitosan was increased from 0 to 25 wt%, fibers were formed and the average diameter of the nanofibers changing from 6 to 86 nm. As a result the optimum phenol removal for this study achieved at 50/50 volumetric ratio. Fourier Transform Infrared Spectroscopic measurement exhibited the existence of relevant functional groups of both PVA and chitosan in the composites. Figure of FTIR shows before and after crosslink respectively there was not any peak more or less but after crosslinking the peaks intensity were decrease. The two parameters voltage and rate are aligning together and as expected these two parameters are very dependent in electrospinning. As can be seen in XRD analysis adsorbents in pure form have sharp peaks, but after electrospinning and crosslinking the peaks were broad and short. The results at the specified conditions show that destruction of adsorbent starts at 200°C. This changing would be a good factor for adsorption, because the polymers in crystal forms have a higher strength and that’s would be lower the adsorption level. Response surface quadratic model presented high correlation coefficients for phenol (R2=0.86) explaining 86.3% of the variability in the adsorption. After that phenol adsorption capacity will be studied. After optimize the adsorption parameters the adsorption capacity 3700 mg g-1 achieved. At the end Table 4 would be shown comparison of adsorption capacity with other works until know.
Table 4: Comparison the removal of this work with other past works.
| Adsorbent |
Adsorbate |
Year |
Adsorption capacity |
Reference |
| Hydroxyapatite nanopowders |
phenol |
2009 |
10.33 mg g-1 |
[5] |
| Organomodified Tirebolu bentonite |
phenol |
2009 |
333 mg g-1 |
[27] |
| Activated carbon prepared from biomass material |
phenol |
2008 |
149.25 mg g-1 |
[28] |
| Natural zeolites as solid adsorbents |
phenol |
2011 |
34.5 mg g-1 |
[29] |
| Aqueous Solution By Using Carbonised Beet Pulp |
phenol |
2005 |
89.5 mg g-1 |
[30] |
| Activated carbons from Tectona grandis sawdust by ZnCl2 activation |
phenol |
2005 |
2.82 mg g-1 |
[31] |
| lignite |
phenol |
2006 |
10 mg g-1 |
[32] |
| ACs prepared by activation of Kraft lignin with NaOH |
phenol |
2006 |
238 mg g-1 |
[33] |
| ACs prepared by activation of Kraft lignin with KOH |
phenol |
2006 |
213 mg g-1 |
[33] |
| Effects of pyrolysis conditions on the physical characteristics of oil-palm-shell activated carbons used |
phenol |
2008 |
166 mg g-1 |
[34] |
| Crosslinked Chitosan/PVA nanofibers |
phenol |
2016 |
3700 mg g-1 |
This work |
References
- Rengaraj S, Moon SH, Sivabalan R, Arabindoo B, Murugesan V (2002) Removal of phenol from aqueous solution and resin manufacturing industry wastewater using an agricultural waste: rubber seed coat. J Hazard Mater 89:185-196.
- Hararah MA, Ibrahim KA, Alâ€ÂÂÂÂMuhtaseb AA, Yousef RI, Abuâ€ÂÂÂÂSurrah A,et al. (2010) Removal of phenol from aqueous solutions by adsorption onto polymeric adsorbents. J ApplPolymSci117:1908-1913.
- Wang X, Patil PD, He C, Huang J, Liu YN.J ApplPolym Sci.
- Franck HG, Stadelhofer JW (2012) Industrial aromatic chemistry: raw materials· processes· products. Springer Science and Business Media.
- Lin K, Pan J, Chen Y, Cheng R, Xu X (2009) Study the adsorption of phenol from aqueous solution on hydroxyapatite nanopowders. J Hazard Mater161:231-240.
- Frenot A, Chronakis IS (2003) Polymer nanofibers assembled by electrospinning. CurrOpin Colloid Interface Sci 8:64-75.
- Arida CVJ, de Luna MDG, Futalan CM, Wan MW (2015)Optimization of As(V) removal using chitosan-coated bentonite from groundwater using Box-Behnken Design: Effects of adsorbent mass, flow rate, and initial concentration.
- Miya M, Iwamoto R, Yoshikawa S, Mima S (1980)IR spectroscopic determination of CONH content in highly deacylated chitosan. IntJ BiolMacromol 2:323-324.
- Huang XJ, Ge D, Xu ZK (2007) Preparation and characterization of stable chitosan nanofibrous membrane for lipase immobilization. European Polym J43:3710-3718.
- Lin T, Fang J, Wang H, Cheng T, Wang X (2006) Using chitosan as a thickener for electrospinningdilute PVA solutions to improve fibre uniformity. Nanotechnol17:3718.
- Zhang Y, Huang X, Duan B, Wu L, Li S, et al. (2007) Preparation of electrospun chitosan/poly (vinyl alcohol) membranes. Colloid Polym.Sci285:855-863.
- Nouri A, Sargolzaei J (2014) Removal of Phenol Dyes Using a Photocatalytic Reactor with SnO2/Fe3O4 Nanoparticles. Journal of Dispersion Science and Technology35:1031-1039.
- Diler EA, Ipek R (2012) An experimental and statistical study of interaction effects of matrix particle size, reinforcement particle size and volume fraction on the flexural strength of Al–SiC p composites by P/M using central composite design. Mater Sci Eng: A548:43-55.
- Aslan N (2008) Application of response surface methodology and central composite rotatable design for modeling and optimization of a multi-gravity separator for chromite concentration. Powder Technology185:80-86.
- Homayoni H, Ravandi SA, Valizadeh M (2009)Electrospinning of chitosan nanofibers: processing optimization. Carbohydrate Polymers77:656-661.
- Namasivayam C, Kavitha D (2006) IR, XRD and SEM studies on the mechanism of adsorption of dyes and phenols by coir pith carbon from aqueous phase. Microchemical Journal82:43-48.
- Brantley WA, Cai Z, Foreman DW, Mitchell JC, Papazoglou E, et al. (1995) X-ray diffraction studies of as-cast high-palladium alloys. Dental Materials11:154-160.
- Shah NA, Sagar RR, Mahmood W, Syed WA (2012) Cu-doping effects on the physical properties of cadmium sulfide thin films. Journal of Alloys and Compounds 512:185-189.
- Charernsriwilaiwat N, Opanasopit P, Rojanarata T, Ngawhirunpat T, Supaphol P (2010) Preparation and characterization of chitosan-hydroxybenzotriazole/polyvinyl alcohol blend nanofibers by the electrospinning technique. Carbohydrate Polymers81:675-680.
- Monteiro OA, Airoldi C (1999)Some studies of crosslinking chitosan–glutaraldehyde interaction in a homogeneous system. IntJ BiolMacromol26:119-128.
- Liu J, Wang W, Wang A (2011) Synthesis, characterization, and swelling behaviors of chitosangpoly (acrylic acid)/poly (vinyl alcohol) semiâ€ÂÂÂÂIPN superabsorbent hydrogels. Polymers for Advanced Technologies22:627-634.
- Kumbar SG, Kulkarni AR, Aminabhavi TM (2002)Crosslinked chitosan microspheres for encapsulation of diclofenac sodium: effect of crosslinking agent. Journal of Microencapsulation19:173-180.
- KumbarSG, Soppimath KS, Aminabhavi TM (2003) Synthesis and characterization of polyacrylamide grafted chitosan hydrogel microspheres for the controlled release of indomethacin. J ApplPolymSci87:1525-1536.
- Shariful MI, Sharif SB, Lee JJ, Habiba U, Ang BC, et al. (2017) Adsorption of divalent heavy metal ion by mesoporous-high surface area chitosan/poly (ethylene oxide) nanofibrous membrane. Carbohydrate Polymers157:57-64.
- Beachley V, Wen X (2009) Effect of electrospinning parameters on the nanofiber diameter and length. MaterSciEng: C 29:663-668.
- Li Z, Li T, An L, Fu P, Gao C, et al. (2016)Highly efficient chromium (VI) adsorption with nanofibrous filter paper prepared through electrospinning chitosan/polymethylmethacrylate composite. Carbohydrate Polymers137:119-126.
- Senturk HB, Ozdes D, Gundogdu A, Duran C, Soylak M (2009) Removal of phenol from aqueous solutions by adsorption onto organomodifiedTirebolubentonite: Equilibrium, kinetic and thermodynamic study. J Hazard Mater172:353-362.
- Hameed BH, Rahman AA (2008) Removal of phenol from aqueous solutions by adsorption onto activated carbon prepared from biomass material. J Hazard Mater160:576-581.
- Yousef RI, El-Eswed B, Ala’a H (2011) Adsorption characteristics of natural zeolites as solid adsorbents for phenol removal from aqueous solutions: kinetics, mechanism, and thermodynamics studies. Chemical Engineering Journal171:1143-1149.
- Dursun G, Çiçek H, Dursun AY (2005) Adsorption of phenol from aqueous solution by using carbonised beet pulp. J Hazard Mater125:175-182.
- Hua C, Zhang R, Li L, Zheng X (2012) Adsorption of phenol from aqueous solutions using activated carbon prepared from crofton weed. Desalination and Water Treatment 37:230-237.
- Polat H, Molva M, Polat M (2006) Capacity and mechanism of phenol adsorption on lignite. International Journal of Mineral Processing 79:264-273.
- 33.Carrott PJ, Carrott MR (2007) Lignin–from natural adsorbent to activated carbon: a review. Bioresource Technology 98:2301-2312.
- Jia Q, Lua AC (2008) Effects of pyrolysis conditions on the physical characteristics of oil-palm-shell activated carbons used in aqueous phase phenol adsorption. Journal of Analytical and Applied Pyrolysis83:175-179.