Keywords
Sediment; Contaminant metals; EDXRF; Potential ecological risk; SQGs
Introduction
Estuarine and coastal regions are often polluted by various contaminants arising from industrial processes, agricultural activities, domestic wastes and vehicles emission. The rapid industrialization in the coastal area increases the heavy metal contamination in sediments. Due to the toxicity and persistence of pollution, heavy metals research of estuarine and coastal area has attracted more public concerns recently. One of the largest problems associated with the persistence of heavy metals is the potential for bioaccumulation and bio-magnification, resulting in potential long-term implications on human health and ecosystem [1]. Heavy metals resulting from anthropogenic contamination associated with organic matter present in thin fraction of the sediments. Sediments are ecologically important components of the aquatic habitat and also a reservoir of contaminants in water body.
Sediments are source of metals for aquatic organisms and play a key role to assess pollution in the marine environment and provide basic information for the judgment of ecological health risks. Sediments have been widely shows as environmental indicators and their ability to trace contamination sources. Sediment pollution by heavy metals has been a critical problem in marine environment because of their toxicity and bioaccumulation. The coastal sediments provide useful information about environmental and geochemical nature of the marine environment.
Multi-elemental analysis of sediments may reveal the presence of heavy metals which are contaminants and may have toxic influence on ground water and surface water. A number of analytical methods had been used in elemental studies during the past 50 years. Among these, the most successful are instrumental neutron activation analysis (INAA), XRF, and inductively coupled plasma-mass spectrometry (ICP-MS). INAA has a longer history and its advantages include: good precision, accuracy, and reliable bulk analysis of the sample. In the majority of cases, INAA is more sensitive than XRF. It is also more matrix independent and less susceptible to geometric effects than XRF. However, INAA, requires access to a nuclear reactor, a longer analytical time and additional sample preparation for irradiation. XRF has the advantage of non-destructive analysis for a given sample, but has limited detection capability compared to INAA. ICP-MS has the advantage of sensitivity but requires sample dissolution which is difficult for many inorganic materials, especially for those with high silica content like obsidian. In contrast, while laser ablation ICP-MS requires minimal sample preparation and the analysis is minimally invasive to the sample analysis is frequently semiquantitative at best.
The EDXRF technique is chosen for the present work due to its advantages like non-requirement of chemical treatment of the samples; it is less time consuming non-destructive method and it is ideal for environmental research. It is short processing time, accurate, relatively cheap, low detection limits and easy to use and also rapid for multi-elemental analysis. The fundamental principle behind XRF is that when electrons of particular elements are excited by X-rays they emit or fluorescence a spectrum of X-rays that is specific to that element. ED-XRF is widely used as a non-destructive method for chemical analysis of environmental matrix [2-4].
Hence the objective of the present work is to (i) determine the accumulation, distribution of heavy metals in sediments of the east coast of Tamilnadu and (ii) assess the potential ecological risk of sediments using sediment quality guidelines viz., Threshold Effect Level (TEL), Probable Effect Level (PEL), Effect Range Low (ERL)/Effective Rage Median (ERM) and Sever Effect Level (SEL).
Study Area
Sediment samples were collected along the Bay of Bengal coastline, from Periyakalapattu to Parangipettai coast during the pre - monsoon condition. Table 1 represents the geographical latitude and longitude for the sampling locations at the study area. Sampling locations were selected to collect representative samples from all along the study area. Recent industry developments during the last two decades in Cuddalore, Auroville, Thazhankuda and Sitheripettai coastal towns include offshore oil production, chemical, fertilizer processing plants and more than 150 small scale industries, all located in this region. The study area is also drained by the tributaries of river Cauvery which runs through many industrial towns and its tributaries, i.e., rivers Puravandayanar, Uppanar pass through the agricultural belt of Tamilnadu state and finally drain into the Bay of Bengal in this coastal sector.
| S.No |
Name of the Location |
Location ID |
Latitude |
Longitude |
| 1 |
Periyakalapet |
PP1 |
12° 1' 46.6320'' N |
79° 51' 49.0032'' E |
| 2 |
Ellaipillaichavady |
PP2 |
11° 55' 54.0228'' N |
79° 48' 19.1268'' E |
| 3 |
Auroville |
PP3 |
11°59'2.8422"N |
79°50'55.5334"E |
| 4 |
Nadukuppam |
PP4 |
11°58'1.7401"N |
79°38'35.5103"E |
| 5 |
Muthialpet |
PP5 |
11° 57' 18.2556'' N |
79° 50' 4.1712'' E |
| 6 |
Veerampattinam |
PP6 |
11° 54' 5.6160'' N |
79° 49' 36.7428'' E |
| 7 |
Nallavadu |
PP7 |
11° 51' 27.6014'' N |
79°34'27.46"E |
| 8 |
Narambai |
PP8 |
11° 49' 3.2520'' N |
79° 48' 0.9216'' E |
| 9 |
Thazhankuda |
PP9 |
11°46'14.2020"N |
79°47'40.5605"E |
| 10 |
Cuddalore OT |
PP10 |
11° 45' 0.0000'' N |
79° 45' 0.0000'' E |
| 11 |
Raasapettai |
PP11 |
11° 40' 56.2692'' N |
79° 46' 17.5008'' E |
| 12 |
Sitheripettai |
PP12 |
10° 30' 31.6944'' N |
77° 13' 17.7600'' E |
| 13 |
Betlodai |
PP13 |
11° 21' 45.2300'' N |
79° 32' 21.8544'' E |
| 14 |
Samiyarpettai |
PP14 |
11° 32' 57.2100'' N |
79° 45' 31.8744'' E |
| 15 |
Parangaipettai |
PP15 |
11° 30' 0.0000'' N |
79° 46' 0.0012'' E |
Table 1: Geographical latitude and longitude for the sampling locations.
Materials and Methods
Sample collection and preparation
Sediment sample were collected by a Peterson grab sampler from parallel to the shoreline. The grab sampler collects 10 cm thick bottom sediment layer from the seabed along the 15 locations (Figure 1). Uniform quantity of sediment samples were collected from all the sampling stations. Care was taken to ensure that the collected sediments were not in contact with the metallic dredge and the top sediment layer was scooped with an acid washed plastic spatula. Sediment samples were stored in plastic bags and kept in refrigeration at -4°C until analysis. The samples were air dried at 105°C for 24 h to a constant weight and sieved using a 63 μm sieve in order to identify the geochemical concentrations. The grain size <63 μm, which presents several advantages: (1) heavy metals are mainly linked to silt and clay; (2) this grain size is like that of the suspended matter in water; and (3) it has been used in many studies on heavy metal contamination. Then samples were ground into a fine powder for 10-15 min, using an agate martor. All powder samples were stored in desiccators until they were analyzed. One gram of the fine ground sample and 0.5 g of the boric acid (H3BO3) were mixed. The mixture was thoroughly ground and pressed to a pellet of 25mm diameter using a hydraulic press (20 tons) [3]. The Figure 1 shows the sampling location map of the Study area.
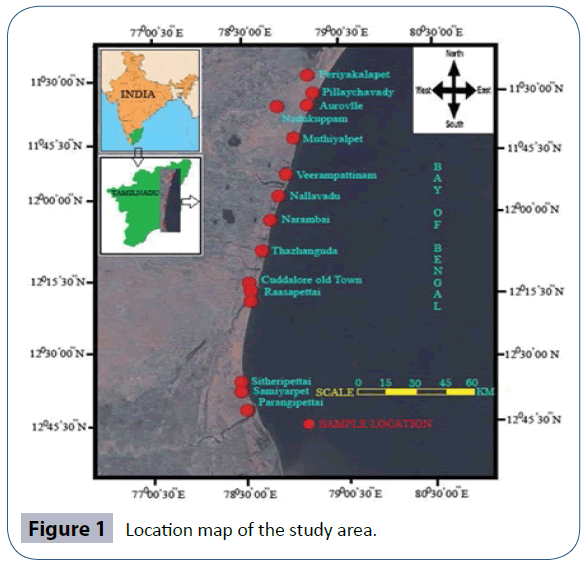
Figure 1 Location map of the study area.
EDXRF technique
The prepared pellets were analyses using the EDXRF available at Environmental and Safety Division, Indira Gandhi Centre for Atomic Research (IGCAR), Kalpakkam, Tamilnadu. The instrument used for this study consists of an EDXRF spectrometer of model EX-6600SDD supplied by Xenemetrix, Israel. The spectrometer is fitted with a side window X-ray tube (370 W) that has Rhodium as anode. The power specifications of the tube are 3-60 kV; 10-5833 μA. Selection of filters, tube voltage, sample position and current are fully customizable. The detector SDD 25 mm2 has an energy resolution of 136 eV ± 5 eV at 5.9 keVMn X-ray and 10- sample turret enables keeping and analyzing 10 samples at a time. The quantitative analysis is carried out by the In-built software nEXT.
A reference material standard soil (NIST SRM 2709a) was used for standardizing the instrument. This soil standard obtained from a follow field in the central California San Joaquin valley. Table 2 reports the certified values with measured EDXRF and its shows that they are well agreement with each other.
| Element |
Certified Values |
EDXRF values |
| Mg |
14600 |
14900 ± 1000 |
| Al |
72100 |
68400 ± 2300 |
| K |
20500 |
19100 ± 700 |
| Ca |
19100 |
16500 ± 500 |
| Ti |
3400 |
3100 ± 100 |
| Fe |
33600 |
33900 ±1200 |
| V |
110 |
98.8 ± 6.59 |
| Cr |
130 |
112.1 ± 4.01 |
| Mn |
529 |
568.2 ± 19.85 |
| Co |
12.8 |
12.8 ± 0.55 |
| Ni |
83 |
69.3 ± 2.98 |
| Zn |
107 |
127.9 ± 4.88 |
Table 2: Analysis of soil standard-NIST SRM 2709a by EDXRF (mg kg-1)
Results and Discussions
Heavy metal distribution in the sediments of east coast of Tamil Nadu
The determined heavy metal concentration for 15 coastal locations of east coast of Tamilnadu using energy dispersive X-ray fluorescence (EDXRF) is given in Table 3. The heavy metal concentration varies from 25-6007 mg kg-1 for Mg; from 13532- 37425 mg kg-1 for Al; from 129139-226500 mg kg-1; from 4468- 9350 mg kg-1 for K; from 4592-21679 mg kg-1 for Ca; from 530- 51434 mg kg-1 for Ti; from 3647-57902 mg kg-1 for Fe; from 23.4-711 mg kg-1 for V; from 12.5-207.3 mg kg-1 for Cr; from 68.1-1387.6 mg kg-1 for Mn; from 1.1-19 mg kg-1 for Co;from 15.2- 33.63 mg kg-1 for Ni; from BDL-3.60 mg kg-1 for Cu; from 14-89 mg kg-1 for Zn; from 4-6.9 mg kg-1 for As; from BDL-10.2 mg kg-1 for Cd; from 152.3-416.8 mg kg-1 for Ba; from BDL-216.7 mg kg-1 for La and from BDL-35.7 mg kg-1 for Pb. As can be seen from Table 2, the mean concentrations of heavy metal found in the following order of Mn> Ba > V > Cr > Zn > La > Ni > Si >Pb> Co > As > Cd > Cu > Al > Fe >Ca> Ti > K > Mg. The heavy metal concentration of the present work is compared with results of the other countries in the world and given in Table 4 and Figure 2 shows the Heavy metal distribution in the sediment with different location.
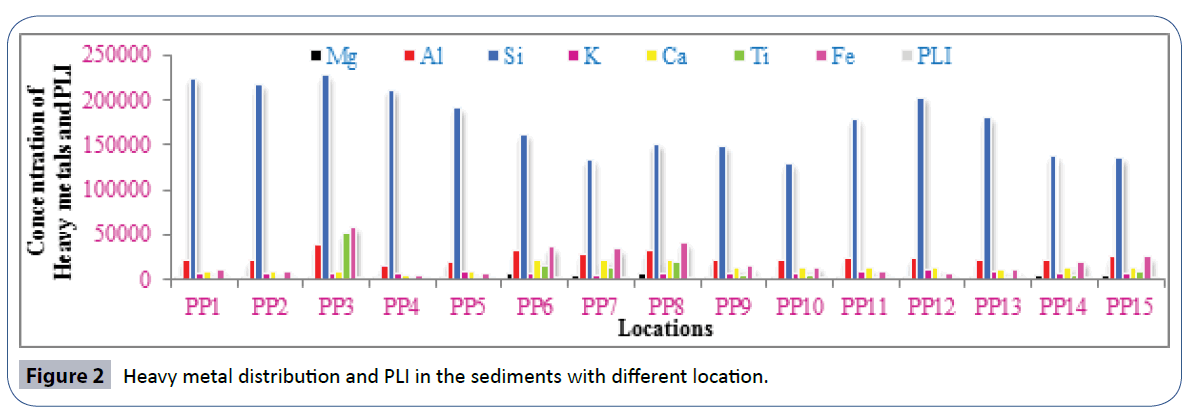
Figure 2 Heavy metal distribution and PLI in the sediments with different location.
| S.No. |
Location |
Cr |
Mn |
Co |
Ni |
Zn |
References |
| 1 |
Coastal shandong, |
35-99.6 |
- |
- |
19-56.8 |
37-181.1 |
[1] |
| Penninsula |
| 2 |
Izmit Bay, Turkey |
74.3 |
- |
- |
- |
930 |
[6] |
| 3 |
Danube River, Europa |
26.5-556.5 |
442-1655 |
- |
17.5-173.3 |
78-2010 |
[7] |
| 4 |
Bohai Bay, Bohai Sea China. |
33.5 |
- |
- |
30.5 |
71.7 |
[8] |
| 5 |
Bremen Bay, Germany |
131 |
- |
- |
60 |
790 |
[9] |
| 6 |
Tinto River, Spain |
11-151 |
- |
6.8-42 |
1.6-36 |
68-5280 |
[10] |
| 7 |
Pearl river estuary |
89 |
- |
- |
41.7 |
150 |
[11] |
| 8 |
Kafrain Dam, Jordan |
160 |
730 |
60 |
100 |
120 |
[12] |
| 9 |
Masan Bay, Korea |
67.1 |
- |
- |
28.8 |
206.3 |
[13] |
| 10 |
East Coast of Tamilnadu, India |
80.03 |
367.65 |
6.68 |
24.80 |
39.79 |
Present Study |
Table 3: Comparison of heavy metal (mgkg-1) concentration of present work with other countries.
| S. No |
Element |
Mg |
Al |
Si |
K |
Ca |
Ti |
Fe |
V |
Cr |
Mn |
Co |
Ni |
Cu |
Zn |
As |
Cd |
Ba |
La |
Pb |
PLI |
| 1 |
PP1 |
2223 |
20696 |
223285 |
6615 |
8943 |
2039 |
9534 |
50.11 |
42.38 |
192.26 |
3.38 |
20.86 |
0.0 |
30.54 |
4.7 |
5.5 |
312.4 |
12.9 |
4.4 |
0.3490 |
| 2 |
PP2 |
25 |
20255 |
216248 |
6202 |
7239 |
2340 |
8458 |
50.9 |
30.3 |
180.1 |
2.8 |
19.8 |
0.0 |
23.0 |
4.7 |
2.1 |
306.1 |
29.1 |
1.5 |
0.2820 |
| 3 |
PP3 |
1800 |
37425 |
226500 |
5484 |
8070 |
51434 |
57902 |
711.0 |
207.3 |
1387.6 |
19.0 |
24.4 |
0.0 |
89.0 |
6.9 |
0.0 |
180.2 |
216.7 |
35.7 |
0.9520 |
| 4 |
PP4 |
300 |
13532 |
210618 |
6800 |
4592 |
530 |
3647 |
23.4 |
12.5 |
68.1 |
1.1 |
15.2 |
0.0 |
14.0 |
4.0 |
0.0 |
411.9 |
0.0 |
0.0 |
0.2410 |
| 5 |
PP5 |
1028 |
19066 |
189935 |
7869 |
7406 |
1216 |
5520 |
26.37 |
21.21 |
110.05 |
1.88 |
16.48 |
0.0 |
20.16 |
4.8 |
10.2 |
385.4 |
0.0 |
1.4 |
0.2800 |
| 6 |
PP6 |
6007 |
30893 |
161332 |
5044 |
20809 |
15464 |
35269 |
234.71 |
127.00 |
750.16 |
12.51 |
33.63 |
0.0 |
62.31 |
6.5 |
3.4 |
209.0 |
47.0 |
17.0 |
0.8310 |
| 7 |
PP7 |
3022 |
26895 |
133697 |
4468 |
21176 |
11689 |
33771 |
204.56 |
123.33 |
748.38 |
11.95 |
33.30 |
0.0 |
65.67 |
5.8 |
0.0 |
152.3 |
31.0 |
19.8 |
0.6470 |
| 8 |
PP8 |
5051 |
31132 |
150205 |
4850 |
21679 |
19539 |
40489 |
310.87 |
155.77 |
869.09 |
14.35 |
30.23 |
3.60 |
65.94 |
7.4 |
0.0 |
176.0 |
51.2 |
25.5 |
0.7830 |
| 9 |
PP9 |
816 |
21212 |
147446 |
6085 |
12057 |
3357 |
13407 |
64.94 |
54.52 |
243.11 |
5.01 |
23.21 |
0.0 |
30.78 |
5.2 |
1.4 |
256.7 |
19.1 |
9.1 |
0.3860 |
| 10 |
PP10 |
1608 |
19866 |
129139 |
5392 |
11628 |
3776 |
13137 |
71.38 |
55.33 |
263.74 |
4.61 |
24.59 |
0.0 |
29.00 |
4.7 |
3.6 |
236.1 |
6.4 |
6.1 |
0.3640 |
| 11 |
PP11 |
795 |
23554 |
178547 |
7286 |
11363 |
931 |
8308 |
31.85 |
43.85 |
157.81 |
3.10 |
22.84 |
0.0 |
22.47 |
4.8 |
2.3 |
308.2 |
0.0 |
6.8 |
0.3450 |
| 12 |
PP12 |
1773 |
22928 |
202630 |
9350 |
11586 |
724 |
6693 |
28.12 |
30.32 |
128.35 |
2.40 |
21.67 |
0.0 |
36.02 |
5.6 |
1.8 |
416.8 |
1.0 |
7.6 |
0.3110 |
| 13 |
PP13 |
2072 |
20975 |
179547 |
7147 |
9403 |
1583 |
9530 |
40.01 |
66.16 |
185.61 |
3.42 |
23.16 |
0.0 |
25.08 |
4.9 |
3.8 |
302.5 |
3.1 |
5.5 |
0.3690 |
| 14 |
PP14 |
3440 |
21775 |
136994 |
4859 |
13169 |
3469 |
19281 |
86.6 |
112.3 |
112.3 |
6.5 |
32.1 |
0.0 |
37.8 |
4.4 |
5.1 |
250.4 |
18.0 |
5.0 |
0.4260 |
| 15 |
PP15 |
4612 |
25167 |
134370 |
5232 |
12027 |
8814 |
24594 |
151.9 |
118.1 |
118.1 |
8.3 |
30.4 |
0.0 |
45.0 |
5.0 |
2.8 |
224.0 |
6.0 |
9.4 |
0.4770 |
| Average |
2305 |
23691 |
174699 |
6179 |
12076 |
8460 |
19302 |
139.11 |
80.03 |
367.65 |
6.68 |
24.80 |
3.60 |
39.79 |
5.3 |
3.8 |
275.2 |
36.8 |
11.1 |
0.4695 |
Table 4: Heavy metal concentration (mg kg-1) of sediment samples of east coast of Tamilnadu, India.
Pollution load index (PLI)
The pollution load index (PLI) provides a simple, comparative means for assessing the level of heavy metal pollution [5]. PLI is determined as the nth root of the product of nCf
 ----------(1)
where Cf is the contamination factor and n is the number of metals. CF is considered to be an effective tool in monitoring the pollution over a period of time.CF is the ratio between the sediment metal concentration at a given site and the background value of the metal and it is given by the formula,
 --------(2)
According to Tomlinson et al. (1980) [5] PLI>1 means that pollution is present; otherwise, if it is below 1, there is no metal pollution. The pollution load index (PLI) ranged from 0.24 to 0.95 (Table 3). The minimum and maximum value of the PLI noticed in PP4 (0.2410 ) and PP3 (0.9520) respectively. According to the mean PLI value (0.4696), the east coast of sediments was practically not polluted. The variation of PLI show in Figure 2.
Potential ecological risk by sediment quality guidelines (SQGs)
Sediment quality guidelines (SQGs) can be used to evaluate the degree to which the sediment-associated chemical status might adversely affect aquatic organisms and can be designed to aid in the interpretation of sediment quality [14]. These guidelines have been widely used to screen sediment contamination by comparing sediment contaminant concentrations with the corresponding quality guidelines in aquatic ecosystems [15,16]. This guideline was used correctly classifying sediments as either toxic or non-toxic. SQGs developed for sediments ecosystems [17,18]. The SQGs the effect range low (ERL)/ effect range median (ERM), Threshold Effect Level (TEL), Probable Effect Level (PEL), Sever Effect Level (SEL) was applied in this study, to assess the eco-toxicological sense of heavy metal concentrations in sediment samples. The comparison between sediment quality guideline (SQGs) and heavy metals concentration (mg kg-1) in the present study in each guideline is given in Table 5.
| Sediment quality guidelines |
Mg |
Al |
K |
Ca |
Ti |
Fe |
V |
Cr |
Mn |
Co |
Ni |
Zn |
| Threshold Effect Level (TEL) |
n.a |
n.a |
n.a |
n.a |
n.a |
n.a |
n.a |
52 |
n.a |
n.a |
15.9 |
124 |
| Probable Effect Level (PEL) |
n.a |
n.a |
n.a |
n.a |
n.a |
n.a |
n.a |
160 |
n.a |
n.a |
42.8 |
271 |
| Effect Range Low (ERL) |
n.a |
n.a |
n.a |
n.a |
n.a |
n.a |
n.a |
81 |
n.a |
n.a |
20.9 |
150 |
| Effective Range Median (ERM) |
n.a |
n.a |
n.a |
n.a |
n.a |
n.a |
n.a |
370 |
n.a |
n.a |
51.6 |
410 |
| Sever Effect Level (SEL) |
n.a |
n.a |
n.a |
n.a |
n.a |
n.a |
n.a |
n.a |
1100 |
n.a |
50 |
270 |
| Measured values in present study |
2305 |
23691 |
6179 |
12076 |
8460 |
19302 |
139.11 |
80.03 |
367.65 |
6.68 |
24.80 |
39.79 |
Table 5: Comparison between sediment quality guidelines (SQGs) and heavy metals concentration (mg kg-1) in the present study with percentage of sample in each guideline.
The concentration of Ni is greater than threshold effect level (TEL) and effect range low (ERL) for all the sampling locations but less than the sever effect level (SEL) and effective range medium (ERM). Similarly the concentration of Zn in all the sampling locations less than the Threshold effect level (TEL), Probable Effect Level (PEL), effect range low (ERL), effect range median (ERM) and Sever Effect Level (SEL).
The contaminate by metal greater than threshold effect level (TEL) for Cr and less than the Probable Effect Level (PEL) and slightly less than the effect range median (ERM). These SQGs results indicate that the concentrations of Cr and Ni are likely to result in harmful effects on sediment-dwelling organisms due to human activities in the coastal area. But other heavy metals normally occur in the sediments due to natural origin.
Conclusion
◊ Distribution of Mg, Al, Si, K, Ca, Ti, Fe, V, Cr, Mn, Co, Ni, Cu, Zn, As, Cd, Ba, La, and Pb in sediment samples were determined along the east coast of Tamilnadu.
◊ The results showed that the sediments are not polluted by Mg, Al, K, Ca, Ti, Fe, V, Mn, Co but slightly enriched with Cr, Ni and Zn.
◊ The mean concentration of heavy metals compared with other results of other countries.
◊ The sediment quality guidelines (SQGs) indicates that the average concentration of Cr is greater than probable effect level (PEL), and effective rage median (ERM) while average concentration of Zn is greater than threshold effective level (TEL) and effective rage median (ERM). This shows that sediment samples are polluted by Cr and Zn.
◊ The results of the present investigation and actual knowledge about the metal distribution in these sediment indicate that continuous monitoring and efforts of remediation are required to improve the coastal environment near industrialized areas.
Acknowledgement
We are sincerely thanks and gratitude to Dr. K. K. Satpathy, Head, Environment and Safety Division, RSEG, EIRSG, Indira Gandhi Centre for Atomic Research (IGCAR), Kalpakkam- 603 102 for giving permission to make use of EDXRF facility in RSEG and also our deep gratitude and thanks to Dr. M. V. R. Prasad, Head, EnSD, RSEG, IGCAR, Kalpakkam- 603102, India for his keen help and constant encouragements in EDXRF measurements. Our sincere thanks to Mr. K.V. Kanagasabapathy, Scientific Officer, RSEG, IGCAR for his technical help in EDXRF analysis.
References
- Li G Hu, B, Bi J, Leng Q, Xiao C, Yang Z, (2013) Heavy metals distribution and contamination in surface sediments of the coastal Shandong Peninsula (Yellow Sea). Mar. Pollut. Bull. 76: 420?426.
- Ravisankar R, Sivakumar S, Chandrasekaran A, Kanagasabapathy K V, Prasad M.V.R, et al. (2015) Statistical assessment of heavy metal pollution in sediments of east coast of Tamilnadu using Energy Dispersive X-ray Fluorescence Spec- troscopy (EDXRF). App. Radia. Isot. 102: 42?47
- Ravisankar R, ChandrasekaranA, Kiruba S, Raghu Y, Prasad, (2011)Energy dispersive X-Ray fluorescence (ED-XRF) analysis of ancient potteries of Tamil Nadu. Arch. Appl. Sci. Res. 3: 289-295.
- ChandrasekaranA, Ravisankar R (2015)Spatial distribution of physico-chemical properties and function of heavy metals in soils of Yelagiri hills, Tamilnadu by energy dispersive X-ray florescence spectroscopy (EDXRF) with statistical approach. Spectrochimica Acta, Part A. 150: 586-601.
- Tomlinson D L, Wilson J G, Harris C R, Jef-frey D W (1980) Problems in the assessment of heavy-metal levels in estuaries and the formation of a pollution index. Hel-gol. Mar. Res.33-566?575.
- Pekey H (2006) Heavy metal pollution assessment in sediments of the Izmit Bay, Turkey. Environ. Monit. Assess. 123: 219?231.
- Woitke P, Wellmitz J, Helm D, Kube P, Lepom P, et al. (2003) Analysis and assessment of heavy metal pollution in suspended solids and sediments of the river Danube, Chemosphere. 51: 633?642.
- Hu B, Li G, Li J, Bi J, Zhao J, et al. (2013) Spatial distribution and ecotoxicological risk assessment of heavy metals in surface sediments of the southern Bohai Bay, China. Environ. Sci. Pollut. Res. 20: 4099?4110.
- Hamer K, Karius V (2002) Brick production with dredged harbour sediments. An industrial-scale experiment. Waste Management 22: 521?530.
- Morillo J, Usero J, Gracia I(2002) Heavy metal fractionation in sediments from the Tinto River (Spain), Int. J. Environ. Anal. Chem. 82: 245?257.
- Zhou HY, Peng XT, Pan JM (2004) Distribution, source and enrichment of some chemical elements in sediments of the Pearl River Estuary, China. Continental Shelf Research. 24: 1857?1875.
- Ghrefat H A, Abu-Rukah Y, Rosen MA(2011)Application of geoaccumulation index and enrichment factor for assessing metal contamination in the sediments of Kafrain Dam, Jordan. Environ. Monit. Assess. 178: 95-109.
- Hyun S, Lee C H, Lee T, Choi JW(2007) Anthropogenic contributions to heavy metal distributions in the surface sediments of Masan Bay, Korea. Mar. Pollut. Bull. 54: 1059-1068.
- Wenning RJ, Ingersoll C G(2002) Executive Summary of the SETAC pellston workshop on use of sediment quality guidelines and related tools for the assessment of contaminated sediments. Society of Environmental Toxicology and Chemistry (SETAC), Pensacola, FL, USA.
- MacDonald DD, Ingersoll CG, Berger T A(2000) Development and evaluation of consensus-based sediment quality guidelines for fresh water ecosystems. Arch. Environ. Contam. Toxicol. 39: 20-31.
- Caeiro S, Costa MN, Ramos TB, Fernandes F, Silveira N (2005) Assessing heavy metal contamination in Sado Estuary sediment: an index analysis approach. Ecol. Indic. 5: 151-169.
- MacDonald DD, Carr RS, Calder FD, Long ER, Ingersoll CG (1996) Development and evaluation of sediment quality guidelines for Florida coastal water. Ecotoxicology 5: 253-278.
- Long ER, FieldLJ, McDonald DD (1998) Predicting toxicity in marine sediments with numerical sediment quality guidelines. Environ. Toxico. Chem 17: 714-727.