Research Article - (2023) Volume 14, Issue 5
Assessment of Food Security Determinants and Coping Strategies of Urban Households during COVID-19 Pandemic Lockdown in Jos, Plateau State, Nigeria
Folorunso ST1*,
Momoh OY2,
Yusuf BE2,
Silas YG2 and
Ameh AD2
1Department of Agricultural Economics and Extension, University of Jos, Jos, Nigeria
2Department of Agricultural Extension and Management, Federal College of Land Resources Technology, Jos, Plateau State, Nigeria
*Correspondence:
Folorunso ST, Department of Agricultural Economics and Extension, University of Jos,
Jos,
Nigeria,
Email:
Received: 01-Mar-2023, Manuscript No. AASRFC-23-15800;
Editor assigned: 03-Mar-2023, Pre QC No. AASRFC-23-15800 (PQ);
Reviewed: 17-Mar-2023, QC No. AASRFC-23-15800;
Revised: 01-May-2023, Manuscript No. AASRFC-23-15800 (R);
Published:
08-May-2023, DOI: 10.36648/0976-8610.14.5.49
Abstract
The study focused on the assessment of the determinants food security and coping strategies among urban households during COVID-19 pandemic lockdown in Jos, Plateau state, Nigeria. The sampling technique used was multistage sampling technique in the selecting 265 households. A well-structured questionnaire was used in collecting data. Descriptive statistics, FDT Food security index, Coping Strategies Use Index (CSUI) and Z-statistics test were the analytical tools used for this study. The result indicates that 53% of the household heads were males while the mean age of the respondents was 34 years, the mean household size was 4 persons and 68% of the household heads were not members of cooperative association. The households’ minimum and maximum daily calories intake of 679.67 kcal and 2246.79 kcal for food secure and insecure in this study is above the minimum and maximum recommended threshold of 587.58 kilocalories and 2200 kilocalories respectively. COVID-19 pandemic had effect (p<0.001) on the food security status of households. Age, household size, income and amount of credit were the significant determinants of food security status of households. Limited portions at mealtimes, reliance on less preferred food, ate less than they felt they should, times they couldn't afford to eat balanced meals and reliance on only a few kinds of low cost food to feed the children were the highest ranked coping strategies adopted by households during the pandemic lockdown. In conclusion, the understanding of the effect of the COVID-19 pandemic lockdown on food security status of households and the adopted coping strategies are important in developing policy measures such as social safety nets, home feeding programmes, the school feeding programme, conditional cash transfers schemes and improved marketing channels that will help mitigate against households falling into food insecurity during similar pandemic in the future.
Keywords
Determinants; Food security; COVID-19 lockdown; Coping strategies; Urban households
Introduction
In spite of agricultural policies and strategies introduced by
various governments in Nigeria, the population of food
insecure households has consistently increased; in was 18% in
1986 increased to 40% in 2005, and has been on the increase
in the subsequent years. For instance, although agricultural
sector remains one of the key components of the Nigerian
economy, which contribute about 37% of GDP and employing
about 70% of the active population, it receives less than 10%
of the annual budgetary allocations. It rose from 1.70% in
2017 to 2.00% in 2018; fell to 1.56% in 2019 and 1.34 in 2020,
1.34% in 2021 and then 1.80% in 2022, which is lower than
the minimum 10% as ratified by the Maputo, 2003
declaration. As a result, Nigeria’s agricultural sector has
significantly underperformed despite its vast potential.
Consequently, it has failed to produce sufficient quantity of
food and in the quality to feed the country's population
growth rate which stand at 5.3%. Therefore, the food
insecurity status in Nigeria has continued to rise steadily since
the 1980’s. Food security can be defined as the situation
when all people, at all times, have physical and economic
access to sufficient, safe, and nutritious food for a healthy and
active life. According to this exponential growth in population,
Nigeria's food production is increasing at less 2.0% per year,
while population growth is estimated to be 2.58% per year
and according to the projection, has risen to 5.5% in 2022.
Thus, the change in the population growth and available food
production and supply has raised contention and an empirical
question. This suggested theoretical disparity indicates that a
low rate of food production and a high rate of population
growth will generate a high rate of food demand, thereby
giving rise to a food demand supply gap that can result in a
rise in food insecurity.
Among the development problems facing Nigeria, food
insecurity ranks highest. The national per capita food growth
of 19.57% in the production of major food items in Nigeria
has not been sufficient to satisfy the demand for an increasing
population of 212,907,083. Varrella, also reported that, on
average, between 2018 and 2020, 21.4% of the population in
Nigeria experienced food insecurity. The prevalence of severe
food insecurity among the Nigerian population has increased
in recent years, as food demand has increased in tandem with
the country's rapidly growing population.
Therefore, food insecurity remains a fundamental challenge in
Nigeria. Idachaba also reported that many households and
individuals in Nigeria merely eat for survival. The fight against
food insecurity therefore demands an integrated set of
actions. The concern for food security is a cornerstone in the
development process for every country to weaken the vicious
cycle of poverty among the teeming populations of developed
and developing countries. Food security is one of the targets
of the Sustainable Development Goals (SDG), which focus
explicitly on food by seeking to end hunger, achieve food
security and improved nutrition, and promote sustainable
agriculture. However, multiple other goals relate to challenges
in the food system, such as poverty reduction, where food has
a key role to play, and to consumption and production.
Despite the various concerns by governments all over the
world about ensuring that every household can at least
provide three square meals per day, food insecurity continues
to be a major development problem across the globe,
undermining people’s health, productivity, and often their
very survival.
COVID-19 is a pandemic caused by a novel human Coronavirus
(SARS-CoV-2), previously known as 2019-nCov (World Health
Organization). As of September 1, 2020, over 25 million cases
and 850 thousand deaths had been reported globally. The
African region was so far the least affected continent, with
1,257,315 cases and 29,862 deaths, but the numbers are
increasing. With the possibility of the COVID-19 pandemic
increasing the total number of undernourished people in the
world from 83 to 132 million in 2020 and even higher in the
years ahead, achieving food security for every Nigerian
remains a challenge, despite recent agricultural intervention
policies aimed at minimizing reliance. In Africa, Nigeria has
the fourth-highest burden of confirmed cases (54,008) and
deaths (1,013). Due to the high rate of COVID-19 spread and
the absence of a vaccine for its treatment or prevention,
Nigeria adopted "lockdown" as an approach to reverse
epidemic growth, reducing case numbers to low levels as
reported by the Nigeria Center for Disease Control (NCDC) in
2020. The lockdown strategy in Nigeria entailed social
distancing of the entire population through restriction of
social gatherings, closing of educational institutions, halting
all non-essential economic activities, and a ban on domestic
(interstate) and international travel.
The COVID-19 pandemic and subsequent lockdown created
health and economic crises that threaten food and nutrition
security. COVID-19 has devastated the labor market.
Lockdowns, movement restrictions, and reduced demand
have resulted in widespread job losses and pay cuts. Income
losses reduce access to food, especially for the poor and
vulnerable, who spend proportionally more of their income
on food, and they have an outsize effect on the incomes of
informal enterprises and workers, who make up the majority
of the agricultural sector. It has disrupted both global and
domestic agri-food supply chains. Although the impact of the
COVID-19 pandemic on international supply chains has
been limited so far and global food markets have been
well supplied and stable.
COVID-19 lockdown was implemented in Plateau state,
Nigeria, from April 10 to June 13, 2020. This COVID-19
induced lockdown has directly affected food systems through
impacts on food supply and demand and indirectly through
decreases in purchasing power due to the inability of the
working population to work. The capacity to produce and
distribute food and the intensification of care tasks, all of
which will strongly affect Nigerian households’ capacity to
meet the nutritional needs of their members. The lockdown
due to the pandemic imposed serious restrictions and
limitations on food access, both physically and socially and
economically, on the households. This in turn posed serious
hardship to households, which resulted in an unplanned
adjustment in food intake by all age categories.
Many studies have been conducted in Nigeria and other parts
of the world to assess people's food security status, but only a
few studies have empirically investigated food security status
and households coping strategies during the COVID-19
pandemic lockdown in the study area. This study has added to
the body of knowledge by finding out the per capita daily
calorie consumption by households on the one hand and the
coping strategies adopted during this period of the study on
the other. From the foregoing, the following objectives were
therefore generated:
• Describes the socioeconomic characteristics of households
in the study area.
• Determine the effect of COVID-19 pandemic lockdown on
the food security status of urban households in the study
area.
• Estimate the determinants of food status of households in
the study area.
• Rank the food insecure households based on their coping
strategies [1-6].
Materials and Methods
Study Area
Jos metropolis (comprising of Jos North and South), Plateau
state of Nigeria was the selected study area. Plateau state is
located within Central states of Nigeria and with an area of
26,899 square kilometers, located between latitude 08°24'N
and longitude 008°32' and 010°38' East while Jos metropolis
lies within latitudes 9°45'00'N to 09°57'00'N and longitudes
8°48'00'E to 8°58'00'E. Plateau state derived its name from
the geographical landscape that predominates in this part of
the country.
Jos North local government area hosts the capital city and its
headquarters which is located on latitude 9°56'21.7'' sNorth
and longitude 8°54'8''east of Greenwich Meridian (GM). It has
only of one (1) district which is Gwong district and has an area
of 291 km2 and an estimated population of 475,398 for year
2020 (NPC, 2006). The hot season lasts from February to April,
with an average daily high temperature above 88°F while the
hottest month of the year is March with an average high
temperature of 92°F and low temperature of 65°F. The cool
season lasts from July to October, with an average daily high
temperature below 79°F. Throughout the year, there are 177.3
rainfall days, and 1233 mm (48.54") of precipitation is
accumulated. Jos South local government area located
between latitudes 9°30' to 10°N and longitude 8°48'E to 8.800°
E of the Greenwich meridian. Jos South local government area
has four districts: Du, Gyel, Kuru and Vwang districts and has
total land area of about 1,037 km2 with a population
estimation of 493,818 for year 2020. The rainy season, which
is between the months of May and October, has its peak in
August. The mean annual rainfall varies between 1347.5 and
1460 mm per annum. The inhabitants of Jos North and South
are Afizere, Anaguta, Bache, Irigwe, Berom, Hausa, Yoruba and
Fulani. The inhabitants of Jos North and Jos South are
mainly farmers who combine it with hunting, while the
common food crops grown in the area include potato, sweet-potato,
maize, millet, acha, tomato and many varieties of
vegetables. The ever green vegetation and free nature of the
area makes cattle rearing, grazing and poultry farming is
viable businesses in the area. The mild climatic condition and
the accommodative nature of its people as well as tourists’
attraction have continued to attract investors (Figure 1).

Figure 1: Map of plateau state showing the local government
areas.
Sampling Procedure and Sampled Size
A multi-stage sampling technique was adopted in the
selection of households in the study area. Purposive sampling
was used in the first stage to select Gwong district, which is
the only district in Jos North; out of the four districts in Jos
south LGA, Du and Gyel districts were selected. The second
stage involved the random sampling technique in the
selection of four (4) villages: Two (2) from Gwong district, one
(1) each from Du and Gyel districts, because the inhabitants of
the locality are both high and low income earners. In the third
stage, systematic random sampling technique was used
selecting 142 and 123 households in Jos North and Jos South
respectively, thus giving a total of 265 households used for
this study.
Method of Data Collection
The data used for this study was primary. It was collected with
the use of a well-structured, open and close ended
questionnaire and an oral interview schedule designed
according to the specific objectives of the study. Data on
households’ calories, food consumption pattern and coping
strategies adopted by the respondents during this period was
collected before and after the lockdown, which was from April
10th to June 13th, 2020.
Validation and Reliability of the Research Instruments
Content validity was adopted to assess the adequacy of the
instrument items in this study. Content validity in this context
was meant to determine the appropriateness and sufficiency
of items included in the instruments. Using the Jury method,
the entire instrument was subjected to the scrutiny of
relevant specialists. Each was requested to solely give his
opinion on the appropriateness and sufficiency of the items
with respect to the specific objectives of the study. Various questions of the questionnaire were scrutinized in terms of
how relevant they are to the specific objectives of the study
as well as how the prepared questions comprehensively cover
the specific objectives otf he study. Furthermore, the
questionnaire was further assessed against the background of
its adequacy in regard to the accomplishment of the
objectives of the study.
An instrument of data collection is considered secure when it
consistently produces the same result when applied to the
same sample many times. The test-retest method of affirming
instrument reliability was employed for this study. Correlation
coefficient was calculated between two distributions of test
scores obtained at two different times from the same
respondents. The instrument was trialed on 34 respondents
from the Jos North and Jos South local government areas. The
information obtained from the responses to the instrument
was analyzed using product moment correlation analysis. A
high value of the mean product-moment correlation
coefficient of 0.816 indicated high reliability of the instrument
[7-12].
Analytical Techniques
Analytical tools such as descriptive statistics were used to
achieve objective 1, Foster Greer and Thorbeeke (FGT) Food
Security Index (FSI) was adopted to achieve objective 2, and Z-statistics
was used to achieve objective 3.
Descriptive Statistics
Percentages, means, frequency distribution, and tables were
the descriptive statistics used to depict the socioeconomic
characteristics of the households.
Food Security Index
Foster, Greer, and Thorbeeke's (FGT) Food Security Index (FSI)
was used for the determination of the food security status of
households. The identification and aggregation procedures
were achieved with the use of FGT FSI. The process of defining
a minimum level of nutrition necessary to maintain a healthy
lifestyle is called identification. Identification is referred to as
the "food security baseline," below which people are
classified as food insecure and subsisting on inadequate
nutrition. The food security line was used in this study based
on the daily recommended levels of calories and protein,
which are 2260 kcal and 65 g, respectively. In order
to generate food security indices, the nutrient content of
the food items consumed was used to derive calorie
availability. This was used to achieve Objective 2.
It is given by:
Food security index (k)=(Household daily per capita calorie consumed(X))/(Household daily per capita calorie required(Y))......... (1)
The FSI number must be greater than one for a household to
be food secure; if it is less than one (<1), the household is said
to be food insecure. The quantity of crop produced,
purchased, and received as gifts was converted to kilograms
and then to calories consumed per day per household and
then compared with the standard (2260 kcal). For the purpose
of this study, a household is a group of individuals who
contribute to and share a common economic resource base
and rely on the income from that resource base for the
greater part of their food acquisition and utilization.
Probit Regression Model
Probit model was adopted for the estimation of the factors
determining food security status among urban households in
the study area based on the households’ food security index
(Zi). The model is specified as follows:
The explicit form of the model is expressed as:
Zi=βXji+U
Zi=Household food security status (food secure households=1,
food insecure households=0)
Xj=Vector of explanatory variables
U=Error term
β=Vector of the parameter estimates
Xij are explanatory variables and are defined as follows:
X1=Farming as main occupation (1=yes, 0=no);
X2=Marital status of respondent (1=married, 0 for otherwise);
X3=Gender of respondent (1=male, 0=female);
X4=Household size (numbers);
X5=Years of formal education (years);
X6=Farming experience (years);
X7=Age (years);
X8=Household income (N);
X9=Farm size (hectares);
X10=Membership of social group (yes=1, no=0)
Coping Strategy Use Index (CSUI): This was used to identify
the coping strategies for food secure and food insecure
households in the study area. The CSUI allows for a better
understanding of the likely areas where the government or
stakeholders can intervene. In order to identify the coping
strategies used by the households, a Coping Strategy Index
(CSI) was developed by ranking. The first stage was the listing
of all the coping strategies adopted by households. This was
done by first eliciting information on coping strategies from
the households. Following that, coping strategies based on an
index were developed. The extent of use of the CSI was
expressed using a four-point Likert scale with a scoring order
of 3, 2, 1, and 0 for frequently used, occasionally used, rarely
used, and not used, respectively. The formula used for
developing the CSI score was adapted from, where they
estimated the use of ethno-veterinary medicine in livestock
management and rearing [13-18].
The CSUI was used in ranking order to know the position of
each of the CSI in terms of their use. The extent of use of the
CSI was then obtained for all households in the study area. It
should be noted that household food security is an important
dimension of well-being. Although it may not cover all dimensions of poverty, the inability of households to obtain
access to enough food for an active, healthy life is surely an
important component of their poverty. In this study, devising
an appropriate measure of food security outcomes was useful
to capture the food-insecure farming households in the study
area.
Hypothesis testing: Effect of the COVID-19 pandemic on food
security, which was carried out using the following Z-statistics:
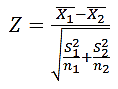
Where:
Z=Calculated Z-value.
(x̄1)=Mean of food secure or household dietary diversity score
before COVID-19.
(x̄2)=Mean of food secure or household dietary diversity score
after COVID-19.
S1=Standard deviation of food secure score before the pandemic.
S2=Standard deviation of food secure score after the pandemic.
n1=Number of food secure score before the pandemic.
n2=Number of food secure score after the pandemic.
Results and Discussion
The result found in Table 1 indicates that 53% of the households were headed by men, while 47% were headed by women. Eyob in their study indicated that the gender dimension of the households revealed that they were primarily headed by men. Male dominance implies that men are more efficient and reliable to make strong decisions, care for the family, and provide shelter for the family when compared to their female counterparts. These characteristics are important in making most men the heads of their households. It was observed during the survey that the female-headed households were those whose husbands live in another city and those that were widowed. Furthermore, the finding shows that household heads aged 20-29 (31%), 30-39 (34%), 20-29 (31%), and 40-49 (23%), were the highest while those aged >60 (3%) were lowest. The respondents’ mean age was 36. This is consistent with the findings of Abubakar, who claimed that household heads were in their prime ages and were less subject to food poverty. This means they will put their youthful energy into productive activities thereby increasing their wealth base, either through cooperative loans or bank savings thus making them less vulnerable to food shortages during the pandemic. Also, this finding suggests that the household heads were young, economically active, and viable to engage in agricultural activities. The age of a farmer plays a significant role in their productivity as the majority of farmers in Nigeria operate on a small scale with the use of crude implements, which require energy and strength for their operation. Table 1 further indicate that 50.6% of household members were married, followed by 49.6% singles, with 2% widows and 0.4% divorced constituting the smallest households. This was also observed by married households tend to have large families due to members living with them either as their children or extended families. This suggests that this study targeted the right population for this research, as research related to food security requires households. Table 1 shows that 74 percent of the respondents have a household size range of 1–5, while 22 percent have a household size range of 6–10. The smallest household size is within the range of 11 to 15 family members (4.0%). According to Egwue, et al., rural households tend to have a large family size, though this was in contrast to the small household size in this study, which might be connected to the fact that the survey site is an urban household with several government parastatals in their locality, which might have given them some level of exposure through sensitization that a small family size enjoys better economic and social lives. The implication is that households with small families will spend less on feeding, education, health care, and other living expenses for their dependents. Although households with a large family base might have the tendency to engage in farming activities without the need to hire labor, which can boost the family's income.
According to Table 1, the majority of households (73%) had tertiary education as their highest level of education, followed by primary education (68%) and secondary education (20%). This is in agreement with the findings of in his research titled "Analysis of food insecurity and coping strategies among farming households in Osun state." The result from this study suggests that the level of literacy was relatively high among the household heads. A higher level of education is expected to assist household heads with their skill sets in adopting innovations in best agricultural practices, acquiring new jobs, and stratifying people with higher socioeconomic status. Table 1 indicates that civil servants constitute the major primary occupation of the households (26%), followed by businessmen and women (24%), while others, such as farming and artisanship, constitute 15%, 23%, and 11%, respectively. This agrees with the study of who reported that the majority of the household heads are mainly civil servants and businessmen and women. The implication is that because the community is surrounded by federal government institutions, there is a high likelihood that some of the households will obtain white collar jobs.
Table 1 also shows that 68% of the households were not members of the cooperative societies, while only 32% of the households were members of the cooperative societies. This is in agreement with the findings of Egwue, et al., who observed low participation in cooperative societies among rural households. The implication is that cooperative associating helps household heads and farmers pool their resources together to enjoy the economies of scale and also assist them financially. Table 1 shows that, in terms of having access to credit facilities, the majority of the households had no access to credit facilities (64%), while only 36% of the households had access to credit facilities. This suggests low credit accessibility, as reported. The implication is that using personal funds hinders and determines households’ level of operation. This could be the reason a high proportion of households in the study area were food insecure during the lockdown.
| Variables |
Frequency |
Percentage |
|
Gender
|
| Male |
129 |
53 |
| Female |
116 |
47 |
| Total |
245 |
100 |
|
Age
|
| <20 |
1 |
0.4 |
| 20-29 |
75 |
30.6 |
| 30-39 |
83 |
33.9 |
| 40-49 |
56 |
22.9 |
| 50-59 |
22 |
9 |
| >60 |
8 |
3.3 |
| Total |
245 |
100 |
| Mean |
36 |
|
| Standard deviation |
10.748 |
|
|
Marital status
|
| Married |
124 |
50.6 |
| Single |
115 |
49.6 |
| Widow |
5 |
2 |
| Divorced |
1 |
0.4 |
| Total |
245 |
100 |
|
Household size
|
| 1-5 |
182 |
74 |
| 6-10 |
52 |
22 |
| 11-15 |
11 |
4 |
| Total |
245 |
100 |
| Mean |
4 |
|
| Standard deviation |
3.397 |
|
|
Educational level
|
| Primary level |
20 |
68 |
| Secondary level |
47 |
19 |
| Tertiary level |
178 |
73 |
| Total |
245 |
100 |
|
Primary occupation
|
| Civil Servant |
64 |
26 |
| Farming |
37 |
15 |
| Business |
60 |
24 |
| Artisanship |
27 |
11 |
|
Membership of cooperatives society
|
| Non-members |
167 |
68 |
| Members |
78 |
32 |
| Total |
245 |
100 |
|
Access to credit
|
| No access |
156 |
64 |
| Access |
89 |
36 |
| Total |
245 |
100 |
Table 1: Socioeconomic characteristics of households in the study area.
Effect of COVID-19 Lockdown on the Food Security Status of Households
Food security status of households during the COVID-19 lockdown: Table 2 result shows the food security status of the households during the COVID-19 pandemic lockdown. As shown, the food secure household was 237 before the lockdown while the number of food insecure households was 8 households as compared with 183 and 62 food secure and insecure households after the COVID-19 pandemic respectively. This could be due to reduced availability of food calorie consumption to the households arising from abrupt introduction of lockdowns. The finding in this study is at variance with the findings of who observed that the pandemic had impact on rural households, thus making large proportion of the family members to be food insecure. The headcount ratio of food secure households was 0.75 while it was 0.25 for food insecure households. The food secure head count ratio which represent the proportion of the expenditure shortfall from the minimum food calorie consumption line indicated that 3% of the food insecure households’ shortfall in terms of food calories consumption before the pandemic lockdown compared to 25% of the insecure households after the lockdown. The implication of this is that for every 10 persons in the study area, 8 persons were food secure while 2 persons were food insecure. The headcount ratio further suggests that only 75% of the individuals in the study area were food secure while 25% of these individuals were food insecure, thereby subsisting on less than the minimum recommended calorie intake of 2260 kcal [19,20].
The surplus/shortfall index which is a measure of the depth of food insecurity or measures the extent of deviation from the food security line indicate that the food secure households exceeded the calorie requirement by 0.9%, while the food insecure fell short of the recommended calorie intake by 0.4%. This indicates in relative term that the food insecure households were close to the food security line. The mean calorie available (adult equivalent per day) for food secure households was 5860.52 kcal while mean calorie available (adult equivalent per day) for food-insecure households was 1707.88 kcal. The minimum and maximum daily mean calorie intake was 2263.71 kcal and 26865.00 kcal adult equivalent per day among the food secure households while the food insecure households consumed 679.67 kcal and 2246.79 kcal adult equivalents per day. These results imply that the pandemic had effect on food security among the households.
| Items |
Before lockdown |
After lockdown |
| Food security status |
Food secure |
Food insecure |
Food secure |
Food insecure |
| Frequency |
237 |
8 |
183 |
62 |
| Mean daily calorie intake (kcal) |
14399.96 |
1793.75 |
5860.52 |
1707.88 |
| Maximum daily calorie intake (kcal) |
9250 |
2260 |
26865 |
2246.79 |
| Minimum daily calorie intake (kcal) |
2570 |
1480 |
2263.71 |
679.67 |
| Shortfall/surplus index (P) |
0.671 |
-0.026 |
0.009 |
-0.004 |
| Head count ratio (H) |
0.97 |
0.03 |
0.75 |
0.25 |
Table 2: Food security status of urban households in Jos.
Effect of COVID-19 Pandemic Lockdown on Households’ Food Security Status
As shown in Table 3, the value of the Z-statistic is 12.454 and is significant at 1% level of probability. This implies that COVID-19 lockdown had effect on the food security of urban households in Plateau state.
| Variable |
After |
Before |
| Mean |
14338.82 |
4776.55 |
| Known variance |
1.28E+08 |
15972391 |
| Observations |
245 |
245 |
| Hypothesized mean difference |
0 |
|
| Z-statistics |
12.454*** |
|
| P(Z<=z) one-tail |
0 |
|
| Z critical one-tail |
1.645 |
|
| P(Z<=z) two-tail |
0 |
|
| Z critical two-tail |
1.96 |
|
| Note: ***Significant at (p<0.01) level of significance |
Table 3: Z-test analysis showing the difference between food security status.
The Determinants of Food Security Status of Urban Households
Table 4 shows the probit regression of the determinants of food security status of urban households. Table 4 shows various variables which determine the factors affecting rural arable crop farming household food security status using the probit regression model. The results of the probit regression analysis are presented in the Table 4. From the probit analysis, the likelihood ratio statistics as indicated by χ2 statistics (41.08) are strongly significant (P<0.0001), suggesting the model has a strong explanatory power in which three variables were found to be statistically significant at P<0.001 and one was significant at P<0.005 out of eight (8) variables included in the model. Age, household size, income and amount of credit are the determinants that influence food security status of urban households. The significance effect (p<0.001and p<0.005) implies that the selected variables are the major drivers of food security status of urban households. The coefficient of age was found to be negative and significantly related to the food security status of the respondents. The result means that age was a significant factor in determining the food security status of the urban households in the study area. This implies that as age of the respondents in the study area increase, it will reduce the probability of being food insecure. This is probably because accumulated knowledge and experience of working households acquired pays off over a long period of time.
The coefficient household size was positive and statistically significant at 1% level of probability. The result implies that household size was a significant factor in determining the food security status of the urban households in the study area. This means that an increase in household size will lead to an increase in the likelihood of being food secure, particularly if the composition of the household is made up of adults who are actively involved in economic activities. The coefficient of income and amount of credit accessibility of the urban households measured was positive and statistically significant at 1% level probability. The result means that income and access to credit facilities was a significant factor in determining the food security status of the urban households in the study area. This means that an increase in income and access to credit facilities will result to an increase in the likelihood of changing the food security status of the respondents. This also means that, households with an additional source of income will be willing to meet the demand of the household and therefore are non-poor and food secure. This is in agreement with the findings. Also, as the household heads income increases, the probability of being food secure also increase. The implication of this result is that household heads with higher annual income were food secure than those with lower income. Higher income household heads may probably have much money to procure food items for consumption while a household with lower income may have less to spend on consumption. This conforms with the findings of Muche and Tadele; Ibok, et al.; Omotesho, et al., reported that income influenced the food security status of people positively. The low estimates of 10% for pseudo coefficient of determination implies that only few variables with lower weight influence the food security status of urban households. The trend in this study agrees with the report of Matchaya.
| Variables |
Coefficient |
Standard error |
T-value |
| Constant |
-0.1207 |
0.0299 |
-4.042 |
| Sex |
0.1039 |
0.1947 |
0.534 |
| Age |
0.0292*** |
0.0102 |
2.856 |
| Marital status |
0.1311 |
0.1897 |
0.691 |
| Years of schooling |
-0.0141 |
0.0343 |
-0.411 |
| Household size |
0.1172*** |
0.0363 |
3.225 |
| Income |
0.2640** |
0.1155 |
2.286 |
| Years of membership |
-0.0267 |
0.027 |
-0.992 |
| Amount of credit |
0.3960*** |
0.107 |
3.701 |
| Wald chi2(8) |
41.08 |
|
|
| Prob >chi2 |
0 |
|
|
| Pseudo R2 |
0.104 |
|
|
| Log pseudo likelihood |
-121.688 |
|
|
| Note: *** and ** significant at 1% and 5% levels of probability; Pseudo R2: Coefficient of determination. |
Table 4: Probit regression of the determinants of food security status of urban households.
Ranking of Food Insecure Households Based on their Coping Strategies
On the coping strategies ranking during the COVID-19 pandemic lockdown, the study indicated that limiting portions at mealtimes was the most widely used of all the coping strategies and ranked 1st. This is probably because of the sudden shortage of food due to closure of markets. This was closely followed by reliance on less preferred food and having had to eat less than they felt they should which ranked 2nd and 3rd respectively. The study also indicated that the food insecure households adopted ‘time you couldn't afford to eat balanced meals’, ‘reliance on only a few kinds of low cost food’ to feed the children and ‘ever cut the size of any of the children's meals’ which ranked 4th, 5th and 6th respectively as a means of coping during the COVID-19 pandemic lockdown. These coping strategies were adopted by the households probably because of the soaring food prices arising from the demand supply gap. This agrees with the study by who reported that majority of the households adopted decreasing number of meal serving time, size of meal as their coping mechanism to cope up with the risks of food shortage and/or food insecurity. Households also adopted ‘cut the size of meals or skip meals and lose weight because there wasn't enough food, purchase food on credit, reliance on help from a relative and borrow money to buy foodstuff purchase food on credit were ranked 7th, 8th, 9th, 10th and 11th respectively. These arose probably because households found it difficult to get to the banks and the Automated Teller Machine (ATM) during the lockdown and where the ATM were operational, there was insufficient funds in them, hence households had to resort to credit purchases and reliance on relative who live in close vicinities to get cash to meet their immediate food needs. Ever hungry but didn't eat, ever hungry but you just couldn't afford more food and Ever not eat for a whole day were ranked 12th, 13th and, 14th other coping strategies adopted by the households during the lockdown. This could be due to the fact that households’ heads were out of cash arising the fact that they are self-employed and businesses and business centres and markets were closed. The least adopted coping strategies were ‘children skip a meal’ and ‘children ever not eat for a whole day’ were ranked 15th and 16th respectively. In the overall, the distribution indicated the importance of scale of preference of insecure urban households in the choice of COVID-19 lockdown coping strategies against food insecurity. Similarly, the study stressed the importance of credit as a means of coping with food security risks. Credit is an important coping strategy with food insecurity risks and this has been confirmed in a study by Adegoroye, et al., in Ondo state, Nigeria who in their finding reported the importance of credit in coping with adverse economic conditions.
| Food coping strategy during COVID-19 |
Frequently used |
Occasionally used |
Rarely used |
Not used |
CSUI |
Ranking |
| Limit portions at mealtimes |
39 |
17 |
3 |
3 |
154 |
1st |
| Rely on less preferred food |
35 |
15 |
7 |
5 |
142 |
2nd |
| Ever eat less than you felt you should |
39 |
9 |
6 |
8 |
141 |
3rd |
| Time you couldn't afford to eat balanced meals |
32 |
15 |
8 |
7 |
134 |
4th |
| Rely on only a few kinds of low-cost food to feed the children |
31 |
16 |
9 |
6 |
134 |
4th |
| Ever cut the size of any of the children's meals |
19 |
33 |
8 |
2 |
131 |
6th |
| Cut the size of your meals or skip meals |
34 |
7 |
13 |
8 |
129 |
7th |
| Lose weight because there wasn't enough food |
32 |
9 |
12 |
9 |
126 |
8th |
| Purchase food on credit |
9 |
27 |
9 |
17 |
90 |
9th |
| Rely on help from a relative |
9 |
23 |
9 |
21 |
82 |
10th |
| Borrow money to buy foodstuff |
9 |
12 |
27 |
14 |
78 |
11th |
| Ever hungry but didn't eat |
7 |
22 |
12 |
21 |
77 |
12th |
| Ever hungry but you just couldn't afford more food |
15 |
13 |
4 |
30 |
75 |
13th |
| Ever not eaten for a whole day |
8 |
9 |
13 |
32 |
55 |
14th |
| Children skip a meal |
11 |
7 |
1 |
43 |
48 |
15th |
| Children ever not eaten for a whole day |
7 |
8 |
8 |
39 |
45 |
16th |
Table 5: Ranking of food insecurity coping strategies on insecure households based on their frequency of use.
Conclusion
In conclusion, socioeconomic characteristics such as age,
gender, and marital status, level of education, household size
and membership of cooperative were important in describing
the household heads in the study area. The result of food
security status indicated that the food secure households
consumed an average daily calorie of 14,399.96 Kcal before
the pandemic lockdown while 5,860.52 Kcal was consumed
after the pandemic lockdown; 1,793.75 Kcal was consumed by
the food insecure households before the pandemic while
1,707.88 Kcal was consumed after the pandemic lockdown. It
indicated that the pandemic lockdown had effect on the food
security status of the urban households as indicated by the Z-statistic
score (12.454***) and significant at 1% level of
probability. Age (1% level), household size (1% level), income
(5% level) and amount of credit (1% level) were the significant
determinants that influenced the food security status of the
households; limited portions at mealtimes, reliance on less
preferred food, ate less than they felt they should, times they
couldn't afford to eat balanced meals and reliance on only a
few kinds of low-cost food to feed the children were the
highest ranked coping strategies adopted by households
during the lockdown. Having found the presence of food
insecurity during COVID-19 among households, it can be
concluded that the understanding of the effect of the
COVID-19 pandemic lockdown on food security status of
households and the adopted coping strategies are important
in developing policy measures such as social safety nets,
home feeding programmes, the school feeding programme,
conditional cash transfers schemes and improved marketing
channels that will help mitigate against households falling into
food insecurity during similar pandemic in the future.
Acknowledgements
The authors hereby use this medium to appreciate the
respondents for their cooperation and support in supply
valuable information without which this study would not have
been possible.
References
- Adegoroye A, Adewale IO, Aturamu OA (2021) Determinants of food security status and coping strategies to food insecurity among rural crop farming households in Ondo state, Nigeria. Eur J Nutr. 13(7):39-50.
[Google Scholar]
- Abubakar MI (2010) Analysis of cowpea production under the national programme on food security in Argungu local government area of Kebbi state, Nigeria. Nig J Basic Appl Sci. 16(2):1-5.
[Google Scholar]
- Agboola PO (2004) Analysis of food insecurity and coping strategies among farming household in Osun area of Southwestern Nigeria. Int J Agric For Soc Sci. 6(2):1-5.
[Crossref]
- Agidew AA, Singh KN (2018) Determinants of food insecurity in the rural farm households in South Wollo zone of Ethiopia: The case of the Teleyayen sub water. shed Agric Food Econ. 6(1):1-10.
[Google Scholar]
- Babatunde RO, Omotesho OA, Sholotan OS (2007) Socio economic characteristics of food security status of farming household in Kwara state, North Central Nigeria. Pak J Nutr. 6(1):49-58.
[Google Scholar]
- Wabbi JB (2002) Assessing factors affecting adoption of agricultural technologies: The case of Integrated Pest Management (IPM) in Kumi district, Eastern Uganda. Jackline Bonabana-Wabbi. Virgin Tech Publishers, Multivariate logit, Uganda.1-147.
[Google Scholar]
- Egwue OL, Agbugba Ik, Mukaila R (2020) Assessment of rural households food insecurity during COVID-19 pandemic in South-East Nigeria. Int J Res Granthaalayah. 8(12):182-194.
[Crossref] [Google Scholar]
- Otunaiya AO, Ibidunni OS (2014) Determinants of food security among rural farming households in Ogun state, Nigeria. J Sustain Dev. 16:33-44.
[Google Scholar]
- Mango N, Zamasiya B, Makate C, Nyikahadzoi K, Siziba S (2018) Factors influencing household food security among smallholder farmers in the Mudzi district of Zimbabwe. Dev South Afr. 31(4):625-640.
[Crossref] [Google Scholar]
- Ibok OW, Idiong IC, Bassey NE, Udoh ES (2014) Food security and productivity of urban food crop farming households in Southern Nigeria. Agric Sci 2(3):1-12.
[Google Scholar]
- Matchaya GA (2012) Estimating effects of constraints on food security in malawi: Policy Lessons from regressions quantiles. Appl Econom Int. 12(2):165-191.
[Google Scholar]
- Muche M, Tadele E (2015) Analysis of household level determinants of food security in Jimma Zone, Ethiopia. J Econ Sustain Dev. 6(9):230-241.
[Google Scholar]
- Omonona BT, Akinterinwa AT, Awoyinka YA (2008) Credit constraint and output supply of Cowan farmers in Oyo state Nigeria. Eur J Soc. 6(3):382-390.
[Google Scholar]
- Folorunso ST, Alabi RO, Stephen A (2023) Evaluation of the effect of covid-19 pandemic lockdown on food security among Urban households in Jos, Plateau state, Nigeria. J Dev Soc. 57(1):13-27.
[Crossref] [Google Scholar]
- Amusan L, Agunyai SC, Ikedinma HA (2022) Herders mobility, food security and COVID-19 pandemic challenges during Lockdown in Nigeria. Gender and Behaviour, 20(3):20311-20326.
[Google Scholar]
- Omotesho OA, Adewumi MO, Muhammad LA, Ayinde O (2006) Determinants of food security among the rural farming households in Kwara state, Nigeria. Afr J Agric Res. 2(1):7-15.
[Google Scholar]
- Sanusi RA, Badejo CA, Yusuf BO (2006) Measuring household food insecurity in selected local government areas of Lagos and Ibadan Nigeria. Pak J Nutr. 5(1):62-67.
[Google Scholar]
- Seid S, Biruk K (2019) Analysis of households food insecurity and its coping mechanisms in Western Ethiopia. Agric Food Econ. 7(1):1-5.
[Crossref] [Google Scholar]
- Smith LC, Ali S (2007) Measuring food security using household expenditure surveys. Washington, D.C. Intl Food Policy Res Inst. USA. 1-147.
[Google Scholar]
- Wang Y, Di Y, Ye J, Wei W (2020) Study on the public psychological states and its related factors during the outbreak of Coronavirus Disease 2019 (COVID-19) in some regions of China. Psychol Health Med. 30:1-10.
[Crossref] [Google Scholar] [PubMed]
Citation: Folorunso ST, Momoh OY, Yusuf BE, Silas YG, Ameh AD (2023) Assessment of Food Security Determinants and Coping
Strategies of Urban Households during COVID-19 Pandemic Lockdown in Jos, Plateau State, Nigeria. Adv Appl Sci Res. 14:12.
Copyright: © 2023 Folorunso ST, et al. This is an open-access article distributed under the terms of the Creative Commons
Attribution License, which permits unrestricted use, distribution, and reproduction in any medium, provided the original author
and source are credited.