Keywords
Power transformers; Degree of polymerization; Oil insulation characteristics; DGA; Fulfural compound; ANFIS
Introduction
Power transformers are critical links within transmission and distribution networks which play important role to maintain continuity and sustainability of the electricity grids. Reliable and effective condition monitoring and diagnostic techniques must be employed to avoid unplanned outages of the equipment. Early diagnosis and detection of specific dissolved gases in transformer oil has become the fastest technique in detecting incipient faults within the power transformer [1-5]. Dissolved Gas Analysis (DGA) uses several specific gases concentrations that are produced due to oil decomposition and insulating paper degradation [1-5]. Several factors are considered as accelerating aging factors for power transformers such as water content in solid and liquid insulation, operating temperature and oil oxidation [6-8]. The presence of moisture, oxygen and acids are due to de-polymerization and decomposition of cellulose chains that lead to the paper insulation degradation itself [9-12]. Several statistical surveys confirmed that most of the failures in power transformers are attributed to the insulation system degradation, in particular paper insulation as the remaining life of operating transformer is equivalent to the life of its solid insulation [10].
Quality of the solid insulation system can be assessed through its degree of polymerization (DP) [8-11]. However, it is impractical to collect paper insulation samples from operating power transformers especially from hot spot locations. As such, several correlations between DP and Furanic compounds that are generated in the insulating oil due to cellulose decomposition have been published in the literatures [13,14]. These correlations are not consistent as they may lead to different DP value for the same Furan concentration. Moreover, the correlation between DP and Furan is not valid for thermally upgraded papers and when biodegradable insulation oil is used. This paper investigates the correlation between the DP and other routinely measured parameters such as oil dielectric characteristics and DGA data. The commonly measured parameters that have high correlation with DP can be used as an alternative way to estimate DP value of solid insulation in case that furfural data are not available (e.g. in Indonesia).
Several research in transformer diagnosis based on artificial intelligence have been conducted especially in predicting the life of operational transformers using interfacial tension (IFT) and acidity number data [15]. The relationship between DGA data especially carbon oxides and the paper insulation’s quality was investigated [16] using fuzzy logic model. It is to be noted that while the carbon oxides may provide an idea about the degradation level in paper insulation, it is not very accurate as carbon oxides may be generated due to atmospheric leak or oil oxidation [16]. While the work presented [17,18] investigated the relationship between the DP of transformer paper insulation and the DGA within the transformer oil, it did not take into account the impact of transformer rating and size which is the main focus of this paper.
Research Methodology
Data such as dissolved gas analysis, dielectric oil characteristics and furfural compounds are collected from two operating transformers at PT. PLN (Persero), Indonesia. Data were collected from 200 transformers of rating 150/20 kV, 60 MVA and 30 MVA and 42 transformers of 500 MVA and 166.66 MVA, 500/150 kV rating.
Parameters of the dielectric oil characteristics used in this paper include the voltage breakdown in kV based on IEC 60156-02 [19-22], water content in ppm based on IEC 60814 [23], acidity number in mg KOH/g based on IEC 62021-1 [24], interfacial tension value in dyne/cm based on ASTM D 971-99a [25] and power transformer oil colour based on ISO 2049 [26].
Results of DGA tests used in this paper include H2 (Hidrogen), CH4 (Methane), CO (carbon monoxide), CO2 (carbon dioxide), C2H6 (Ethane), C2H4 (Ethylene) and C2H2 (Acetylene), all in ppm.
For all collected oil data, 2-Furaldehyde (2FAL) furan compound was also measured. Stebbins equation below is used in PT. PLN (Persero) to estimate the paper DP value for non-upgraded kraft paper using the 2FAL concentration [14]:
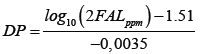 (1)
(1)
Correlation analysis using basic multiple regression is usually applied to find a correlation between multiple parameters [21].
In this paper, the basic linear regression method is employed to examine the correlation between the investigated parameters and the paper DP. The range of the correlation coefficient paramater (r) is from -1 to +1 whereas the closer of r value to - 1 or +1, the correlation between two parameters becomes more significant. T-test with α=0.05 is applied to ensure and verify the correlation; α is a reference parameter used as an indicator of significancy level of the performed linear regression. If the value of P, a parameter produced by the linear regression process called Pearson correlation coefficient [20], is less than α the linear regression result becomes significant.
Adaptive Neuro Fuzzy Inference System (ANFIS) provides the benefits of both ANN (Artificial Neural Networks) and the fuzzy logic for computation and logical analysis. This system can set up an input-output mapping based on fuzzy if-then rules in the human knowledge and set out input-output data pairs [19]. The fuzzification of the input parameters and the membership functions (MF) are the first two steps in developing ANFIS models.
Figure 1 shows two-input ANFIS model’s structure. Hybrid algorithm, a combination of least squares and backpropagation method is used to train the MF. Input of the model are x and y while f is the output parameter. All nodes are adaptive at the first layer, Ai and Bi defined as linguistic label (high, low,…), μAi and μBi, represent the membership function of each node. Each node called Π is non-adaptive at the second layer. At second layer, each output node stands for the degree of activation. At the third layer, N is nonadaptive and its role is to normalize the degree of activation by counting the ratio between the first node of the previous layer to all layers. At the fourth layer, each node is adaptive. Fuzzy if-then function are labelled as f1 and f2, the output of the third layer defined as wi and ( pix + qiy + ri ) is an adaptive parameter. At the fifth layer, each node labelled Σ is nonadaptive. Overall output of the ANFIS model is generated at the fifth layer [19].
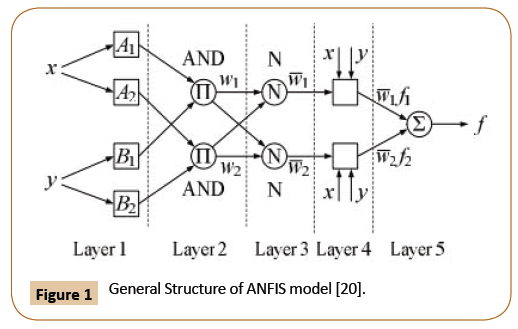
Figure 1: General Structure of ANFIS model [20].
In ANFIS, calculations are repeated per epoch using the feedforward and reverse pass calculations until the maximum number of epochs is reached or the respective error function is not further minimized. Each epoch sets training, input, and target vectors to a network and calculates new parameters of the MFs.
The accuracy of the proposed ANFIS model in estimating the DP is computed based on the RMSE (Root Mean Squared Error) value, MAE (Mean Absolute Error) value and MAPE (Mean absolute percentage error) value [27].
In eqn. (2), the RMSE is measured for a target sequence t and forecast sequence f with N time steps.
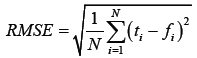 (2)
(2)
MAE criterion calculates the gap between the estimated and the target DP.
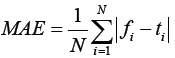 (3)
(3)
On the other hand, MAPE evaluates the prediction error as a percentage between the actual DP to the target DP value.
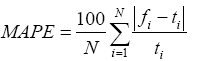 (4)
(4)
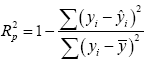
Linear regression is also conducted to get the best combination subsets of several parameter. Some criteria like R2 criteria (R-sq, R-sq[adj], and R-sq [pred]), s2 and Cp-Mallows value are applied.
Coefficient of multiple determination, R2 or R(sq) defined as a ratio of sum of squares is calculated as [20,21]:
 (5)
(5)
R(sq)-adj or commonly called the adjusted coefficient of multiple determination is calculated from [20,21]:
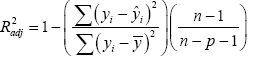 (6)
(6)
R(sq)-pred or generally called the predicted coefficient of multiple determination is calculated as below [20,21]:
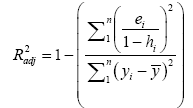
 takes the number of parameters n in the model into account. Mallow constant CP is specified as the predicted value obtained from a regression equation based on a subset of variables that are commonly biased. It can be calculated from [20,21]:
 (7)
(7)
s value or commonly called Residual Mean Square is defined as [20,21]:
 (8)
(8)
where:
yi=ith observed response value
 = mean response
 =ith fitted response
n=number of observations
p=number of terms in model
ei=ith residual
hi=ith diagonal element of X(X' X)-1X'
X=design matrix.
Correlation Analysis
Data statistical analysis are performed using Pearson correlation coefficient to investigate the correlation between dissolved gases, oil characteristic data and the DP of paper insulation that is calculated from the 2-FAL data based on eqn. (1). Data collected from two transformer fleets of different ratings are used in this analysis as elaborated below.
30 MVA and 60 MVA, 150/20 kV transformers
Oil samples collected from 200 transformers of 30 MVA and 60 MVA, 150/20 kV ratings were collected and the DGA, furfural, acidity, and IFT were measured following the respective standards. The paper DP value for each transformer was calculated using eqn. (1). Correlation analysis was performed for each dissolved gas and the results are listed in Table 1. Results in Table 1 shows that the value of P is less than 0.05 in case of H2, CO, CO2. The r value on the other hand, is closer to ±1 in case of CO2, CO and H2. This reveals the strong correlation between CO2, CO, H2 and the DP value. Combining CO and CO2 leads to better correlation as shown in Figure 2 and Table 1 that depicts the scatter plots for CO+CO2 against the DP value. Results show that more concentration of CO+CO2 in the oil sample indicates more deterioration in the cellulose and hence a reduced value for the DP.
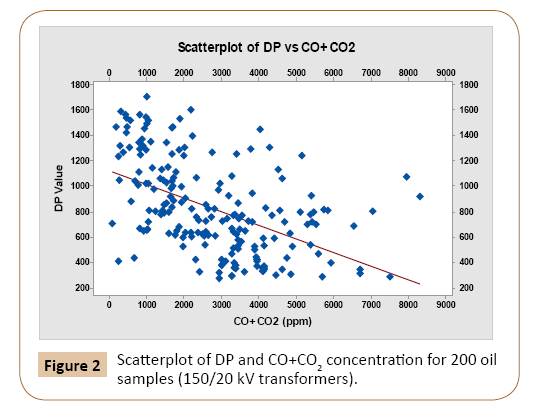
Figure 2: Scatterplot of DP and CO+CO2 concentration for 200 oil samples (150/20 kV transformers).
Table 1: Correlation Coefficient of DP and dissolved gases data of 200 oil samples (150/20 kV transformers).
| Gasses from DGA test |
r (correlation coefficient) |
p value |
| H2 (Hidrogen) in ppm |
-0.200156231 |
0.004 |
| CH4 (Methane) in ppm |
-0.132735397 |
0.061 |
| CO (Carbon Monoxide) in ppm |
-0.359815467 |
0 |
| CO2 (Carbon Dioxide) in ppm |
-0.454084816 |
0 |
| CO+CO2 in ppm |
-0.499712213 |
0 |
| C2H4 (Ethylene) |
-0.111333276 |
0.117 |
| C2H6 (Ethane) |
-0.097799442 |
0.168 |
| C2H2 (Acetylene) |
-0.137760631 |
0.052 |
Each dielectric oil characteristic and the DP value are processed using correlation analysis as shown in Table 2. Results in Table 2 indicates highly correlated parameters with the DP value are acidity number, interfacial tension (IFT), and oil colour parameters as revealed from the correlation coefficients. On the other hand, water content and voltage breakdown (VBD) of the oil are of less correlation to the DP value. Figures 3-5 show the scatter plots for acidity, interfacial tension, and colour and the DP value. Results show that, the DP value will be reduced for higher acidity and less IFT numbers. From the correlation analysis, several independent variables are found to have close relationship with the DP value, so multicollinearity test should be performed [20]. Results of multicollinearity test shown in Table 3 reveal that CO2 and CO+CO2 have correlation coefficient values close to 1 and p-value less than 0.05 so independent parameter CO2 is eliminated from the chosen parameters to predict the DP Value.
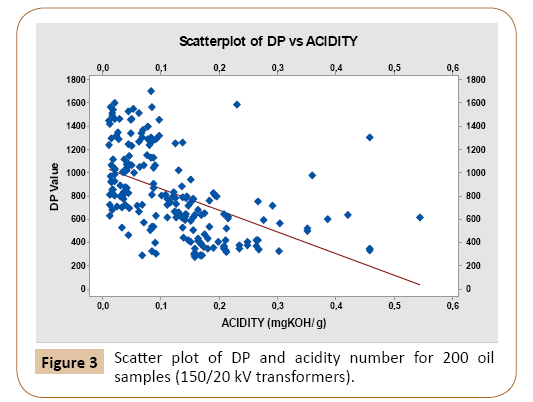
Figure 3: Scatter plot of DP and acidity number for 200 oil samples (150/20 kV transformers).
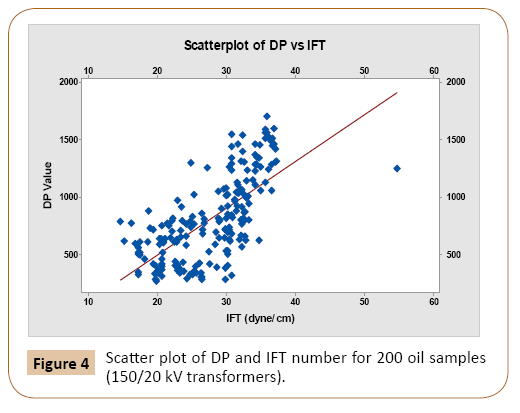
Figure 4: Scatter plot of DP and IFT number for 200 oil samples (150/20 kV transformers).
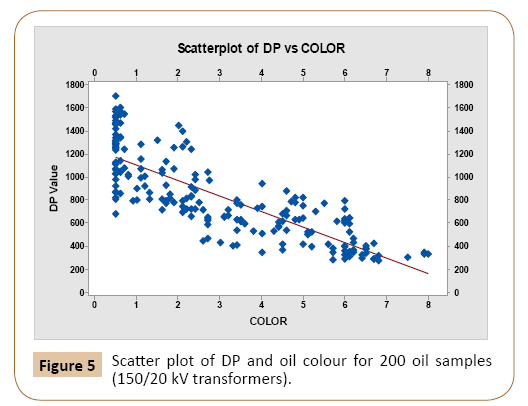
Figure 5: Scatter plot of DP and oil colour for 200 oil samples (150/20 kV transformers).
Table 2: Correlation Coefficient of DP and dielectric characteristic data of 200 oil samples (150/20 kV transformers).
| Oil Dielectric Characteristic |
r (correlation coefficient) |
p value |
| ACIDITY Number in mgKOH/g |
-0.502554956 |
0 |
| WATER CONTENT in ppm |
-0.245657978 |
0 |
| IFT (Interfacial Tension) in dyne/cm |
0.680202495 |
0 |
| VBD (Voltage Breakdown) in kV |
0.29923926 |
0 |
| OIL COLOUR |
-0.820097054 |
0 |
Table 3: Several Independent variables Multicollinearity test of 200 oil samples (150/20 kV transformers).
| |
TDCG |
Acidity |
IFT |
CO |
CO2 |
CO+CO2 |
| ACIDITY |
0.1 |
|
|
|
|
|
| 0.159 |
|
|
|
|
|
| IFT |
-0.219 |
-0.652 |
|
|
|
|
| 0.002 |
0 |
|
|
|
|
| CO |
0.703 |
-0.074 |
-0.032 |
|
|
|
| 0 |
0.3 |
0.649 |
|
|
|
| CO2 |
0.394 |
0.139 |
-0.178 |
0.199 |
|
|
| 0 |
0.049 |
0.012 |
0.005 |
|
|
| CO+CO2 |
0.513 |
0.116 |
-0.174 |
0.389 |
0.98 |
|
| 0 |
0.101 |
0.014 |
0 |
0 |
|
| COLOUR |
0.376 |
0.593 |
-0.682 |
0.217 |
0.36 |
0.382 |
| 0 |
0 |
0 |
0.002 |
0 |
0 |
Several combinations of the investigated parameters are then tested to get the best combination to predict the DP value. R-q, R-sq (adj), R-sq (pred), Mallows Cp and S parameters are employed to identify the optimum combination of the investigated parameters. Selecting and evaluating the best regression equation is mainly based on the criteria: the maximum R (R-sq, R-sq[adj], and R-sq [pred]) and consistency of variables pattern with equations, the minimum s2 and the value of Cp-MallowsSeveral combinations of the investigated parameters are then tested to get the best combination to predict the DP value. R-q, R-sq (adj), R-sq (pred), Mallows Cp and S parameters are employed to identify the optimum combination of the investigated parameters. Selecting and evaluating the best regression equation is mainly based on the criteria: the maximum R (R-sq, R-sq[adj], and R-sq [pred]) and consistency of variables pattern with equations, the minimum s2 and the value of Cp-Mallows which is the same with the number of regression parameter. Results in Table 4 show that the optimum combination is number 15 in the table. This combination comprises total carbon oxide (CO+CO2), acidity number, Interfacial Tension, and oil colour achieved the highest R-Sq. On the other hand, the value of R-sq (pred) is nearly equal to R-sq (adj) value and the mallows Cp value is exactly the same as the number of parameters used (CO, CO2, IFT and colour). The S value is also the lowest among all of other combination groups.
Table 4: Various combinations of all selected independent variable for DP value Prediction (150/20 kV transformers).
| Combination No. |
R-Sq Value |
R-Sq (adj) Value |
R-Sq (pred) Value |
Mallows Cp |
S value |
Total Carbon Oxide (CO+CO2) |
Acidity Number |
Interfacial Tension (IFT) |
Oil Color |
| 1 |
25 |
24.6 |
23.1 |
392.2 |
317.2 |
X |
|
|
|
| 2 |
25.3 |
24.9 |
23.1 |
390 |
316.6 |
|
X |
|
|
| 3 |
46.3 |
46 |
44.9 |
225.3 |
268.44 |
|
|
X |
|
| 4 |
67.3 |
67.1 |
66.6 |
60.7 |
209.55 |
|
|
|
X |
| 5 |
70 |
69.7 |
69.2 |
41.3 |
201.12 |
|
|
X |
X |
| 6 |
46.9 |
46.3 |
44.4 |
222.5 |
267.59 |
|
X |
X |
|
| 7 |
45 |
44.4 |
42.6 |
237.2 |
272.27 |
X |
X |
|
|
| 8 |
61.3 |
60.9 |
59.8 |
109.7 |
228.49 |
X |
|
X |
|
| 9 |
71.3 |
71 |
70.5 |
30.9 |
196.64 |
X |
|
|
X |
| 10 |
67.3 |
67 |
66.4 |
62.4 |
209.96 |
|
X |
|
X |
| 11 |
61.9 |
61.3 |
59.8 |
107.1 |
227.33 |
X |
X |
X |
|
| 12 |
70.3 |
69.8 |
69.2 |
40.9 |
200.62 |
|
X |
X |
X |
| 13 |
71.6 |
71.1 |
70.5 |
30.9 |
196.27 |
X |
X |
|
X |
| 14 |
75 |
74.6 |
74.1 |
3.8 |
183.92 |
X |
|
X |
X |
| 15 |
75.1 |
74.6 |
73.9 |
5 |
184.03 |
X |
X |
X |
X |
500 MVA and 166.67 MVA, 500/150 kV transformer
To investigate the impact of transformer rating on the proposed DP-oil characteristic correlation, same analysis explained above was performed on oil samples collected from 42 power transformers of 500 MVA and 166.67 MVA, 500/150 kV rating. Table 5 shows the correlation coefficients between DP and various dissolved gases. Similar to the above case study, it can be seen that CO+CO2 has significant correlation with the DP. This correlation is plotted in Figure 6. Correlation analysis of each oil dielectric characteristic and the DP value was also performed and results are listed in Table 6. Again, acidity, IFT and oil colour are considered to be the highly correlated parameters with the DP value than water content and oil voltage breakdown. The correlation between these three parameters and the DP value are depicted in Figures 7-9.
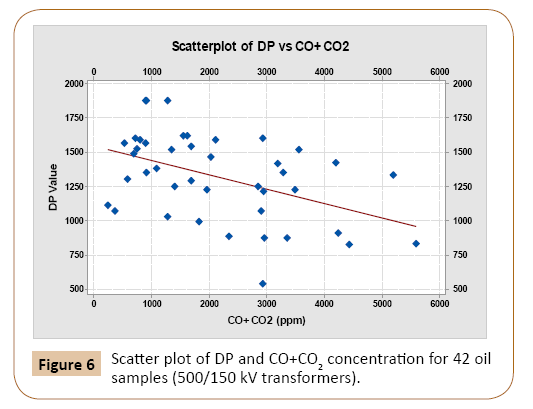
Figure 6: Scatter plot of DP and CO+CO2 concentration for 42 oil samples (500/150 kV transformers).
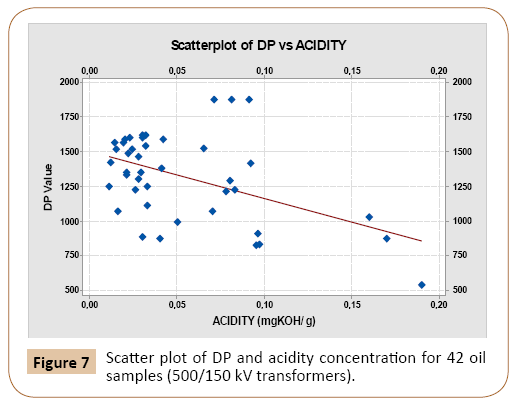
Figure 7: Scatter plot of DP and acidity concentration for 42 oil samples (500/150 kV transformers).
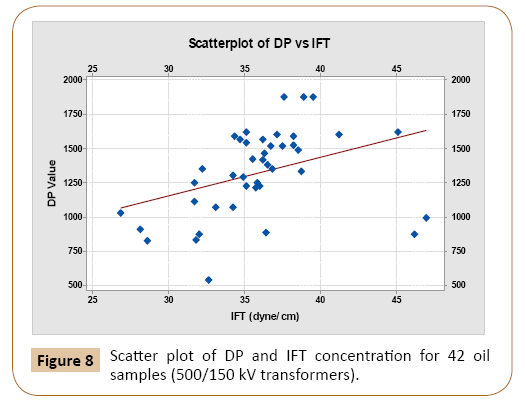
Figure 8: Scatter plot of DP and IFT concentration for 42 oil samples (500/150 kV transformers).
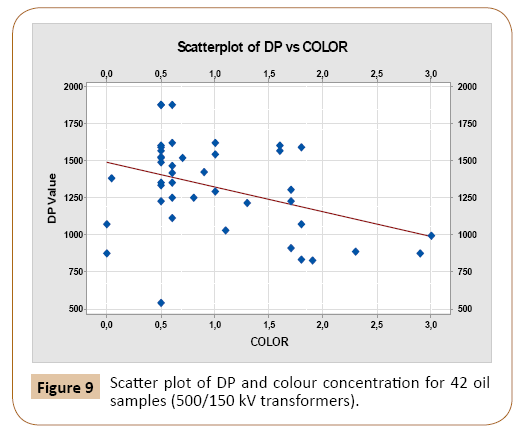
Figure 9: Scatter plot of DP and colour concentration for 42 oil samples (500/150 kV transformers).
Table 5: Correlation Coefficient of DP and dissolved gases data of 42 oil samples (500/150 kV transformers).
| Gasses from DGA test |
r (correlation coefficient) |
p value |
| H2 (Hidrogen) in ppm |
-0.023710916 |
0.861 |
| CH4 (Methane) in ppm |
-0.196051018 |
0.213 |
| CO (Carbon Monoxide) in ppm |
-0.060570558 |
0.703 |
| CO2 (Carbon Dioxide) in ppm |
-0.451567635 |
0.003 |
| CO+CO2 in ppm |
-0.461077956 |
0.002 |
| C2H4 (Ethylene) |
-0.240100404 |
0.126 |
| C2H6 (Ethane) |
-0.214704174 |
0.172 |
| C2H2 (Acetylene) |
-0.05175006 |
0.745 |
Table 6: Correlation Coefficient of Degree of Polymerization value against dielectric characteristic data of 42 samples 500/150 kV transformers.
| Oil Dielectric Characteristic |
r (correlation coefficient) |
p value |
| ACIDITY Number in mgKOH/g |
-0.471047001 |
0.002 |
| WATER CONTENT in ppm |
0.006977088 |
0.965 |
| IFT (Interfacial Tension) in dyne/cm |
0.376374821 |
0.014 |
| VBD (Voltage Breakdown) in kV |
0.216165611 |
0.169 |
| OIL COLOUR |
-0.383317116 |
0.012 |
Table 7 shows that the optimum combination comprises total carbon oxide (CO+CO2), acidity number, Interfacial Tension, and oil colour based on the above mentioned statistical parameters.
Table 7: Various combinations of all selected independent variable for DP value Prediction (500/150 kV transformers).
| Combination No. |
R-Sq Value |
R-Sq (adj) Value |
R-Sq (pred) Value |
Mallows Cp |
S value |
Total Carbon Oxide (CO+CO2) |
Acidity Number |
Interfacial Tension (IFT) |
Oil Color |
| 1 |
21.3 |
19.3 |
13.2 |
24.9 |
281.57 |
X |
|
|
|
| 2 |
22.2 |
20.2 |
14.5 |
24.1 |
279.9 |
|
X |
|
|
| 3 |
14.2 |
12 |
0 |
30.6 |
293.98 |
|
|
X |
|
| 4 |
14.7 |
12.6 |
6.4 |
30.1 |
293.07 |
|
|
|
X |
| 5 |
34.8 |
31.5 |
20.5 |
16 |
259.41 |
|
|
X |
X |
| 6 |
26.8 |
23 |
7.6 |
22.5 |
274.95 |
|
X |
X |
|
| 7 |
35.2 |
31.8 |
24.8 |
15.8 |
258.76 |
X |
X |
|
|
| 8 |
32.1 |
28.6 |
15.6 |
18.2 |
264.74 |
X |
|
X |
|
| 9 |
29.3 |
25.7 |
19.1 |
20.5 |
270.24 |
X |
|
|
X |
| 10 |
39.7 |
36.6 |
29.3 |
12.2 |
249.53 |
|
X |
|
X |
| 11 |
39.5 |
34.7 |
19.8 |
14.3 |
253.24 |
X |
X |
X |
|
| 12 |
47.7 |
43.6 |
30.9 |
7.7 |
235.35 |
|
X |
X |
X |
| 13 |
46.5 |
42.3 |
34.9 |
8.7 |
238.13 |
X |
X |
|
X |
| 14 |
44.9 |
40.6 |
29.4 |
10 |
241.63 |
X |
|
X |
X |
| 15 |
53.7 |
48.7 |
35.7 |
5 |
224.56 |
X |
X |
X |
X |
From the correlation analysis and linear regression for the two investigated transformer fleets, the four optimum parameters; total carbon oxides, acidity number, Interfacial Tension, and oil colour are used as input to the proposed ANFIS model to predict the DP value as shown in Figure 10.
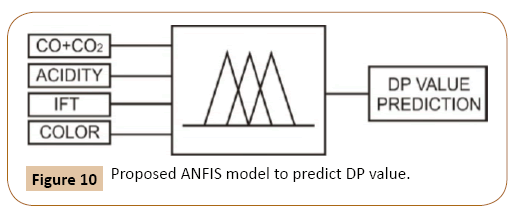
Figure 10: Proposed ANFIS model to predict DP value.
Results and Discussion
The ANFIS toolbox in MATLAB is utilised to realize the mapping between input and output parameters shown in Figure 10. To create ANFIS model, 140 samples of transformers data as training data set are applied with membership function selection listed in Table 8. Figure 11 presents the target DP value and the predicted DP value using the proposed ANFIS model during the testing stage using 60 samples. The results show that the error is insignificant and can be neglected which reveals the high accuracy of the proposed ANFIS model to predict the paper DP value based on oil dielectric characteristics.
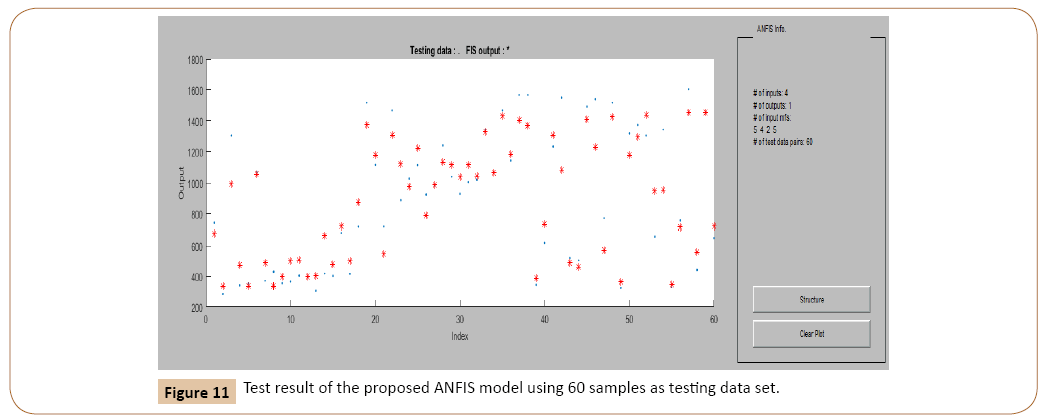
Figure 11: Test result of the proposed ANFIS model using 60 samples as testing data set.
Table 8: The Best MF number and MF type of the proposed ANFIS Model.
| Input of Independent Variable |
MF Number |
MF Type |
| Total Carbon Oxide (CO+CO2) |
5 |
trapmf |
| Acidity Number |
4 |
trapmf |
| Interfacial Tension (IFT) |
2 |
trapmf |
| Oil Colour |
5 |
trapmf |
To evaluate the precission of the proposed ANFIS model in predicting the DP value based on oil dielectric characteristics, 24 tested oil samples were collected from various operating transformers and the proposed ANFIS model was used to predict the DP paper value corresponding to each sample. Comparing the calculated DP value and the predicted DP value using the developed ANFIS model in Table 9 reveals the high accuracy of the model in predicting the DP value. Several evaluation criteria and performance indicators have been employed to assess the accuracy of the developed ANFIS model as shown in Table 10. The mean absolute error is found to be less than 14% and the overall accuracy of the proposed model is found to be higher than 86%.
Table 9: Accuracy test for the proposed ANFIS Model.
| CO+CO2 |
ACIDITY |
IFT |
COLOUR |
2 FAL value (ppm) |
DP calculated |
DP predicted |
| 4081.26 |
0.19 |
25.3 |
6.1 |
2091.96 |
355.70 |
337.53 |
| 1699.83 |
0.014 |
32 |
1.1 |
6.74 |
1067.67 |
1054.99 |
| 3325.509 |
0.167 |
25.5 |
6 |
1496.59 |
397.261 |
402.32 |
| 3049.77 |
0.248 |
20.6 |
6.5 |
1421.83 |
403.619 |
478.89 |
| 1860.79 |
0.163 |
26.6 |
4.5 |
151.02 |
681.85 |
720.28 |
| 3948.619 |
0.263 |
22.9 |
4.5 |
1272.81 |
417.35 |
499.34 |
| 776.47 |
0.037 |
31.6 |
0.5 |
4.65 |
1113.73 |
1176.26 |
| 1646.36 |
0.02 |
31.2 |
0.5 |
13.56 |
980.93 |
983.15 |
| 965 |
0.04 |
30 |
0.8 |
10 |
1018.72 |
1043.66 |
| 773.799 |
0.066 |
34.7 |
0.6 |
0.73 |
1343.48 |
1326.93 |
| 2320.591 |
0.049 |
32.2 |
0.5 |
6.75 |
1067.489 |
1066.16 |
| 464.81 |
0.028 |
36.9 |
0.6 |
0.27 |
1466.901 |
1430.88 |
| 1146.523 |
0.045 |
32.9 |
0.6 |
3.66 |
1143.43 |
1181.66 |
| 3374.773 |
0.234 |
23.3 |
5.7 |
2239.45 |
347.25 |
389.42 |
| 985.752 |
0.015 |
36.4 |
0.5 |
0.22 |
1492.31 |
1410.83 |
| 3595.829 |
0.302 |
25.1 |
6.4 |
2649.27 |
326.39 |
368.96 |
| 4111.72 |
0.458 |
17.2 |
7.9 |
2555.89 |
330.85 |
348.80 |
| 2727.92 |
0.183 |
21.7 |
3.5 |
83.21 |
755.81 |
717.92 |
| 935.488 |
0.096 |
36.6 |
0.5 |
0.3 |
1453.827 |
1452.93 |
| 896.699 |
0.014 |
36.2 |
0.5 |
0.12 |
1567.5246 |
1606.71052 |
| 3488.506 |
0.083 |
36 |
1.7 |
1.88 |
1226.1027 |
1295.50695 |
| 791.042 |
0.042 |
38.2 |
0.5 |
0.1 |
1590.1478 |
1606.71052 |
| 4201.722 |
0.012 |
35.5 |
0.9 |
0.39 |
1421.2722 |
1377.28022 |
| 1086.2 |
0.041 |
36.5 |
0.041 |
0.54 |
1380.8924 |
1407.1299 |
Table 10: Evaluation Criteria of the developed ANFIS Model.
| ANFIS Evaluation |
Transformer Voltage Rating |
| 150/20 kV |
500/150 kV |
| Training |
Testing |
Training |
Testing |
| Root Mean Square Error (RMSE) |
119.023 |
146.078 |
42.99 |
157.237 |
| Mean Absolute Error (MAE) |
75.46 |
111.03 |
17.44 |
127.001 |
| Mean Absolute Percentage Error (MAPE) |
9.15% |
13.89% |
1.26% |
9.66% |
| Accuracy (100% - error) |
90.85% |
86.11% |
98.74% |
90.34% |
Results reveal an acceptable accuracy level (over 86%) of the proposed ANFIS model to estimate the DP value of paper insulation. Thus the DP value can be estimated through the proposed four parameters: CO+CO2, acidity, interfacial tension and transformer oil colour. Results show that the higher the value of CO+CO2, the lower the DP value. On the other hand, the higher the value of oil interfacial tension, the higher the value of DP. Rapid estimation of the DP value can be also made with the information about transformer oil acidity and colour.
Conclusion
Measuring the degree of polymerization of operating transformers is challenging. Instead, the current utilities practice to assess paper degradation is based on calculating the DP value based on Furan contents in transformer oil. However, Furan analysis is not a regular test in most of Indonesian Electricity utilities. As such, this paper presents a new technique to estimate the DP value based on oil dielectric characteristics. Correlation analysis shows that the total carbon oxides dissolved in transformer oil, oil colour, acidity and IFT are strongly correlated with the DP value. This correlation is realized using ANFIS model. Results of the proposed ANFIS model reveal its high accuracy in predicting the DP value. While the overall accuracy is found to be higher than 86%, it can be enhanced using future measurements due to the adaptive nature of the model.
References
- Bakar NA, Abu Siada A, Islam S (2014) A review of dissolved gas analysis measurement and interpretation techniques. IEEE Electrical Insulation Magazine 30: 39-49.
- Abu-Siada A, Hmood S (2015) A New Fuzzy Logic Approach to Identify Power Transformer Criticality using Dissolved Gas-in-Oil Analysis. Int J Electr Power Energy Syst 67: 401-408.
- Abu-Siada A, Arshad M, Islam S (2010) Fuzzy Logic Approach to Identify Transformer Criticality using Dissolved Gas Analysis. IEEE PES General Meeting, USA.
- Abu Bakar N, Abu-Siada A (2016) Fuzzy Logic Approach for Transformer Remnant Life Prediction and Asset Management Decision. IEEE Trans Dielectr Electr Insul 23: 3199-3208.
- Abu-Siada A, Islam S (2012) A New Approach to Identify Power Transformer Critically and Asset Management Decision Based on Dissolved Gas-in-Oil Analysis. IEEE Trans Dielectr Electr Insul 19: 1007-1012.
- Fabre J, Pichon A (1960) Deteriorating processes and products of paper in oil. Application to transformers. CIGRE Paper 137: 18.
- Shroff DH, Stannett AW (1985) A review of paper aging in power transformers. Proc Inst Elect Eng C 132: 312-319.
- Brochure C (2007) Ageing of cellulose in mineral-oil insulated transformers.
- Kachler AJ, Hohlein I (2005) Aging of Cellulose Transformer Service Temperatures Influence of Type of Oil and Air on the Degree of Polymerization of Pressboard, Dissolved Gases and Furanic Compound in Oil. IEEE Electrical Insulation Magazine 21: 15-21.
- Myers SD, Kelly JJ, Parrish RH (1981) A guide to transformer maintenance. Transformer Maintenance Institute.
- Norazhar AB, Abu-Siada A, Islam S (2013) A review on chemical diagnosis techniques for transformer paper insulation degradation. Power Engineering Conference pp: 1-6.
- Badicu LV (2011) Diagnosis and monitoring of power transformer’s insulation systems. University Politehnica of Bucharest.
- Cheim L, Platts D, Prevost T, Xu S (2012) Furan Analysis for Liquid Power Transformers. IEEE Electrical Insulation Magazine 28: 1-14.
- Stebbins RD, Myer DS, Shkolnik AB (2003) Furanic Compound in Dielectric Liquid Samples: Review and Update of Diagnostic Interpretation and Estimation of Insulation Aging. 7th International Conference on Properties and Applications of Dielectric Material 3: 921-926.
- Forouhari S, Abu-Siada A (2015) Remnant life estimation of power transformer based on IFT and acidity number of transformer oil. Properties and Applications of Dielectric Materials (ICPADM), IEEE 11th International Conference pp: 552-555.
- Fu Q, Wang M, Chen T, Li X, Li J, et al. (2016) The relationship between carbon oxides in oil and thermal aging degree of oil-paper insulation. High Voltage Engineering and Application (ICHVE) IEEE International Conference pp: 1-4.
- Prasojo RA, Diwyacitta K, Gumilang H (2017) Transformer Paper Expected Life Estimation Using ANFIS Based on Oil Characteristics and Dissolved Gases (Case Study: Indonesian Transformers). Energ 10: 1135.
- Prasojo RA, Diwyacitta K, Gumilang H (2017) Transformer Paper Condition Assessment Using Adaptive Neuro Fuzzy Inference System Model. International Conference on Electrical Engineering and Computer Science pp: 237-242.
- Jang JSR (1993) ANFIS: Adaptive-Network-Based Fuzzy Inference System. IEEE Transactions on Systems, Man, and Cybernetics 23: 665-685.
- Cohen J, Cohen P, West SG, Aiken LS (1975) Applied Multiple Regression/Correlation Analysis for the Behavioral Science. Taylor and Francis.
- Karim ME (2014) Selection of the Best Regression Equation by sorting out Variables.
- Korea Standards Association (2003) Insulating Liquids-Determination of the Breakdown Voltage at Power Frequency-Test Method.
- IEC (1997) Insulating liquids—oil-impregnated paper and pressboard—determination of water by automatic coulometric Karl Fischer titration.
- IEC (2003) Insulating Liquids – Determination of acidity Part 1: Automatic potentiometric titration.
- American Society for Testing and Materials (1999) Standard test method for interfacial tension of oil against water by the ring method. ASTM International.
- International Organization for Standardization (1996) Petroleum Product – Determination of colour (ASTM scale).
- Erenturk K (2009) ANFIS-based compensation algorithm for current-transformer saturation effects. IEEE transactions on Power Delivery 24: 195-201.