Research Article - (2023) Volume 8, Issue 1
A Comparative Chaotic Analysis of COVID-19 Infection in Some States of Nigeria
Emmanuel J Ekpenyong,
Chisimkwuo John and
Charles Chinedu Nworu*
Department of Statistics, Michael Okpara University of Agriculture Umudike, Abia State, Nigeria
*Correspondence:
Charles Chinedu Nworu, Department of Statistics, Michael Okpara University of Agriculture Umudike,
Abia State,
Nigeria,
Tel: 7039444095,
Email:
Received: 22-Sep-2022, Manuscript No. IPJIDT-22-14412;
Editor assigned: 26-Sep-2022, Pre QC No. IPJIDT-22-14412 (PQ);
Reviewed: 10-Oct-2022, QC No. IPJIDT-22-14412;
Revised: 27-Dec-2022, Manuscript No. IPJIDT-22-14412 (R);
Published:
03-Jan-2023, DOI: 10.36648/2472-1093-8.1.52
Abstract
SARS-CoV-2 epidemic broke out in Wuhan, China in early December 2019. It spread across almost the entire continents of the world. Consequently, the World Health Organization (WHO) declared it a global pandemic on March 11, 2020. In Nigeria, sub-Saharan Africa, the first case of Coronavirus disease was confirmed by the federal ministry of health in Lagos state, the commercial nerve centre of the country. To assist government to make efficient decision making, we developed a forecasting model that will assist in predicting likely deaths. To achieve this, we used daily confirmed cases of COVID-19 from the Nigeria Centre for Disease Control (NCDC) database from 29th February 2020 to 16th August 2020 (comprising 167 observations). The dataset is of two categories; total (cumulative) daily confirmed cases by states and daily confirmed cases by states. The data for each selected state is modelled by four different methods, namely ARIMA, ARIMA with intervention, INAR and GARCH for the daily confirmed cases while the polynomial regression with AR, ARIMA, ridge regression and INAR were used to model the cumulative daily cases. For both cases, their performances were evaluated using five different measures MAE, MSE, RMSE, MAPE and sMAPE. Based on the computed figures, we can deduce that the ARIMA model is the most suitable for modelling the daily cumulative cases of COVID-19 in Lagos, Kano, Bauchi, Gombe and Edo states. The polynomial regression offers the best fitting model for predicting the daily cumulative cases in FCT and Rivers state while for Kaduna, Oyo and Ebonyi states, the most appropriate model is the ridge regression. Therefore, it is recommended that these models will guide the government in the decision making process.
Keywords
COVID-19; Machine learning; Forecasting; Time series; Daily cases; Cumulative daily cases
INTRODUCTION
SARS-CoV-2 epidemic broke out in Wuhan, China in early December, 2019. It spread across almost the entire continents of the world. Consequently, the World Health Organization (WHO) declared it a global pandemic on March 11, 2020 [1]. The outbreak of this disease was first announced on December 31, 2019 by the health commission of Hubei province, Wuhan city China, a cluster of unexplained cases of pneumonia of unknown case [2-4]. The confirmed cases of COVID-19 has symptoms like sneezing, fever, runny nose, dry cough, fatigue, breathing problem and bilateral lung infiltration leading to severe illness and death. Due to human mobility and communication, the dreaded disease has now spread throughout the world ravaging most countries. Among these mostly affected are Italy, USA and Europe [5]. Recently, the World has recorded 10,975,551 confirmed cases of COVID-19 infection, 522,753 deaths, 6,125,034 recoveries and 4,327,761 active cases [6]. In Nigeria, sub-Saharan Africa, the first case of Coronavirus disease was confirmed by the federal ministry of health in Lagos state, the commercial nerve centre of the country. The case was confirmed on the 27th of February, 2020. The case was on Italian citizen who worked in Nigeria and returned from Milan, Italy to Lagos [7]. This necessitated the federal government to activate the country’s national coronavirus emergency operation centre. A presidential task force on COVID-19 was also setup [8,9]. On 19th March, 2020, the federal government announced the closure of all tertiary institutions, secondary and primary schools in the country as part of the measures to control the spread of the dreaded disease in the country. Earlier, Nigeria had placed a travel ban on 13 countries with high cases of the virus; these countries are United States, UK, South Korea, Switzerland, Germany, France, Italy, China, Netherlands, Norway, Japan and Iran. On the 26th of March, 2020 reported that the federal government of Nigeria ordered the immediate closure of international airports and land borders in the country for a period of four (4) weeks and on 29th March, 2020, it suspended all passengers aircraft within the country including commercial and private jets. It also announced the lockdown of Lagos and Ogun states and Federal Capital Territory (FCT), Abuja, for a period of two (2) weeks from 11:00 pm on 30th March ordering the citizens of the affected states to stay at home, banning travel to and from the states and announcing a shutdown of business activities. The FG further exempted all essential services, which included health care services, food processing, petroleum distribution, banks, power generation and others. All these measures were taken to prevent further spread of the dreaded pandemic across the country of Nigeria. The various states at different days, weeks and months followed the federal government resolve to prevent the spread of the COVID-19 based on the peculiarities of individual states. Consequently, various stakeholders, such as Nigeria Centre for Disease Control (NCDC), World Health Organization (WHO), ministry of information, etc. Started creating awareness on individual’s precautionary measures on the community transmission of this dreaded pandemic. The precautionary measures include the use of hard sanitizers, frequent washing of hands, social or physical distancing, use of face mask, avoidance of gatherings and religious worships, avoiding contacts to people, etc. The federal and state governments continued to review the lockdown from time to time as they assessed the situation on ground. Recently, there have been the lifting of ban on interstate border closure and the reopening of worship centres with certain conditions. Amidst all these measures, COVID-19 infections have continued to increase across the various states of the country. Recently, as at 4th July, 2020, the total number of infected person’s stands at 27,504 with 628 deaths, 11,069 discharged cases and 15,867 active cases.
Materials and Methods
Since the outbreak of this coronavirus disease, many researchers and authors have made significant contributions on the modeling on the behavior and pattern of the spread and infections of the disease. Shinde et al. categorized the modeling and forecasting techniques of COVID-19 into four (4) major groups namely, big data, social media other communication media data, stochastic theory/mathematical models and data science/machine learning techniques. An outline forecasting mechanism that streams data from the Nigeria Centre for Disease Control (NCDC) to update the parameters of an ensemble model was used by to provide update forecasts of COVID-19 infection in Nigeria, every 24 hours. The Autoregressive Integrated Moving Average model (ARIMA), Prophet-(an additive regression model) and a Holt- Winters exponential smoothing model combined with Generalized Autoregressive Conditional Heteroscedasticity (GARCH) model. They concluded that it was difficult to model COVID-19 since it has the inherent modeling difficulties such as the number of tests, randomness, interventions, stay-athome compliance, curfews, epidemiological realities and many other factors. A mathematical model or stochastic model was used by to predict the dynamics of COVID-19 in 17 provinces of India and the overall India using six compartments namely susceptible, asymptomatic, recovered, infected, isolated and infected and quarantined susceptible. Their simulated model demonstrated that the elimination of ongoing COVID-19 pandemic is possible by combining the restrictive social distancing and contact tracing. Modelled Nigerian COVID-19 cases using a comparative analysis of models. They made used of the COVID-19 data collected for two months and applied different curve models to the data. They finally identified the quartic linear regression model with an Autocorrelation error of order 1 (AR1) as the most appropriate model. Box Jenkins model was used by to model the number of cases of COVID-19 infections in Nigeria from February, 27 to April 26, 2020. The ARIMA (1, 1, 0) model was finally selected among other ARIMA models based on the parameter test and Box Ljung test. A ten day forecast was made from the model which showed a steep upward trend of the spread of COVID-19 in Nigeria. Other authors such as used ARIMA, Cubist Regression (CUBIST), Random Forest (RF), Ridge Regression (RIDGE), Support Vector Regression (SVR), stacking ensemble learning to make a short-term forecasting of COVID-19 cumulative confirmed cases in Brazil. They ranked the models from best to worst as SVR, Stacking ensemble learning, ARIMA, CUBIST, RIDGE and RF models. The works so far undertaken in Nigeria as regards the modelling and forecasting of COVID-19 dwelt on the use of different chaotic models to model and forecast the total cumulative daily confirmed cases of the pandemic at different periods of time. This work seeks to compare the performances of different chaotic models not only on the total cumulative confirmed cases of COVID-19 in Nigeria but on the 10 most affected states of Nigeria. The model would be used to make forecasts, which would be rated on the basis of their performances based on certain accuracy measures and tests. The entire method of analysis adopted shall be machine learning. To validate our work, we used daily confirmed cases of COVID-19 from the Nigeria Centre for Disease Control (NCDC) database from 29th February 2020 to 16th August, 2020 (comprising of 167 observations). The dataset are of two categories; total daily confirmed cases in Nigeria and daily confirmed cases by states. For the latter, we selected daily confirmed cases for ten states. The selection was based on states with the highest number of active cases which cuts across the six geo-political zones. Next, we divided each dataset into training and test sets. We use 85% of the entire data for modelling and use the remaining 25% of the data for model validation.
Given Yt as the output series, let us discuss some of the methods below:
Auto Regressive Integrated Moving Average (ARIMA)
One of the most well-known and widely used families of time-series models includes the Auto Regressive Integrated Moving Average (ARIMA) models originally developed for economics applications. ARIMA models assume a linear correlation between the time-series values and attempt to exploit these linear dependencies in observations, in order to extract local patterns, while removing high-frequency noise from the data.
The model can be written as:
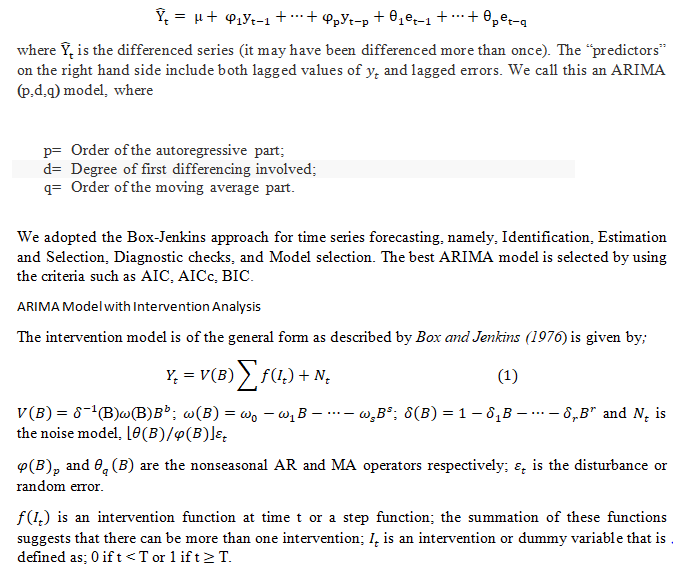
GJR-GARCH
The GJR model is an extension of the GARCH with an additional form which accounts for possible assumption in the series. Glosten et al., proposed an asymmetric model which allows for the conditional variance to have a different response to past negative and positive innovations.
The GJR-GARCH (1, 1) model is defined as:
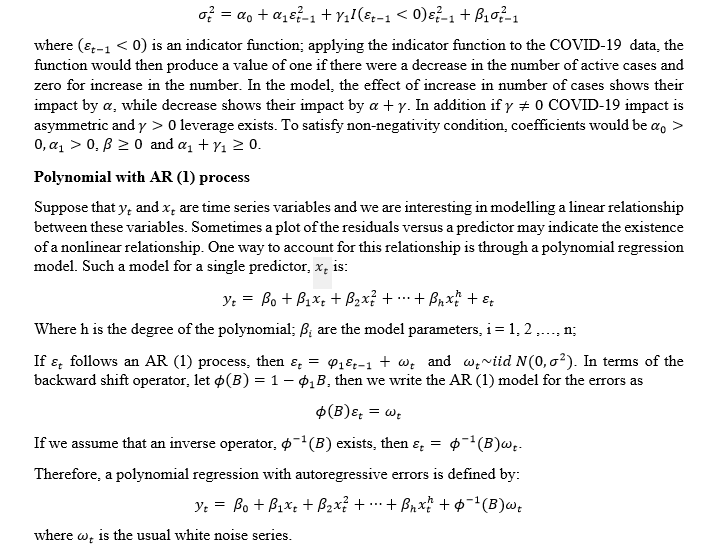
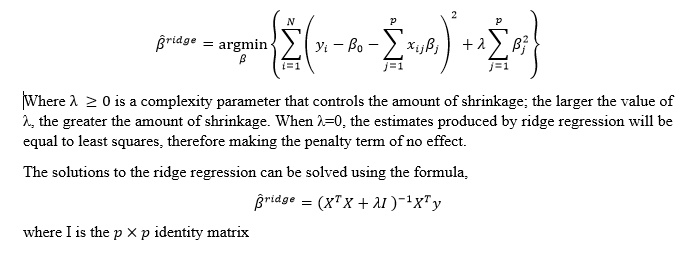
Ridge Regression
The ridge regression is an extension of the linear regression. It shrinks the traditional regression coefficients by imposing a penalty on their size. The ridge coefficients minimize a penalized residual sum of squares,
INAR
The integer-valued autoregressive process of first order (called INAR (1)) is recursively given by:
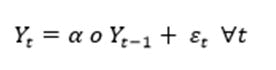

The basic assumption made under the Poisson distribution model is that the mean and variance are not statistical different, where the assumption fails, some distributions such as the negative binomial can be used.
Performance Evaluation
The under-listed evaluation methods can give important guidance in order to choose the appropriate models on the test data. The performance of alternative models can be examined by means of a set of evaluation metrics. The evaluation metrics used in the study are:
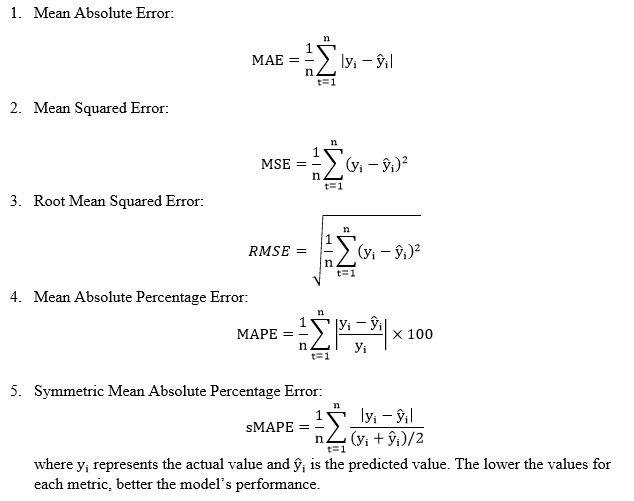
The statistics software R was used in all statistical computations in this study.
Analysis
The earlier discussed methods are used to analyse the ten most affected States in Nigeria. The results of the analyses are then compared.
Results and Discussion
Tables 1-10 presents the results of the accuracy statistics for the daily cases of COVID-19 for ten different states respectively. The data for each state is modelled by four different methods, namely ARIMA, ARIMA with intervention, INAR and GARCH and performances evaluated using five different measures MAE, MSE, RMSE, MAPE and sMAPE. Based on these performance measures, the best fitting and competitive models for predicting the daily cases of COVID-19 was achieved by the GARCH model for Lagos state, ARIMA with intervention for FCT and Kano state respectively, INAR for Kaduna state, ARIMA, ARIMA with intervention and GARCH models for Bauchi, INAR for Gombe, ARIMA for Rivers state, GARCH for Edo and Oyo states respectively and INAR model for Ebonyi state. The selection were made based on the model with the lowest performance measure statistics.
| Models |
MAE |
MSE |
RMSE |
MAPE |
sMAPE |
| ARIMA (1,1,1) |
50.81 |
3125.95 |
55.91 |
61.92 |
0.3202 |
| ARIMA with intervention |
56.07 |
3812.06 |
61.74 |
69.29 |
0.3478 |
| INAR |
54.58 |
3851.86 |
62.06 |
68.25 |
0.3407 |
| GARCH |
49.35 |
2958.13 |
54.39 |
59.7 |
0.3121 |
Table 1: Models performance measures for the daily cases of COVID-19 in Lagos state.
| Models |
MAE |
MSE |
RMSE |
MAPE |
sMAPE |
| ARIMA (0,1,1) with drift |
32.57 |
1528.44 |
39.1 |
110.42 |
0.4227 |
| ARIMA with intervention |
25.93 |
907.06 |
30.12 |
78.1 |
0.3531 |
| INAR |
27.97 |
1040.18 |
32.25 |
81.69 |
0.3741 |
| GARCH |
27.81 |
1109.95 |
33.32 |
92.01 |
0.3783 |
Table 2: Models performance measures for the daily cases of COVID-19 in FCT.
| Models |
MAE |
MSE |
RMSE |
MAPE |
sMAPE |
| ARIMA (1,1,2) |
11.52 |
222.02 |
14.9 |
Inf |
0.9897 |
| ARIMA with intervention |
8.94 |
197.49 |
14.05 |
Inf |
0.8907 |
| INAR |
9.66 |
198.45 |
14.09 |
Inf |
0.9202 |
| GARCH |
12.44 |
239.56 |
15.48 |
Inf |
1.0159 |
Table 3: Models performance measures for the daily cases of COVID-19 in Kano state.
| Models |
MAE |
MSE |
RMSE |
MAPE |
sMAPE |
| ARIMA (2,1,1) with drift |
16.03 |
318.08 |
17.83 |
Inf |
0.5937 |
| ARIMA with intervention |
14.4 |
267.94 |
16.37 |
Inf |
0.5512 |
| INAR |
13.15 |
284.13 |
16.86 |
Inf |
0.5071 |
| GARCH |
14.62 |
271.69 |
16.48 |
Inf |
0.5593 |
Table 4: Models performance measures for the daily cases of COVID-19 in Kaduna state.
| Models |
MAE |
MSE |
RMSE |
MAPE |
sMAPE |
| ARIMA (0,1,1) |
1.87 |
14.1 |
3.76 |
Inf |
0.9618 |
| ARIMA with intervention |
1.82 |
14.13 |
3.76 |
Inf |
0.9525 |
| INAR |
3.17 |
17.16 |
4.14 |
Inf |
1.1714 |
| GARCH |
1.87 |
14.09 |
3.75 |
Inf |
0.9645 |
Table 5: Models performance measures for the daily cases of COVID-19 in Bauchi state.
| Models |
MAE |
MSE |
RMSE |
MAPE |
sMAPE |
| ARIMA (0,1,1) |
5.01 |
76.07 |
8.72 |
Inf |
1.2764 |
| ARIMA with intervention |
5.06 |
75.11 |
8.67 |
Inf |
1.2674 |
| INAR |
4.92 |
70.48 |
8.4 |
Inf |
1.2615 |
| GARCH |
5 |
76.23 |
8.73 |
Inf |
1.2778 |
Table 6: Models performance measures for the daily cases of COVID-19 in Gombe state.
| Models |
MAE |
MSE |
RMSE |
MAPE |
sMAPE |
| ARIMA (4,1,4) |
10.58 |
184.19 |
13.57 |
Inf |
0.5816 |
| ARIMA with intervention |
12.68 |
222.97 |
14.93 |
Inf |
0.6401 |
| INAR |
11.38 |
191.74 |
13.85 |
Inf |
0.6196 |
| GARCH |
12.39 |
273.05 |
16.52 |
Inf |
0.664 |
Table 7: Models performance measures for the daily cases of COVID-19 in Rivers state.
| Models |
MAE |
MSE |
RMSE |
MAPE |
sMAPE |
| ARIMA (0,1,2) |
21.16 |
544.55 |
23.34 |
Inf |
0.8895 |
| ARIMA with intervention |
30.88 |
1114.98 |
33.39 |
Inf |
1.0194 |
| INAR |
24.11 |
734.65 |
27.1 |
Inf |
0.9243 |
| GARCH |
21.08 |
540.14 |
23.24 |
Inf |
0.8884 |
Table 8: Models performance measures for the daily cases of COVID-19 in Edo state.
| Models |
MAE |
MSE |
RMSE |
MAPE |
sMAPE |
| ARIMA (2,1,2) |
46.34 |
3221.45 |
56.76 |
Inf |
1.3802 |
| ARIMA with intervention |
27.28 |
2063.52 |
45.43 |
Inf |
0.9478 |
| INAR |
31.27 |
1819.23 |
42.65 |
Inf |
0.7786 |
| GARCH |
25.72 |
2085.25 |
45.66 |
Inf |
0.7125 |
Table 9: Models performance measures for the daily cases of COVID-19 in Oyo state.
| Models |
MAE |
MSE |
RMSE |
MAPE |
sMAPE |
| ARIMA (5,1,3) with drift |
9.71 |
142.11 |
11.92 |
Inf |
0.9171 |
| ARIMA with intervention |
8.24 |
90.79 |
9.53 |
Inf |
0.9087 |
| INAR |
7.76 |
80.19 |
8.95 |
Inf |
0.9922 |
| GARCH |
7.79 |
82.96 |
9.11 |
Inf |
0.8991 |
Table 10: Models performance measures for the daily cases of COVID-19 in Ebonyi state.
The statistics of the performance measures for the cumulative cases of COVID-19 in different states are displayed in Tables 11-20. Accordingly, the cumulative cases were modelled by the following statistical models-polynomial regression with AR (1) process, ARIMA, ridge regression and INAR models. The most suitable models were selected based on the highest accuracy statistics (lowest, MAE, MSE, RMSE, MAPE and sMAPE). Based on the computed figures, we can deduce that the ARIMA model is the most suitable for modeling the daily cumulative cases of COVID-19 in Lagos, Kano, Bauchi, Gombe and Edo states. The polynomial regression offers the best fitting model for predicting the daily cumulative cases in FCT and Rivers state while for Kaduna, Oyo and Ebonyi states, the most appropriate model is the ridge regression.
| Models |
MAE |
MSE |
RMSE |
MAPE |
sMAPE |
| Polynomial with AR(1) of order 4 |
965.99 |
1391008 |
1179.41 |
6.12 |
0.0421 |
| ARIMA (1,2,1) |
331.01 |
181915.4 |
426.52 |
2.09 |
0.0138 |
| Ridge regression |
2917.88 |
10180563 |
3190.7 |
18.7 |
0.1163 |
| INAR |
7523.15 |
60521459 |
7779.55 |
48.62 |
0.3914 |
Table 11: Models performance measures for the cumulative cases of COVID-19 in Lagos state.
| Models |
MAE |
MSE |
RMSE |
MAPE |
sMAPE |
| Polynomial with AR(1) of order 4 |
166.78 |
41223.5 |
203.04 |
3.99 |
0.0261 |
| ARIMA (0,2,1) |
218.99 |
60417.92 |
245.8 |
5.31 |
0.0347 |
| Ridge regression |
270.99 |
76324.55 |
276.27 |
6.85 |
0.0468 |
| INAR |
1075.42 |
1531205 |
1237.42 |
25.64 |
0.1916 |
Table 12: Models performance measures for the cumulative cases of COVID-19 in FCT.
| Models |
MAE |
MSE |
RMSE |
MAPE |
sMAPE |
| Polynomial with AR(1) of order 4 |
221.66 |
62233.94 |
249.47 |
13.65 |
0.0965 |
| ARIMA (1,2,2) |
52.43 |
4056.81 |
63.69 |
3.23 |
0.0212 |
| Ridge regression |
218.88 |
53168.58 |
230.58 |
13.63 |
0.0866 |
| INAR |
503.1 |
309673.2 |
556.48 |
31.04 |
0.2367 |
Table 13: Models performance measures for the cumulative cases of COVID-19 in Kano state.
| Models |
MAE |
MSE |
RMSE |
MAPE |
sMAPE |
| Polynomial with AR(1) of order 4 |
110.26 |
17651.27 |
132.86 |
6.9 |
0.0446 |
| ARIMA (2,2,1) |
136.24 |
24776.61 |
157.41 |
8.61 |
0.0553 |
| Ridge regression |
41.32 |
2748.15 |
52.42 |
2.91 |
0.0197 |
| INAR |
762.45 |
709782.6 |
842.49 |
48.45 |
0.3991 |
Table 14: Models performance measures for the cumulative cases of COVID-19 in Kaduna state.
| Models |
MAE |
MSE |
RMSE |
MAPE |
sMAPE |
| Polynomial with AR(1) of order 3 |
20.96 |
702.52 |
26.51 |
3.66 |
0.02488 |
| ARIMA (0,2,1) |
6.24 |
47.95 |
6.92 |
1.1 |
0.0074 |
| Ridge regression |
206.05 |
45629 |
213.61 |
36.46 |
0.2154 |
| INAR |
138.79 |
24374.6 |
156.12 |
24.38 |
0.1811 |
Table 15: Models performance measures for the cumulative cases of COVID-19 in Bauchi state.
| Models |
MAE |
MSE |
RMSE |
MAPE |
sMAPE |
| Polynomial with AR(1) of order 3 |
46.7 |
2937.41 |
54.2 |
7.42 |
0.0479 |
| ARIMA (0,2,1) |
24.22 |
747.15 |
27.33 |
3.85 |
0.026 |
| Ridge regression |
186.53 |
37934.04 |
194.77 |
29.94 |
0.1805 |
| INAR |
216.02 |
57300.48 |
239.29 |
34.29 |
0.2655 |
Table 16: Models performance measures for the cumulative cases of COVID-19 in Gombe state.
| Models |
MAE |
MSE |
RMSE |
MAPE |
sMAPE |
| Polynomial with AR(1) of order 4 |
26.06 |
1061.72 |
32.58 |
1.38 |
0.0093 |
| ARIMA (4,2,4) |
62.25 |
4793.99 |
69.24 |
3.36 |
0.0027 |
| Ridge regression |
230.48 |
71493.16 |
267.38 |
12.24 |
0.0776 |
| INAR |
519.02 |
332560.3 |
576.68 |
27.64 |
0.2073 |
Table 17: Models performance measures for the cumulative cases of COVID-19 in Rivers state.
| Models |
MAE |
MSE |
RMSE |
MAPE |
sMAPE |
| Polynomial with AR(1) of order 4 |
731.65 |
762053.7 |
872.96 |
31.67 |
0.1845 |
| ARIMA (3,2,0) |
199.69 |
63599.02 |
252.19 |
8.61 |
0.0549 |
| Ridge regression |
199.86 |
63260.01 |
251.52 |
8.7 |
0.0559 |
| INAR |
968.65 |
1113108 |
1055.04 |
42.26 |
0.338 |
Table 18: Models performance measures for the cumulative cases of COVID-19 in Edo state.
| Models |
MAE |
MSE |
RMSE |
MAPE |
sMAPE |
| Polynomial with AR(1) of order 4 |
410.35 |
289616 |
538.16 |
14.4 |
0.0891 |
| ARIMA (2,2,2) |
708.65 |
590735.5 |
768.59 |
25.28 |
0.1867 |
| Ridge regression |
194.09 |
47971.55 |
219.02 |
7.19 |
0.0488 |
| INAR |
1160.84 |
1525767 |
1235.22 |
41.53 |
0.3276 |
Table 19: Models performance measures for the cumulative cases of COVID-19 in Oyo state.
| Models |
MAE |
MSE |
RMSE |
MAPE |
sMAPE |
| Polynomial with AR(1) of order 4 |
262.33 |
90040.68 |
300.07 |
30.55 |
0.1808 |
| ARIMA (0,2,1) |
68.96 |
6339.03 |
79.62 |
8.03 |
0.0518 |
| Ridge regression |
45.7 |
2687.13 |
51.84 |
5.49 |
0.0366 |
| INAR |
324.61 |
129400.2 |
359.72 |
38.01 |
0.2987 |
Table 20: Models performance measures for the cumulative cases of COVID-19 in Ebonyi state.
The plots of the actual and predicted values for different models of the daily and cumulative cases of COVID-19 in different states are shown in Figures 1-10 respectively. The area for each figure is divided into training and test set. We observe that the GARCH model provided a better fit because the actual data tend to be closer to predicted data in Lagos, Bauchi, Edo and Oyo states. The ARIMA with intervention is suitable for predicting daily cases in FCT, Kano and Bauchi states respectively, while the INAR is appropriate for Kaduna, Gombe and Ebonyi states.

Figure 1: (a) The plots of the actual and predicted values (for different models) of the daily cases of COVID-19 in Lagos state. (b) The plots of the actual and predicted values (for different models) of the cumulative cases of COVID-19 in Lagos state.

Figure 2: (a) The plots of the actual and predicted values (for different models) of the daily cases of COVID-19 in FCT. (b) The plots of the actual and predicted values (for different models) of the cumulative cases of COVID-19 in FCT.

Figure 3: (a) The plots of the actual and predicted values (for different models) of the daily cases of COVID-19 in Kano state.(b) The plots of the actual and predicted values (for different models) of the cumulative cases of COVID-19 in Kano state.

Figure 4: (a) The plots of the actual and predicted values (for different models) of the daily cases of COVID-19 in Kaduna state. (b) The plots of the actual and predicted values (for different models) of the cumulative cases of COVID-19 in Kaduna state.

Figure 5: (a) The plots of the actual and predicted values (for different models) of the daily cases of COVID-19 in Bauchi state. (b) The plots of the actual and predicted values (for different models) of the cumulative cases of COVID-19 in Bauchi state.

Figure 6: (a) The plots of the actual and predicted values (for different models) of the daily cases of COVID-19 in Gombe state. (b) The plots of the actual and predicted values (for different models) of the cumulative cases of COVID-19 in Gombe state.

Figure 7: (a) The plots of the actual and predicted values (for different models) of the daily cases of COVID-19 in Rivers state. (b) The plots of the actual and predicted values (for different models) of the cumulative cases of COVID-19 in Rivers state.

Figure 8: (a) The plots of the actual and predicted values (for different models) of the daily cases of COVID-19 in Edo state. (b) The plots of the actual and predicted values (for different models) of the cumulative cases of COVID-19 in Edo state.

Figure 9: (a) The plots of the actual and predicted values (for different models) of the daily cases of COVID-19 in Oyo state. (b) The plots of the actual and predicted values (for different models) of the cumulative cases of COVID-19 in Oyo state.

Figure 10: (a) The plots of the actual and predicted values (for different models) of the daily cases of COVID-19 in Ebonyi state. (b) The plots of the actual and predicted values (for different models) of the cumulative cases of COVID-19 in Ebonyi state.
Conclusion
For the cumulative cases, according to the information depicted the behavior of the data is learned by the ARIMA model, which makes forecasting the daily cases compatible with the observed values. The polynomial regression with AR(1) process was able to capture the variability of the actual test data, while the ridge regression was adequate.
References
- Zhu N, Zhang D, Wang W, Li X, Yang B, et al. (2020) A novel Coronavirus from patients with pneumonia in China-2019. N Engl J Med. 382(8):727-733.
[Crossref] [Google Scholar] [PubMed]
- Wu Z, Googan JMM (2020) Characteristics of and important lessons from the Coronavirus disease 2019 (COVID-19) outbreak in China: Summary of a report of 72,314 cases from the Chinese centre for disease control and prevention. JAMA. 323(13):1239-1242.
[Crossref] [Google Scholar] [PubMed]
- Cohen J, Normile D (2020) New SARS-like virus in China triggers alarm. Science. 367(6475):234-235.
[Crossref] [Google Scholar] [PubMed]
- Adepoju P (2020) Nigeria responds to COVID-19; first case detected in sub-Saharan Africa. Nat Med. 26(4):444-448.
[Crossref] [Google Scholar] [PubMed]
- Shinde GR, Kalamkar AB, Mahalle PN, Dey N, Chaki J, et al. (2020) Forecasting models for Coronavirus disease (COVID-19): A survey of the state-of-the-Art. IEEE Access Comp Sci. 15(8):197.
[Crossref] [Google Scholar] [PubMed]
- Abdulmajeed K, Adeleke M, Popoola L (2020) Ouline Forecasting of COVID-19 cases in Nigeria using limited data. Data Brief. 30(20):105683.
[Crossref] [Google Scholar]
- Sarkar K, Khayanchi S, Nieto JJ (2020) Modeling and forecasting the COVID-19 pandemic in India. Chaos Solitons Fractals. 130(1):110049.
[Crossref] [Google Scholar] [PubMed]
- Ayinde A, Lukman AF, Rauf RJ, Alabi OO, Okon CE, et al. (2020) Modeling Nigerian COVID-19 causes: A comparative analysis of models and estimators. Chaos Solitons Fractals. 138:109911.
[Crossref] [Google Scholar] [PubMed]
- Ibrahim RR, Oladipo HO (2020) Forecasting the spread of COVID-19 in Nigeria using Box-Jenkins modeling procedure. Comp Sci Med-medRxN. 4(1):1-15.
[Crossref] [Google Scholar]
Citation: Ekpenyong JE, John C, Nworu CC (2023) A Comparative Chaotic Analysis of COVID-19 Infection in Some States of Nigeria. J Infect Dis Treat. 9:52
Copyright: ©2023 Ekpenyong JE, et al. This is an open-access article distributed under the terms of the Creative Commons Attribution License, which permits unrestricted use, distribution and reproduction in any medium, provided the original author and source are credited.